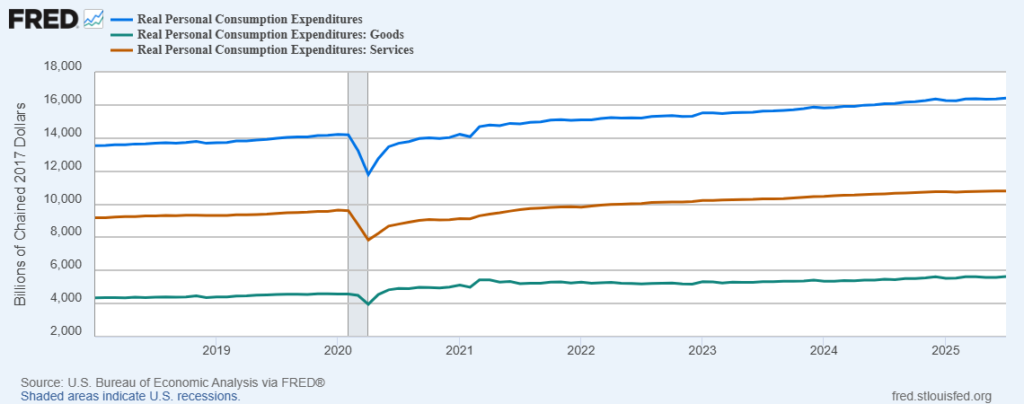
This morning the Bureau of Economic Analysis reported that real (inflation adjusted) Personal Consumption Expenditures increased 0.3 percent in July. Please see chart below.
According to the BEA, “Personal income increased $112.3 billion (0.4 percent at a monthly rate) in July, according to estimates released today by the U.S. Bureau of Economic Analysis. Disposable personal income (DPI)—personal income less personal current taxes—increased $93.9 billion (0.4 percent) and personal consumption expenditures (PCE) increased $108.9 billion (0.5 percent) [nominal not real]. Personal outlays—the sum of PCE, personal interest payments, and personal current transfer payments—increased $110.9 billion in July. Personal saving was $985.6 billion in July and the personal saving rate—personal saving as a percentage of disposable personal income—was 4.4 percent.”
Bloomberg’s coverage opened with this framing, “US consumer spending rose in July by the most in four months, indicating resilient demand in the face of stubborn inflation…. The advance was boosted by income growth and driven by goods.”
Yesterday (Thursday) morning the BEA released a regularly scheduled revision of its second quarter US GDP estimate, adjusting the rate of growth to 3.3 percent compared to the originally estimated 3.0 percent. Second quarter business investment was, in particular, much stronger than the flash report, up 5.7 percent in the revision versus 1.9 percent in the original.
Also on Thursday the Department of Labor reported a declining number of both initial and continuing nationwide jobless claims. According to the Department’s summary, “In the week ending August 23, the advance figure for seasonally adjusted initial claims was 229,000, a decrease of 5,000 from the previous week’s revised level. The previous week’s level was revised down by 1,000 from 235,000 to 234,000. The 4-week moving average was 228,500, an increase of 2,500 from the previous week’s revised average. The previous week’s average was revised down by 250 from 226,250 to 226,000.”
“The unemployment rate has been relatively stable because layoffs are low,” Nancy Vanden Houten, lead U.S. economist at Oxford Economics told Reuters. “Going forward, slower labor force growth will also hold down the unemployment rate, masking some of the potential fissures in the labor market.”
A significant number of Americans have money to spend and are spending it. The estimated inflation rate on goods declined in July (and was even slightly deflationary). Services inflation is considerably higher. But, so far, slowly increasing demand for services has hit new all time highs every month since April.
Huge flows of stuff are moving. But shipment numbers are down. Imports are widely thought to have peaked early and are now expected to deteriorate. Freight flow is likely to tread water — and occasionally sink a bit below the surface — for the next several months. Transpacific flows will be especially slow. Tariff-related troubles will continue to complicate both flow velocities and costs (here and here).
In a high volume, high velocity contemporary demand and supply network, such as that serving US, the sort of steady pull demonstrated by the chart below will usually be fulfilled with increasing efficiency at reduced capacity and, often, with increased concentration of capacity. The result is robust — but marginally less resilient — capacity. When and where capacity concentrations continue to function, network adaptability should be significant. When and where capacity concentrations begin to fail, the risk of catastrophic network failure is also significant.