Category: Uncategorized

Vulnerability can multiply or divide

The 2024 Atlantic Hurricane Season opened with a big bang named Beryl, the earliest-forming Category 5 storm on record. Outcomes in the Caribbean, Gulf, and east Texas punctuated the forecast for more high-energy storms. But Chris and Debby were mostly rain events. Ernesto saved his worst for the open ocean. Since mid-August, not much.

Axios summarizes, “The Atlantic Ocean is near record warm, and a favorable La Niña climate cycle is developing in the tropical Pacific Ocean. Yet at what is normally the peak of hurricane season, the ocean basin has stubbornly stayed in a deep slumber.” (More and more.) Even as there remains plenty of time, heat, and opportunity for the Atlantic season to re-awaken.

Still, for those of us who begin mornings with NHC maps or ECENS loops, our respect for threat variability and uncertainty has been reinforced. The data models and forecast methods are insightful and helpful. But Complex Adaptive Systems resist precise prediction even as they reward strategic anticipation.

Threat vectors are especially difficult to predict. Potential reproduction rates for gray rhinos and black swans can overwhelm — and in this context our tendency for risk discounting is not entirely self-subverting (if we are self-aware and self-correcting regarding this cognitive vulnerability).

Tropical Storm Ernesto produced plenty of mayhem in the Lesser Antilles, Puerto Rico, and US Virgin Islands. But Ernesto did not reach hurricane strength until north of Puerto Rico and east of the Bahamas. Shipping and swimmers could avoid Ernesto’s threat by not exposing their vulnerability and thereby not suffering consequences.

Threats are multiplied or divided by vulnerability and this outcome is then multiplied by consequence. Electrical grids are innately vulnerable to strong storms, the stronger the storm the greater the threat. The more innately fragile a specific network’s structure, the greater the impact of any threat’s impact. The larger the population dependent on this network, the greater the consequence of this interplay of threat with vulnerability.

The interdependencies of threat, vulnerability, and consequence are highlighted in a recent analysis of global insured risk. Verisk reports, “the average annual loss (AAL) from global natural catastrophes has reached a new high of $151 billion (with non-crop losses making up $119 billion). Additionally, the average exposure growth is expected to be 7.2 percent… ” (See chart below.)

Verisk gives close attention to 1) Rapid Urban Expansion, 2) Surge in Event Frequency, and 3) Climate Variability/Climate Change as principal sources of this exposure growth (amplified by inflation). Climate change is implicated in increased event frequency. Urban expansion has been especially pronounced in places exposed to climate related hazards (e.g. hurricanes, wildfire).

Verisk models for US/Caribbean hurricanes and wildfires project AAL will increase “at least 1% year-on-year for each of these perils due to climate change.” As this threat-level increases incrementally, in some places vulnerability and consequence multipliers can increase much faster. As more people gather in more densely populated places, critical infrastructure, supply chain capacity, and exposed loss potential follow. Even if a hazard’s hitting power remains the same, vulnerability multiplied by consequence makes for a much fatter target. A softball is easier to hit that a baseball. Even I can hit a volleyball. When an unusually powerful hitter encounters one of these fat targets — say an M8-plus earthquake at Memphis or Seattle — take cover quick.

In most of the United States, Japan, and Europe most supply chains are resilient — unless concentrated flow capacity is seriously disrupted or destroyed. I give most of my attention to how supply chains can continue to fulfill demand even when the grid is gone, telecoms are sparse, and transportation networks are fractured. When concentrated capacity survives for crucial products (e.g., water, food, and fuel) restoring flow can be very tough but doable. The vulnerability that is most challenging to mitigate is the loss of a high proportion capacity concentration (or two or three). But even this is vulnerability that can be reduced if strategically anticipated and meaningfully engaged before the hit is received.

+++

September 7 Update: AccuWeather outlines five reasons for the paucity of tropical storms this season.

July PCE for Food

In July 2019 residents of the United States, according to the Bureau of Economic Analysis, expended 1, 081 billion “real” inflation-adjusted dollars on Food-At-Home. This July we spent 1, 173 billion real dollars on groceries and related, about eight percent more. With inflation included, in July 2024 we spent almost 26 percent more on groceries than in July 2019. This compares to a roughly 19 percent inflation rate for all personal consumption expenditures. See chart below where blue is nominal dollars expended on groceries and red is real dollars (chained 2017 dollars).

There is disagreement regarding the cause of late-pandemic and post-pandemic inflation. There is even more controversy regarding food price increases (at link see August 28 Update below video). The classic cause of inflation is a mismatch of demand and supply where “too much” demand is chasing “too little” supply. The more time-extended this mismatch the more inflation. The more intense — even price-insensitive — the demand, the higher prices will track.

Before the pandemic many Americans spent over half their food dollars eating away from home. From March 2020 through the end of 2021 spending on Food-Away-From-Home was disrupted. Consumers shifted their food dollars from eating out to eating in. This created a classic mismatch of demand and supply. Food prices increased accordingly (again, see chart below).

What has surprised me is how demand for Food-At-Home has remained well above pre-pandemic patterns even as consumers returned to eating out. By mid-summer 2021 US consumers were spending about the same nominal dollars at “food and beverages places” as we were pre-pandemic (today we are spending one-fifth more eating out than in July 2021). Late summer 2021 we finally stopped spending consistently more real dollars on groceries. Between January 2022 and March 2023 we reduced our real grocery spending by almost five percent. This makes sense. This reflects our return to restaurants, fast food, and other Food-Away-From-Home. I expected this gradual rebalancing to continue.

But by mid-Spring 2023 this spending adjustment stopped. Since this Spring — even as food inflation has flattened — US consumers have started spending more real dollars at the grocery store, even as we spend more more than ever before on eating out.

In late July and early August McKinsey and Company interviewed a statistically valid sample of US consumers. Among the questions asked was, “With regard to products and services you will spend money on, do you plan to splurge/treat yourself over the next 3 months? For example, are there categories of products or services where you expect to make more expensive purchases than normal or purchase something to treat yourself?” Food is the most popular answer, see second chart below. Among Millennials and GenX consumers food is even more a “treat” than for others. According to this and similar findings, food is now less a staple and much more a discretionary expense — even a small luxury.

A supply chain for staples is different than a supply chain for luxury goods. Demand for staples is — or usually has been — less volatile than that for luxury. A paternal great-grandfather was a tailor. My grandfather explained that he became a grocer, “because I was the best dressed kid in school but was always hungry.” But for the last generation “Center Store” — where most of the staples are shelved — has consistently declined as a proportion of total sales. Fresh and prepared foods are the profit leaders. Is Food-At-Home an emerging luxury category? Produce, cheese, olive, and sushi cases suggest yes. The proliferation of and throughput at food banks suggest no.

High volume, high velocity supplies originating from many different places and flowing to many different places with sustained, demonstrable, effectual demand implies an innately resilient system. So far, many luxury-oriented “treats” have been well-integrated into nodes and channels that deliver staples. Center-Store flows have not become appreciably less resilient and supply chains for fresh, prepared, and other periphery-products have become more resilient. Everything is more complicated, costly, and complex (which has resilience implications) and the system-as-system is robust.

The food production and logistics capabilities that supplied my grandfather’s grocery stores could never have fulfilled contemporary density, diversity, and intensity of demand — at any reasonable price-point. Today’s supply networks have demonstrated amazing resilience when 1) effectual demand persists and 2) capacity concentrations continue operations. If effectual demand is lost, but capacity concentrations persist , flows can continue and often will continue unless the network determines demand is not coming back anytime soon.

Loss of upstream or midstream capacity is more quickly and certainly a fatal blow. It depends on context — especially distance from other sources of capacity — but once food networks experience long-term loss of between one-quarter and one-third of capacity, the preexisting flow network is unlikely to survive. A new network may form around surviving push capacity and continued demand pull, but at least in my mind this is less a matter of resilience and much more a matter of triage. It is also true that in the thirty-plus years since the emergence of the contemporary food supply chain we have not experienced anything close to the loss of such a huge capacity proportion for a full network over a wide area. I would prefer to avoid any significant opportunity to prove or disprove this hypothesis.

Demand as Strength and Vulnerability

Supply is generated, delivered, and sold to fulfill demand. Supply Chain fitness reflects the capacity of upstream and midstream supply to fulfill downstream demand in a timely and affordable way. Contemporary high volume, high velocity supply chains depend on persistent (preferably increasing) demand.

During the month of July real — inflation-adjusted — personal consumption expenditures in the United States continued to slowly expand in a manner that should support Supply Chain Resilience. See the first chart below, where blue is real PCE for services and red is real PCE for goods. Explaining July results, the Bureau of Economic Analysis offers, “The 0.4 percent increase in real PCE in July reflected an increase of 0.7 percent in spending on goods and an increase of 0.2 percent in spending on services. Within goods, the largest contributor to the increase was motor vehicles and parts. Within services, the largest contributor to the increase was health care.”

Reuters reports, “Consumer spending, which accounts for more than two-thirds of U.S. economic activity, rose 0.5% last month after advancing by an unrevised 0.3%… After adjusting for inflation, consumer spending gained 0.4% after rising 0.3% in June, and implied that spending retained the momentum from the second quarter, when it helped to boost gross domestic product growth to a 3.0% annualized rate.” That solid increase in GDP suggests the current level of demand is more than ephemeral. See the second chart below, where blue is real GDP and red is GDP per capita. At least for me this steady increase in both GDP and demand is especially impressive as evidence accumulates that the lower earning two-fifths of consumers are cutting back (even as the highest earning one-fifth spends more, here and here and here).

For those making and moving and selling goods that are purchased directly by consumers, this demand pattern supports continuity, operating efficiencies, and confidence. During 2023 and early 2024 soft freight demand and more excess capacity resulted in a tough freight market. Some excess capacity has since been shed. Improved second quarter demand has resulted in much more sustainable rates in many markets for many carriers. See the third chart below.

Is something close to current demand and supply sustainable? There are known risks. If an October 1 dock-workers strike happens, US freight flows, especially east of the Mississippi will be disrupted. Labor issues and other constraints in Mexico and Canada have downstream implications for the US. Prospects for a China-US Trade War seem entirely plausible (here and here and here). We are in the early stages of a significant re-wiring of global supply chains (here and here). Accelerating US federal debt and interest payments threaten to suppress economic growth (here and here and here and here). Any high-end seismic event along the San Andreas, Cascadia, or New Madrid faults could have devastating long-term impacts on US supply chains. Losing more than one major refinery in the same hurricane season would be a serious challenge (here and here). There are, of course, plenty more Gray Rhinos, Black Swans, and other exogenous exotics.

Supply Chain Resilience is, however, less about any specific threat and much more about systemic vulnerabilities. Such vulnerabilities are almost always the dark side of a significant strength. US supply chains are well-organized around high-volume, high-velocity patterns of demand. Where there is effectual demand, supply chains will scurry to adapt. Any sudden and sustained shift in demand patterns will cause cascading complications, disruptions, and delays — as seen during the pandemic. As also demonstrated in 2020-2022, those supply chains with the best understanding of and engagement with demand dynamics are the most effective and agile at adapting.

Current Condition of Adaptive Flows

Most freight movements are local. But local deliveries often depend on significant upstream flows. Below is a map that the US Bureau of Transportation Statistics developed showing upstream flows by proportional ton for the United States. Some crucial domestic flows depend on global flows (mostly maritime flows) suggested by the screen capture farther below of August 22’s ocean vessel traffic.

Late in the pandemic volumes delivered to US east coast ports — through both the Panama and Suez canals — grew in part to avoid congestion at US west coast ports. Flows through the Suez Canal now have dwindled due to the Houthi threat in the Red Sea. Flows around the Cape of Good Hope have surged, but mostly toward European destinations. The transpacific channel, especially into the ports of Los Angeles and Long Beach, has grown for many reasons including a possible October 1 dockworkers strike for US east coast and Gulf ports. The continuing risk of a rail shutdown in Canada has pointed even more vessels toward US west coast ports.

Pandemic era congestion and other sources of domestic freight friction prompted an expansion in US freight capacity. In December 2019 there were just about 1.65 million carriers in the United States. By December 2022 there were over 2 million carriers. That’s where the US has more or less remained even as the number of trucks, drivers, and hours driven has slowly declined from a summer 2022 peak. (Here and here and here.) Despite softening consumer demand, volatile fuel costs, and many other pinch-points, US freight capacity continues to be robust — probably even a bit higher than needed.

Demand growth for freight has slowed, especially for direct purchases of goods. But demand remains at least five percent above pre-pandemic trend even for goods. Food inflation is way down. Upstream food flows are abundant. Fuel prices and inflation are not flat, but despite geopolitical and other storms fuel stocks and flows have been entirely sufficient. Affordable fuel costs and persistent demand keep trucks and truckers hauling. Tender rejection rates are below five percent in most markets.

Todd Davis at Freightwaves comments, “intermodal capacity appears to be more capable of handling current levels of demand and may keep the truckload market from experiencing significant tightening. A caveat: The bulk of hurricane season lands this time of year.”

So far Hurricanes Beryl, Debby, and Ernesto have claimed my sustained attention. Beryl was the earliest-forming CAT5 on record. All three caused significant flooding. Two of the three (Beryl and Ernesto) resulted in extended, wide-area US grid loss. Yesterday Accuweather forecast six to ten named Atlantic tropical storms for September.

Where there is extensive and extended grid loss, water, food, and fuel supply chains are disrupted. If storm damage and grid loss reduces cell coverage and/or other telecommunications, supply will be more difficult to calibrate with demand. If major public water systems or grocery distribution centers are taken down this will be shock to any regional ecosystem of supply. As previous posts have emphasized, in the United States there is substantive Supply Chain Resilience unless major capacity concentrations — nodes or channels or modes — are lost.

Water, food, and fuel capacity concentrations — and the channels by which each capacity flows — are where I focus. All of these capacity concentrations are important. But fuel is especially important. When the grid is gone, fuel for the emergency generators supporting water pumps and treatment facilities is how water flows persist. Trucks and truckers hauling food and bottled water can be creative and courageous finding alternative routes, but even the most tenacious trucker can’t make up for lack of fuel. So, inside every cone of uncertainty where are the refineries, pipelines, fuel storage facilities, and loading racks? Do they survive? Is the grid still connected — if not, how quickly can it be? What can be done to facilitate continuous flow of fuel to support continued flows of water and food and more?

Price Gouging or Reality Signaling?

On Tuesday, August 13, I was watching and working as soon-to-become Hurricane Ernesto approached Puerto Rico.  Early that morning I wrote to some colleagues, “DACO has announced a price freeze starting tonight (both my Adam Smith and Network Science predilections are always offended at this).” Puerto Rico’s Office of Consumer Affairs is not alone in such efforts. There are similar laws on the books of many states. The price gouging red flag is often waved just before and soon after natural disasters.

On Friday, August 16 at a campaign event in Raleigh, North Carolina, Vice President Harris said:

When I am elected president, I will make it a top priority to bring down costs and increase economic security for all Americans.  As president, I will take on the high costs that matter most to most Americans, like the cost of food.  We all know that prices went up during the pandemic when the supply chains shut down and failed, but our supply chains have now improved and prices are still too high. A loaf of bread costs 50 percent more today than it did before the pandemic.  Ground beef is up almost 50 percent.  Many of the big food companies are seeing their highest profits in two decades.  And while many grocery chains pass along these savings, others still aren’t.  Look, I know most businesses are creating jobs, contributing to our economy, and playing by the rules, but some are not, and that’s just not right, and we need to take action when that is the case.  As attorney general in California, I went after companies that illegally increased prices, including wholesalers that inflated the price of prescription medication and companies that conspired with competitors to keep prices of electronics high.  I won more than $1 billion for consumers.  So, believe me, as president, I will go after the bad actors.   And I will work to pass the first-ever federal ban on price gouging on food.  My plan will include new penalties for opportunistic companies that exploit crises and break the rules, and we will support smaller food businesses that are trying to play by the rules and get ahead.  We will help the food industry become more competitive, because I believe competition is the lifeblood of our economy.  More competition means lower prices for you and your families. 

Back in March the Federal Trade Commission released a staff report entitled, Feeding America in a Time of Crisis. At the time the FTC Chair explained, “As the pandemic illustrated, a major shock to the supply chain can have cascading effects on consumers, including the prices they pay for groceries. The FTC’s report examining U.S. grocery supply chains finds that dominant firms used this moment to come out ahead at the expense of their competitors and the communities they serve.” Please read the report, it is worth your time. It is clear that the Vice President’s campaign advisors at least scanned the report. I wonder if they talked with her economic advisors before giving price-gouging such a prominent place in the new presidential candidate’s first policy speech.

Tuesday morning — just four days on — one of those economic advisors was on Bloomberg Surveillance. Please see the video clip below. It is my sense that the campaign now recognizes this economic gesture (much less than a policy) was a confusing signal. Economists and others have been sent out to clarify the Vice President’s intention. The intention was to express empathy with making ends-meet, promise reduced food inflation, and place the blame on some grocery players. That third intention has back-fired, as blame-games often do. (More and more and more.)

Coming out ahead of competitors does motivate most US grocery operators. Profit margins are a key measure of business — and supply chain — effectiveness. The transition from pandemic to post-pandemic demand and supply has been complicated. For example, please consider the Federal Reserve chart below. The blue line reflects total Personal Consumption Expenditures on Food-At-Home. This includes inflation — and confirms why the Vice President and former President are each keen to express empathy and give practical attention to keeping food inflation at its now placid pace. The red line is “real” PCE for groceries, in other words adjusted for inflation.

In June 2024 US consumers expended about 12 percent more real dollars on groceries than in June 2018 and about 8 percent more than June 2019. This is a huge increase over such a short time. Even larger pandemic period increases — for example, June 2021 was 14 percent above June 2018 — could be explained by still tight constraints on the Food-Away-From-Home sector and other retail limitations. During the pandemic Food-at-Home was clearly “comfort food” not just calories. With restaurants and more now fully open for at least two years, why we continue to spend so much more on groceries than pre-pandemic is a mystery to me.

This significant — and strangely sustained — increase in demand has contributed to increased food prices. During the height of the pandemic costly changes were made across the entire grocery supply chain to fulfill very different — and volatile — demand patterns. As we began to move out of the pandemic everyone I know and follow in the grocery sector anticipated overall demand would return to something close to pre-pandemic patterns. But demand has stayed much higher.

No healthy, efficient firm keeps much more than five percent excess capacity on-hand — most CFOs would rather see three percent. The capital and labor costs to fulfill an additional eight or ten or twelve percent more consumption are significant. A prudent firm does not make that investment to fulfill a blip. One of many components of higher food prices since 2022 is upstream supply probing the elasticity of downstream demand. “Do you really want this?” “Will you still want this after we spend millions to deliver much more of this?” “How much do you want?” “What is your upper limit?” “What is our likely floor?”

Since the second half of 2021 these probes have confirmed a ceiling. Since the beginning of this year, we seem to have found the floor. Along the way upstream capacity has been added. Instead of probes for demand (and price) elasticity we are are now seeing price and variety competition. Accordingly, recent Consumer Price Index increases have softened. According to the USDA, channeling the Bureau of Labor Statistics, “The [June] food-at-home (grocery store or supermarket food purchases) CPI was unchanged from May 2024 to June 2024 and was 1.1 percent higher than June 2023.”

Reality can be tough to discern, especially in times of rapid change. Price volatility is insidious and destructive. But price is perhaps our best signal of the match or mismatch of supply with demand. Market economies use pricing trial and error over time to calibrate. It is often messy. There is absolutely a government role in preserving price competition, and this is tough and treacherous enough. But prices per se should be allowed to sing their arias or requiems. This is our best bet for hearing reality. To paraphrase and adapt Churchill, “The free market is the worst economic system except all those other systems that have been tried.”

+++

August 22 Update: The New York Times reports on the ambiguity — perhaps, ambivalence — of the price-gouging proposal. This morning on Bloomberg a pollster was interviewed who explained that attention to price-gouging and holding “bad actors” accountable polls very well with potential voters. It will be several hours before I can get that video or transcript. This pollster is not the only one saying so. At the Atlantic Josh Barro writes, “The vice president’s campaign promises make no sense to people acquainted with supply and demand—but they might win elections.”

August 23 Update: Price-gouging was not referenced in Ms. Harris’ acceptance speech, but according to the Wall Street Journal the issue is very much alive — and motivating — for many of those attending the Democratic National Convention.

August 28 Update: Robert Armstrong at the Financial Times has given two columns to this issue. On Tuesday he delivered a set of charts and related data to support this provisional conclusion, “The biggest retailers and suppliers in the grocery value chain took a lot of price increases after the pandemic. In some cases this led to expanding margins, but even in the cases where margins were roughly flat, profits often rose at a rate faster than the pre-pandemic trend and faster than the rate of general inflation.” This morning he gives us more data and a different angle of analysis on the full data collection and then concludes, “The primary driver of high profits… was not higher profit margins, but higher revenues at similar margins. In that sense, it is true that… food companies only “passed along” input cost increases.” (Ellipses extract reference to the example of one Consumer Packaged Goods company.)

Mr. Armstrong does not deal with the substantial and sustained increase in real — inflation adjusted — demand for groceries that I see reflected in the chart above. In responding to this PCE based analysis one of my readers wonders if what I present as consumers buying more volume might be the “statistical shadow of food inflation that is higher than average inflation.” That is a question absolutely worth asking. I have sent an email to the Bureau of Economic Analysis asking for their answer. Until then, in the BEA statistical notes I read, “Quantity and price indexes are calculated using a Fisher chained weighted formula that incorporates weights from two adjacent periods (months for monthly data, quarters for quarterly data and annuals for annual data)… Chained-dollar values are not additive because the relative weights for a given period differ from those of the reference year.” But I will confess that this is one of those instances where I seem to “hear” an answer but the tune changes as my ears are more or less able to muffle ambient sounds (signals or noise?).

Second-Half Flow Fitness

The second half of 2024 has opened with moderating pull and sustainable push for food, energy, and most aspects of crucial freight. The Red Sea (Suez Canal) pinch point continues to prompt higher prices and some Asia-Europe port congestion. But current — and prospective — flows are mostly well-calibrated with fundamental demand.

Food Flows

Once a month I try to track yield projections and anticipated prices for wheat, rice, corn, and beans as rough upstream indicators and compare this upstream capacity with close-to-actual downstream demand. My purpose is to discern the match or mis-match of upstream push to downstream pull.  The global market often reflects price functions (greed, fear, surprise, etc.) that I don’t follow close enough to have a well-informed judgment (many readers will have a much better sense of these factors). But if prices are stable or declining or slowly increasing, that is usually a dependable signal that supply is reasonably calibrated for most effectual demand. Based mostly on outcomes during the second half of June, the USDA’s World Agricultural Supply and Demand Estimates reports:

This month’s 2024/25 U.S. corn outlook is for larger supplies, greater domestic use and exports, and slightly lower ending stocks. Corn beginning stocks are lowered 145 million bushels, mostly reflecting a greater use forecast for 2023/24. Exports are raised 75 million bushels based on current outstanding sales and shipments to date. Feed and residual use is up 75 million bushels based on indicated disappearance in the June Grain Stocks report. Corn production for 2024/25 is forecast up 240 million bushels on greater planted and harvested area from the June Acreage report. The yield is unchanged at 181.0 bushels per acre. Total use is raised 100 million bushels with increases to both feed and residual use and exports based on larger supplies and lower expected prices. With use rising slightly more than supply, ending stocks are down 5 million bushels. The season-average farm price received by producers is lowered 10 cents to $4.30 per bushel.  

The same USDA report says, US “Soybean production is projected at 4.4 billion bushels, down 15 million on lower harvested area. Harvested area, forecast at 85.3 million acres in the June Acreage report, is down 0.3 million from last month. The soybean yield forecast is unchanged at 52.0 bushels per acre. With slightly lower beginning stocks, reduced production, and unchanged use, ending stocks for 2024/25 are projected at 435 million bushels, down 20 million from last month. The U.S. season-average soybean price for 2024/25 is forecast at $11.10 per bushel, down $0.10 from last month.”  Both wheat and rice yields — and overall supplies — are expected to increase slightly.

Recent global crop conditions are better than the last couple of years in most places. (Here’s a helpful map.)  La Nina’s return could impact the northern hemisphere’s harvest season. These El Nino to La Nina transitions have often reduced actual yields below forecast by five to ten percent (with related price increases). But I consider it too early to confidently project where, when, or how this climate transition might impact the second-half’s balance of food demand and supply.

Energy Flows

The Energy Information Administration reports:

U.S. power plant operators generated 6.9 million megawatthours (MWh) of electricity from natural gas on a daily basis in the Lower 48 states on July 9, 2024, probably the most in history and certainly since at least January 1, 2019, when we [EIA] began to collect hourly data about natural gas generation. The spike in natural gas-fired generation on July 9 was because of both high temperatures across most of the country and a steep drop in wind generation. According to the National Weather Service, most of the United States experienced temperatures well above average on July 9, 2024. Temperatures were particularly high on the West Coast and East Coast. Wind generation in the Lower 48 states totaled 0.3 million MWh on July 9, 2024, much lower than the 1.3 million MWh daily average in June 2024.

Despite this demand spike, US natural gas prices have remained comparatively low. Natural gas stocks in Europe are well above long-time seasonal averages. East Asian natural gas demand in 2024 has increased but unevenly and more modestly than many expected (more and more).

Crude oil prices have been remarkably calm (see chart below), especially given so many geopolitical uncertainties. Yesterday  CNBC reported, “U.S. crude fell more than 1% on Friday, posting a third weekly decline as worries about demand in China outweigh strong economic growth in the U.S. West Texas Intermediate oil fell 3.7% this week, while Brent dropped 1.8%. The U.S. economy grew at a 2.8% pace in the second quarter, much stronger than expected. But oil imports to China were down 10.7% year over year in June, and refined product imports fell 32% during the same period, according to customs data. China is the world’s largest crude importer.”  

Despite various efforts to reduce supply and increase oil prices, the global market for refined petroleum products has — for the moment — achieved a rough equilibrium that can supply energy at an affordable price for most needs.  The New York Times recently commented, “That the price and demand for oil have been so strong suggests that the shift to renewable energy and electric vehicles will take longer and be more bumpy than some climate activists and world leaders once hoped.”

In 2023 a bit more than one-fifth of electricity consumed in the United States was generated by renewablesElectric power consumption is growing fast in many places.  The US proportion delivered by renewables is steadily growing, though fast-enough remains an open question.  About half of the European Union’s grid output depends on renewables.  Global deployment of renewables — outside China — is proceeding at a pace that some consider inadequate to avoid even more extreme climate consequences.

Freight Flows

Earlier this year constrained capacity at the Panama and Suez canals caused delays, congestion, and increased costs worldwide.  Better rains have since increased throughput at Panama.  Houthi attacks continue to slash Suez sailings.  But maritime flows have successfully shifted to other routes.  This shift has reduced — and complicated — velocity with a predictable months-long impact on volumes (and prices).  But in the last couple of weeks spot market prices indicate the higher pressure flows are beginning to even-out.  On July 26 Loadstar reported, “Drewry’s World Container Index (WCI) Shanghai-Los Angeles declined 5% week on week, to yesterday’s level of $6,934 per 40ft, while Xeneta’s transpacific XSI saw a 6% drop, to $7,322 per 40ft, and the Freightos FBX dropped 4%, to $7,738 per 40ft. Meanwhile, pricing on the Asia-North Europe route was either flat or saw slight declines: the WCI and XSI were flat, at $8,260 and $8,474 per 40ft respectively; while the FBX dropped 2% week on week, to finish at $8,420 per 40ft.”

US freight flows reflect sustained — if moderated — consumer demand.   The frontloading of holiday imports is requiring more trucking capacity than can often be the case later in the summer. Traditional rail and truck shipment metrics continue what seems to be a slow, systemic decline.  But Todd Davis at FreightWaves comments, “June was possibly the best month for freight in nearly two years from a service provider perspective. Tender volumes hit their highest monthly values since August 2022, and rejection rates breached 6% for the first time since the same month. While neither of these values broke any records, both are signs of a healthier freight market.” 

For the last two years, by late July  Mississippi River levels have gotten iffy for barge movements.  But  this year — so far — river levels (here) are one-third higher or better along much of the Lower Mississippi.  

As of the end of June the New York Fed’s Global Supply Chain Pressure Index was about as close to its historic average as it gets.

Push Reflects Pull

Global flows are huge, but without much pent-up demand.  China’s economy is growing, but not as fast as pre-pandemic.  Japan’s GDP prospects are for no-growth or worse.  The Eurozone’s economy has improved, but is not expected to grow much better than Japan’s (more).  Among the biggest economies, only the US has recently shown the ability to surprise to the upside.  Real (inflation adjusted) US Personal Consumption Expenditures (see second chart below) are mostly maintaining their post-pandemic levels — with modest rates of growth.

+++

July 28 Update: About 12 hours after I posted the above, the Financial Times published a lead story headlined, “US consumers show signs of flagging.” The second and third sentences read, “This week’s shaky start to the corporate earnings season has fuelled concerns that consumer strength has peaked, despite data on Thursday showing stronger than expected GDP growth in the second quarter, thanks in part to consumption spending. Kathy Bostjancic, chief economist at Nationwide Mutual, said she expected “consumers to rein in their spending as we head through the second half of this year” because “pandemic savings [are] depleted, lower income households increasingly maxed-out on credit and . . . employment growth will continue to cool”.

Cooling, slowing, walking not running are all consistent with what I also perceive for US demand pull. This means less pressure on supply chain volumes and velocity, more opportunity to invest in resilience, efficiency, and serving what is still very strong demand.

Last week McKinsey reported, “The decline in postpandemic logistics funding continues. After reaching an unprecedented $25.6 billion in 2021, venture funding for logistics start-ups fell to just $2.9 billion in 2023—a two-year plunge of nearly 90 percent, and the lowest level of funding since 2015.”

The consultancy offers several credible explanations for the decline. I will offer another: between 2020 and 2021 VC funding for logistics doubled from about $13 billion to almost $26 billion. Many of those investments have not paid off. Many of those investments were poorly conceived. Too many of those investments were misspent in the maelstrom of pandemic volatility. Manic demand was often prompting schizoid supply. Investors are pausing to assess lessons-learned.

There is absolutely the need (and opportunity) for VC and other supply chain investments that anticipate increased uncertainty, consumer volatility, technological change, persistent stress, and recurring systemic shocks. Today’s flows of pull and push are a much more promising context for conceiving, refining, and scaling innovations with a sustainable Return-On-Investment than the fast floods and deep droughts of 2021 to 2022.

Healthy demand in June

Sustained, strong demand is, I perceive, the best guarantor of resilient supply chains. High volume, high velocity contemporary supply chains demonstrate rather amazing creativity and adaptability when pull signals keep singing. (The reverse can also be true, when pull is muted, push is demoralized and distracted.)

As such the monthly retail sales and personal consumption expenditure reports are among our best indicators of overall supply chain fitness. Below is a helpful chart condensing this morning’s retail sales report for June.

The Census Bureau delivers these details, “Advance estimates of U.S. retail and food services sales for June 2024, adjusted for seasonal variation and holiday and trading-day differences, but not for price changes, were $704.3 billion, virtually unchanged (±0.5 percent) from the previous month, but up 2.3 percent (±0.5 percent) above June 2023. Total sales for the April 2024 through June 2024 period were up 2.5 percent (±0.5 percent) from the same period a year ago. The April 2024 to May 2024 percent change was revised from up 0.1 percent (±0.4 percent)* to up 0.3 percent (±0.2 percent). ” (More and more.)

Category-specific outcomes were mostly better than the overall. Used car sales took a huge hit in June because of the cyberattack on back office systems serving that sector. Excluding disrupted auto sales and lower priced gasoline, total retail sales increased 8 percent month-over-month. Despite the surprisingly strong increase, both wholesale and retail inventories increased slightly. This is not a stress test, this a healthy habit of day-after-day exercise.

The second chart below — showing sales at grocery stores and eating-out places — suggests to me a consumer population that since last November has found a balance of careful shopping and occasional fun that reasonably reflects recent wage trajectories.

Carrots, sticks, or conversation?

What are the structural — systemic — vulnerabilities of contemporary supply chains? There are many. Which deserve the most attention? Odd Lots, the Bloomberg podcast, recently interviewed Joseph Stiglitz, the Nobel Prize winning economist, on this theme. Following are some excerpts:

…firms don’t think about the consequences of underinvesting in capacity for others. They may take the price distributions as given, but their independent actions actually change the price distributions. And they change them in ways that, basically they’re free riding on others. But when they all are free riding on others — on the fact that somebody will have built that capacity — there’s a problem of under capacity. So that in a nutshell is the argument that if each firm says ‘Well, if I need it, I can always get it from somebody else,’ and they all go around doing that, in the end, there won’t be enough capacity. Capacity is like a public good that we all benefit from, and there’s a general proposition in economics that there will be under-investments in public goods.

… what is rational for the individual or firm maximizing its profits is not efficient for society. There’s another aspect of that that I should emphasize, that markets are often excessively short term. So [when] you say they’re maximizing their profits, they’re not really maximizing long-term profits. A lot of that just-in-time was maximizing short-term profits and then when you can’t produce, you lose a lot of profits and they didn’t take that fully into account...

[We need] to encourage firms to take more long-term decisions and rewarding more long-term behavior. Taxes affect that. The fact that, if you get more favorable treatment on capital gains, if it’s held long-term, can encourage people to hold onto investments and that will encourage more long-term thinking as opposed to the short-term thinking being so dominant and so much of the market economy...

Now there are further questions you then need to ask. Some of these [capacity concentrations] you don’t have to worry about, they’re pretty steady, but some of them are more vulnerable. So you would not only look at what I first talked about sort of as centrality — how important are they to the functioning of the economic system — but you have to also then look to some notion of vulnerability. The nature of the shocks they face, the reliability of those particular places.

My summary: As any system’s core capacities are more concentrated, the resilience of flows can incrementally wane. As network diversity declines and markets become more centralized, risks increase. For the last thirty-plus years there has been an increasing focus on near-term cost-containment, price competition, and profitability that has discounted the risks of lost capacity redounding from over-concentration. Just-In-Time is not going away. But stupid-short-termism will eventually be punished by being unable to deliver (or being compensated) until waay too late.

Joseph Stiglitz does not need my affirmation, but I agree. The podcast includes a related conversation about government carrots and sticks to nudge longer-term, more resilient behavior. Stiglitz does not begrudge most carrots, but would prefer more robust pointed sticks.

I wish Elinor Ostrom, another Nobel Prize winning economist, was still alive. I would love to hear Ostrom and Stiglitz have a conversation about how to facilitate more private investment to produce public goods. I consider high volume, high velocity contemporary supply chains to be mostly consistent with Ostrom’s definition of a “Common Pool Resource” (CPR). If so, extensive CPR field studies have demonstrated that enhanced resilience is less about carrots or sticks and much more about facilitating meaningful conversations and self-interested self-management among the critical players. (Here and here.)

Accelerating Freight Flows

Contemporary supply chain management works to minimize costs of excess capacity and inventory. The goal is to accurately anticipate demand so that supply is pushed Just-In-Time to precisely where consumer pull is present.

Because it is less costly to make and buy in bulk and precise prediction is not always possible, there is usually some upstream buffer stock. Mid-stream capacity is purposefully tight. Trucks and drivers are expensive, what you’ve got you want to fully utilize. Each firm’s last mile freight capacity is shaped to deliver to highly probable demand at full-flow velocity. Downstream stocks are intended to be just enough to supply each customer’s demand between deliveries.

Dollar General is currently — perhaps perpetually — in the process of supply chain streamlining. During a May earnings call CEO Todd Vasos said, “… our supply chain teams are primarily focused on ensuring deliveries are on time and in full and we are reducing the amount of inventory we carry… Our top priority in this area continues to be improving our rates of on-time and in-full truck deliveries, which we refer to as OTIF. Our distribution and transportation teams have taken aggressive action to improve their service to our stores, and these efforts have led to significantly higher OTIF levels compared to the same time last year.” In the same call the CFO emphasized, “Notably, total nonconsumable inventory decreased 19.1% compared to last year and decreased 22.5% on a per store basis. The team continues to do great work reducing our overall inventory…” (More and more.)

Depending on products, customer preferences, and investment resources (including human judgment), other firms will emphasize slightly different priorities, but delivering optimal flows at minimum cost is a nearly ubiquitous objective. The result is less waste, reduced costs, and more sustainable margins. This structural efficiency can, however, reduce options when demand suddenly shifts. The more volatile consumer pull, the less effective related push (for example 2020-2021).

In advance of a hurricane or blizzard or such, demand will surge. Grocers and fuel operators in particular have experience and protocols to increase supply into the face of anticipated demand. More deliveries are scheduled and, for grocery, the product mix can dramatically shift. The goal is to serve both pre-event and post-event needs. There is, however, seldom time or opportunity to engage many more trucks or drivers. The focus has to be on moving more with what is already on hand. To achieve this waivers of freight regulations can be very helpful, especially in advance. When a hurricane or blizzard is forecast, the supply chain “disaster” usually starts about 72 hours before the actual winds pick up. Allowing trucks to carry slightly more than usual and truckers to stay-on-the job slightly longer than usual will improve velocity and, therefore, volumes available.

Texas authorized Hours-Of-Service and weight waivers almost 48 hours before Hurricane Beryl’s Monday landfall.  But for some reason these waivers were NOT widely communicated. Suppliers sent me notes describing the public sector communications process as “terrible”, “convoluted”, and “pathetic”. The frustrated reaction was, in part, anchored in disappointment. It is much easier to get intra-state waivers in a hurricane-ready state than federal-plus-multiple-state waivers from less experienced players. Freight carriers expect the feds and various southbound states to be passive and/or confused before a Florida landfall. Texas is very experienced with hurricanes. Texas is big enough that their single set of intra-state waivers will usually maximize flows across the entire Texas Triangle (Austin, Dallas, Houston, in-between, and near-by). Texas usually deploys and communicates much better than average. But not in advance of Beryl.

I’m sure this will be part of the Texas after-action for Beryl. Even more important in my judgment: If Beryl had been forecast at CAT3 or above, could freight waivers have been released — and effectively communicated — before Saturday, even as early as Thursday morning? What about when similar waivers are needed for North Carolina, South Carolina, Georgia, Alabama, Mississippi, Louisiana, and Tennessee to increase volumes and velocities when a major hurricane is forecast for south Florida? Or a major Northeast Blizzard? Or other rapidly emerging threats?

Houston’s very hot wash

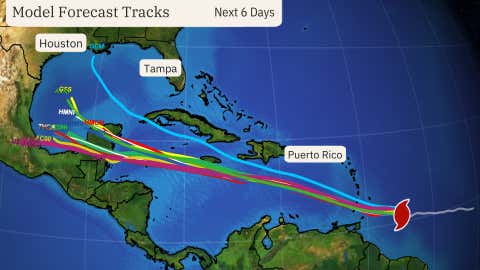
Hurricane Beryl reached Category 5 much earlier in the Atlantic hurricane season than any other system on record. On July 1, as a CAT4, it devastated Carriacou. Jamaica’s south shore received a harsh passing swipe. On July 5 Beryl made landfall at Tulum as a high-end CAT2, continued across the Yucatan, then entered the Gulf of Mexico as a tropical storm. It was a strengthening CAT1 hurricane as it came ashore at Matagorda, Texas on July 8 (more and more).

Before dawn, eastern time, on Saturday, July 6, I sent the following note to clients, colleagues, and friends:

This morning our cone of uncertainty extends from the mouth of the Rio Grande to Houston. Until we are more certain of how much force on which specific targets — we can ask ourselves questions, preparing our minds (and more) for a range of potential answers.

There will be lots of rain where there has recently already been lots of rain, so there will be flooding. Bad enough to bring down bridges and stop trucks?  Bad enough to swamp water treatment facilities? Are major grocery distribution centers and such at risk?  Here’s one place to watch and to find other places to watch.

There will be storm surge.  Bad enough to disrupt LNG infrastructure? (Here and here and here) How about other energy nodes and channels (here and here)? Here are a couple of places to watch: Enbridge Corpus Christi and Aransas Pass.

Starting Sunday night there will be tropical force winds. We can be almost certain of disrupted local electrical distribution networks.  Transmission networks?  Generation facilities? Will the grid-free zone be sufficiently narrow to support continued inbound trucking?  If the grid is gone for several days for tens-of-thousands, the ten day forecast looks dangerously hot with even nighttime temperatures at 80 or above. 

Right now the forecast does not support my worst-case worries. Right now it looks like the storm will avoid the largest concentration of migrants without shelter.  Right now grocery DCs are likely to survive, the roads serving most places will be fine, and refueling should be possible.  But we also know that late stage intensification is a growing problem.  So, I am mostly scanning for capacity concentrations while waiting for both force and targets to be clarified. 

I was recently reminded that reconnaissance is meant to help us “recognize” — rethink — reality.  Beryl may yet cause me to recalculate what I think I know: adapt, adapt, adapt… 

One week later how does that rough two-days-ahead risk assessment (Threat x or / Vulnerability) hold up?

Late yesterday S&P Global reported, “Almost 1 million electric customers remained offline in East Texas July 12, five days after Hurricane Beryl barreled into the Gulf Coast, and about 500,000 customers may remain in the dark July 15 amid a continuing National Weather Service heat advisory.” In the three days after Beryl’s passing daytime temperatures in Houston were above 90 Fahrenheit with dewpoints over 70. All HEB stores and most other grocery retailers were open on Tuesday. Public water disruptions have been minimal. Retail fuel has continued to flow. The big Marathon and Valero refineries are operating. Fuel racks are dispensing product. Fuel tanker trucks are delivering. The port of Houston has reopened. While the electrical distribution system was left in tatters, the transmission network and generating capacity remains intact. In fact, ERCOT has had surplus capacity because demand was suppressed by lost connections.

On Tuesday there was the typical demand surge for gasoline that drained several retailers. Many stations without back-up power were closed. Much of Wednesday and Thursday was spent refueling sold-out retailers. There are still several gas stations without power to pump. But there are even more that are open for business (more and more) I have not (yet) found a major truck stop that is closed. Yesterday (Friday) the Freeport LNG terminal had not returned to full operations, but there were widespread expectations that it would restart late yesterday or this weekend. Early estimates of insured losses in Texas are running above $2.5 billion (more).

There have been many supply chain challenges. Anytime the grid is gone there will be serious challenges. When the grid is gone for an extended period is exactly when Supply Chain Resilience is tested. In my judgment, the metro-Houston supply chain has passed this (early-in-the-semester) test. This does not diminish continuing human (and economic) consequences of flooding, wind damage, storm surge, and grid failure. But in the aftermath of a hard hit, water, food, fuel, and other crucial freight has continued to flow at velocity and volumes sufficient to supply millions. The grid-loss has been very tough, but consider how bad it would be if amplified by the absence of public water and commercial grocery and fuel operations.

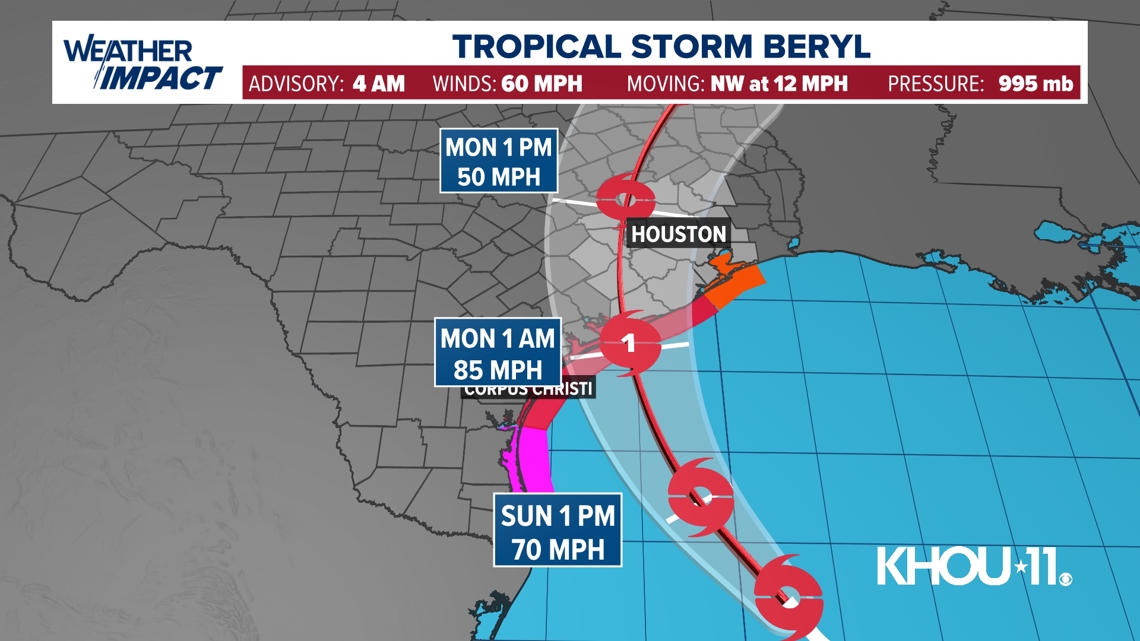
In retrospect there were two errors in judgment — implicit but influential — in my July 6 risk assessment. I failed to consider the increased grid vulnerability resulting from mid-May’s derecho in the Houston area (more and more). This almost certainly pre-set ground and tree conditions that explain some portion of Beryl’s impact. Tree roots that were weakened in May gave way. Repairs not quite completed since May were even more vulnerable to the hurricane.  Recurrence is a key principle of risk assessments. I did not give this principle enough attention. My expectations for a slightly more westerly track by Beryl — not quite as Houston-specific — did not fully adapt to updated weather forecasts. As the map below suggests, by Sunday morning a bulls-eye on the urban matrix was reasonably certain. But my attention was distracted by my own expectations and lack of concentration (on Sunday I was engaged in many non-Beryl personal activities). Combined with neglecting derecho impacts, this distraction resulted in a level of grid loss that surprised me, despite plenty of evidence that could have generated more accurate anticipation. In this particular case, improved anticipation would not have resulted in different actions. But in other contexts, accurate anticipation can be the best action advantage available.

No new storm in the Atlantic this morning. Beryl was a helpful prompt to pay closer attention next time.

+++

July 16 Update: As of late Monday afternoon, roughly 200,000 Houston area electric customers remained off-the-grid. Inbound deliveries of feedgas to the Freeport LNG facility resumed over the weekend. But outbound train-flow is not yet moving. A Freeport LNG spokesman said they are repairing, “damage sustained to our fin fan air coolers in the hurricane and anticipate restarting the first train this week.” S&P Global explains, “Fin fan air coolers are used to dissipate heat at liquefaction plants. They need ample air supply to operate, so they are often more exposed to weather events than other pieces of equipment.” US natural gas prices have dipped a bit on the loss of Freeport’s demand. The Dutch TTF benchmark was lower on Monday and today, Tuesday, has opened trading in a narrow range. Europe’s natural gas storage domes are already just about full for winter (here). July 17 related piece by Bloomberg, “Gas futures for next-month delivery sank 7% to settle at $2.035 per million British thermal units on Wednesday. October futures slid 5.3%, while the January contract dropped 2.3%. The outage at the Freeport liquefied natural gas terminal has dented consumption and US data continues to show larger-than-expected weekly additions to “already bloated inventories…”

July 20 Update: According to the Houston Chronicle, “The Texas Windstorm Insurance Association (TWIA) said in a meeting this week that it anticipates draining half of its catastrophe reserve funds to cover windstorm damage payouts. The TWIA is an insurer of last resort for many Texans, giving policies only for wind and hail damage to customers who have been denied coverage in the public market. Chief Actuary Jim Murphy said that the agency expects to use about half of its over $450 million catastrophe fund to pay for the 16,000 claims it has already received. That figure could go up to 20,000 claims for an estimated more than $200 million in payouts. ” According to Reuters, Freeport LNG is receiving inbound feedgas, but as of Friday had not yet begun loading at least six LNG tankers anchored nearby.

July 26 Update: S&P Global reports on CenterPoint’s plans to do better next time. Freeport LNG outbound flows restarted on July 22. Estimates of US insured losses now seem to be settling into a range of $2.5 billion to $4.5 billion, with another $2 billion or so related to insured damages caused before the Texas landfall. Since shortly after Beryl’s transit near record Sahara dust storms have suppressed formation of new Atlantic hurricanes. This effect is not atypical for late July and usually dissipates by mid-August.