Month: April 2024

Amalthea again

On Saturday shipments from Cyprus to Gaza resumed. According to CNN, “The ship, called “Jennifer,” departed Larnaca Port in Cyprus at 9 a.m. local (2 a.m. ET) and will take around 25 to 30 hours to arrive at Israel’s Ashdod port, according to ANERA’s (American Near East Refugee Aid) emergency response team lead in the West Bank, Mohenad Itayam. Itayam told CNN the 400 tons of aid would undergo Israeli security clearance upon arrival. From there, it will be loaded onto trucks that will then go south to the Kerem Shalom border crossing before entering Gaza.” (More)

The Amalthea maritime corridor was originally conceived as opening a new gateway directly into hardest hit Northern Gaza. This opportunity was being piloted by World Central Kitchen and others when IDF action on April 1 killed seven WCF staff (here). There have been no further maritime deliveries from Cyprus until this last weekend. Please notice that while goods are transferred to trucks at Ashdod, north of Gaza, the trucks are then squeezed through the Kerem Shalom border crossing adjacent to southern Gaza.

World Central Kitchen has announced it will resume operations in Gaza, including possible use of the maritime channel from Cyprus. “We have been forced to make a decision: stop feeding altogether during one of the worst hunger crises ever, ending our operation that accounted for 62% of all International NGO aid, or keep feeding knowing that aid, aid workers, and civilians are being intimidated and killed. These are the hardest conversations and we have considered all perspectives when deliberating. Ultimately, we decided that we must keep feeding, continuing our mission of showing up to provide food to people during the toughest of times.”

The US Department of Defense has announced that near-shore construction has begun of the the floating pier and causeway off Gaza that is expected to receive flows from Cyprus (and elsewhere). According to CNN, “A senior military official said last week the US is “on track to begin delivery of humanitarian assistance to Gaza from the sea in early May,” which will begin at the equivalent of 90 trucks per day of aid and then “quickly scale up” to 150 trucks per day once full operational capacity is reached.” (More and more.)

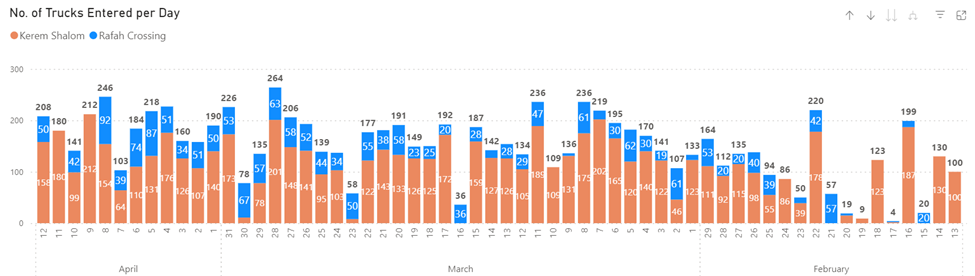
More aid is arriving in Gaza, see chart below. This is much better than the deep drought experienced most of February. But inbound deliveries remain well-below the average of 500 trucks per day received prior to October 7 — and even then, sixty percent of Gazans were “food insecure” (here and here). From a supply chain point-of-view, there is no flow. There are sporadic spurts, some shallow pooling, even a few sudden sprays, but mostly it is only a trickle compared to what is desperately needed. The New York Times has a helpful operational overview of how inbound to the DOD floating pier will be discharged into Gaza. Rather than intermodal efficiency, it is a collection of multi-modal hurdles unfolding into a last mile shooting war.

+++

May 6 Update: Rocket and mortar fire near the Kerem Shalom crossing has disrupted deliveries into Gaza. Rough seas have complicated completion of the of the near-shore pier to serve Gaza. This morning Reuters is reporting, “Israel’s military said on Monday it had begun encouraging residents of Rafah to evacuate the southern Gazan city as part of a ‘limited scope’ operation, but did not immediately confirm media reports this was part of preparation for a ground assault.”

May 8 Update: Several reports suggest the Kerem Shalom crossing has reopened today (here and here). The Rafah gateway is the site of ongoing military operations (here and here).

The Financial Times reports, “The flow of crucial food and medicine into the Gaza Strip — already severely constricted by eight months of war — has slowed to a trickle after Israeli troops moved into Rafah this week and halted traffic at two major border crossings. The UN has only 15,000 litres of fuel left for generators — including those in hospitals — and vehicles in southern Gaza, less than 10 per cent of daily demand, said Scott Anderson, senior deputy director at the UNRWA, the UN agency for Palestinians in Gaza. After nearly three days of disrupted humanitarian aid convoys, warehouses will run out of flour and ready-to-eat meals within days, he said.” (More and more and more.)

“Construction of the floating pier and causeway has now been “completed”, according to the Department of Defense. Near-shore and on-shore anchoring is dependent on weather conditions which are forecast to improve through Saturday (here and here).

May 11 Update: The original post above was published on April 30. April was the best month for inbound volumes to Gaza since October. May will almost certainly be the worst. The IDF (COGAT) reports some continued deliveries. The United Nations reports that the last truck entered Gaza on May 5 (more). This morning, the Independent (UK) reports, “… the United Nations warned that food supplies in the southern Gaza region where Israel intends to conduct another ground attack “will run out tomorrow”. The shortages have been caused by Israel’s closure of two crossings in the south through which humanitarian aid was being moved into Gaza. They are currently being blocked by Israeli forces ahead of a ground offensive in Rafah.” According to Reuters and several others, “the military is pressing ahead with its plans for a ground attack on Rafah… Israel has said it will proceed with an incursion into Rafah, where more than 1 million displaced people have sought refuge during the seven-month-old war.” (More and more.)

The Merchant Vessel Sagamore has departed Cyprus for northern Gaza near where floating piers have been constructed (more). According to the US Department of Defense, “One floating pier will be deployed several miles offshore outside Gaza, while the other, called the Trident pier, or “causeway,” will be pushed onto and attached to the Gazan shore. Together they will be used to move humanitarian aid into Gaza.  Both of the floating piers, along with the MV Roy P. Benavidez — a large, medium-speed, roll-on, roll-off ship — are off the coast of Israel near the Port of Ashdod, about 18 miles north of Gaza. Unfavorable sea conditions prevent movement of the piers to their final location. In the meantime, the MV Sagamore — a commercial cargo ship — has been loaded with humanitarian aid in Cyprus and has made its way to Ashdod. Instead of waiting for the piers to be deployed, humanitarian aid on the Sagamore will be moved to the Benavidez so that the Sagamore can go back to Cyprus to get more aid supplies.” I have received conflicting reports on the off-loading of the Sagamore and sea conditions off Gaza.

May 13 Update: The New York Times is reporting, “Six trucks of flour arrived through the Kerem Shalom crossing on Saturday, and on Friday, some fuel also came through the same crossing point, according to Juliette Touma, the communications director for the main U.N. agency that aids Palestinians, UNRWA. She said that no other supplies arrived through Kerem Shalom this past week and that the Rafah crossing remained closed… COGAT said on Sunday that it had opened a new “Western Erez” crossing to allow for more aid to northern Gaza, and that it had coordinated “dozens” of World Food Program trucks carrying flour from the Israeli port of Ashdod. But COGAT did not say whether the flour trucks had entered northern Gaza…” Maritime conditions are available here and here.

May 14 Update: There are now several independent confirmations that more than 400,000 residents of Gaza have relocated since May 6. (here and here). Haaretz reports, “After nearly 100 Israelis blocked and damaged an aid convoy en route to Gaza on Monday, two trucks from the convoy were set ablaze Monday evening in the West Bank. The Israel Police and IDF traded accusations of blame regarding whose responsibility it was to guard the convoy.” (More and more.)

May 16 Update: US Central Command reports that its personnel have, “anchored a temporary pier to the beach in Gaza. As part of this effort, no U.S. troops entered Gaza. Trucks carrying humanitarian assistance are expected to begin moving ashore in the coming days. The United Nations will receive the aid and coordinate its distribution into Gaza.” (More and more.) The BBC reports that, “nearly 100 tonnes of UK aid, consisting of 8,400 “shelter coverage kits” (temporary shelters make up of plastic sheeting) left Cyprus on Wednesday, bound for the temporary pier.” Reuters reports, “a third party will collect the aid from the pier, drive it a short distance and then offload it for U.N. collection. The U.N. official said another third party – contracted by the U.N. – will load the aid on to trucks and take it to distribution points across Gaza.” (In late April the NYT provided a helpful overview of the various hand-offs here.) The United Nations is reporting that over the last week at least 600,000 residents of Rafah have self-evacuated to previously unpopulated areas along the Mediterranean. Supporting these ongoing shifts amplifies the most basic logistical challenges.

May 17 Update: The floating pier and causeway are now in place in mid-Gaza (see photo below and here and here and here). The initial discharge into Gaza via this route involved about a dozen trucks and 300 pallets of goods donated by the United Kingdom (here). According to IDF sources, some land routes saw renewed deliveries this week, including 97 trucks so far today (Sunday) and 84 trucks on Friday (more). Until Friday fewer than forty trucks had been received since May 5. The number of newly displaced persons inside Gaza is now estimated at 800,000.

May 21 Update: The US Department of Defense, Central Command indicates that over 569 tons of goods have now been discharged into Gaza (here and here). It is also reported, “but not all the aid has reached warehouses.” There are troublesome reasons for the diversion of aid from the warehouses. It is also true that delivery to warehouses is not the mission. The mission is to feed hungry people. Linear concepts and methods such as warehouses and well-organized feeding centers are needed — and will be insufficient. Many more creative, non-linear, channels and techniques are needed to advance this difficult, treacherous, and urgent mission. (Additional links on this mission-gap: here and here and here and here.)

Soldiers putting in place the pier

May 27 Update: There are reports, rumors, and plenty of recriminations related to what is happening — and not happening — with water, food, and fuel deliveries into Gaza. Here is a New York Times overview that is coherent with what I am otherwise being told. Here is a related, but more narrowly framed report by Deutsche Welle, but I am told this progress has now been overcome by events. (More and more and more.)

Demand marches ahead

Personal Consumption Expenditures for March were a bit higher than expected. It is just a blip, but a boisterous blip. This PCE print signals a continued pattern of rather robust demand, including a significant monthly increase in demand for goods (compared to services). The March economy absolutely had spring in its step. See the first chart below for real — inflation adjusted — consumption of food-at-home.

Reinforcing the PCE indicator is first quarter GDP results for real “final sales”, please see the second chart below. The US consumer is buying. Goods (and services) are being delivered to sell.

Following are several insights cherry-picked from a much more expansive report from FreightWaves.

  • Despite a seasonal dip during the Easter holiday period, freight demand remained consistent in March, outperforming 2023 levels by an average of about 9.5%, reflecting significant growth.
  • National tender rejection rates hovered around 3.5% for most of March, slightly higher than the previous year by approximately 70 bps, with reefer rejection rates being the main reason for the increase.
  • Contract rates, while still falling slowly, have decelerated significantly over the past seven months, suggesting a potential upward trend by the end of the year. Carrier active operating authorities continued to contract in March, although at a slower pace, indicating a potential turnaround in the market in the near future.
  • Easier year-over-year comparisons and a strong economic foundation have guided double-digit import TEU growth in Q1 of 2024, with bookings and daily TEUs returning from the Lunar New Year holding 10%-12% above 2023 levels.
  • Overall U.S. containerized intermodal volume remains significantly higher than the previous year, driven primarily by the international segment, indicating strong import volume and the availability of oceangoing containers in the global marketplace.

What I perceive is a US freight network that still has “excess capacity”, but given persistent demand, carriers are being persistent too… so supply is delivered at what might even be considered deflationary rates.

Upstream flows for the Grid

Below is yesterday’s (April 22, 2024) full-day fuel mix for the Texas grid. Proportions change seasonally and (obviously) by the time of day. But the major contributors remain the same: solar, wind, natural gas, coal/lignite, and nuclear. Other sources are very marginal, but can be vital when the grid is teetering on the edge. The proportions at play in Texas ought not be generalized. For example, in Washington State hydropower delivers almost 65 percent of electricity generation.

Let’s try to quickly trace some individual links in the Texas grid supply chain. Wires and transformers are early steps upstream from electricity consumption. We all know about wires (at least in general). Transformers are less well known. PV magazine explains, “Transformers are a necessary piece of the energy puzzle, as they manage the flow of electricity along the power grid by changing high-voltage electricity from transmission lines into low-voltage electricity before it reaches consumers.” There is currently a “shortage” of both electrical cables and transformers.

The scare quotes are meant to suggest that while there are current supply-side constraints (here and here), this is less a matter of reduced supply and much more a matter of increasing demand. A recent study by the National Renewable Energy Laboratory (NREL) found that demand is surging because of “aging infrastructure, electrification and massive growth in electricity demand, increased failure due to extreme weather events, and proactive utility resilience replacement programs. NREL preliminary analysis estimates current stock of between 60-80 million distribution transformers with upwards of 3 TW of installed capacity, and estimates the growth in overall stock capacity by 2050 will see up to a 160%–260% increase on 2021 levels.” (More and more and more.)

If we follow the different-capacity wires and transformers further upstream, we are not surprised to find more than 160 natural gas power stations operating in Texas. Texas produces more natural gas than any other state and about a quarter of national output (here). Texans also consume the most natural gas. Roughly 40 percent of electricity consumed in Texas depends on natural gas. Both Texas and the Unites States have very robust proven reserves of natural gas. But during 2021’s Winter Storm Uri natural gas connections froze. The very abundance of natural gas can also contribute to price swings that undermine consistent investment in exploration, drilling, and maintenance. Even with production cuts, recent price action has discouraged producers (more and more). This sort of volatility can narrow resilience investments at every step in the natural gas system.

About sunrise yesterday the wind picked up across Texas and so did the contribution of wind power to the grid (see blue line below). With more than 15,000 wind turbines this sector typically contributes about a quarter of total electricity generation in the state (here). But typically the wind does not blow as much in summer as winter (especially under El Nino effects). This can be a problem when Texas gets very hot (here). And sometimes even winter winds can slow. Lagging transmission network upgrades are also a constraint (here and here). Lack of skilled labor and some parts problems have complicated build-outs (see transformer note above and more and more). China is home for about sixty percent of global wind power parts and supplies. There is some sense that China gets what it can use before selling what’s left to non-domestic customers (here).

Last month Texas surpassed California as the state with the most grid-scale solar capacity. In recent years, about six percent of overall electricity consumed in Texas has originated with solar power. This is growing quickly, just as Texan’s demand for electricity is growing quickly. On some days, solar can be the source for over one-third of Texas grid output. Supply chain resilience for solar is complicated by the turning of the planet, clouds, and lack of storage capacity. But Texas is investing more in grid-related batteries than any other state (here and here). On August 24 last year I watched while a modest blip of “stored power” reinforced a highly stressed Texas grid just as the sun was setting and demand was peaking (more). Given the chart below, “power storage” is now a much more regular contributor to grid management (more and more).

Batteries, solar panels (and related), and wind turbines (and related) all have complicated, long-distance supply chains facing high demand and technological innovation (more and more and more and more). Each of these separate sectors also share a dependence on at least seventeen rare earths. Supply chain resilience is challenged by the innate rarity of these components — and, potentially, by the over-concentration of global capacity for rare earth production in China (roughly 70 percent).

Given supply chain complexities we could clearly go deeper and wider than above. A full forensic assessment of these supply chains could be an evergreen, never-ending task. But just what is outlined above is evidence of an innovative sector that is growing quickly in an ambitious effort to fulfill fast-growing demand. What this also — almost ipso facto — means is that the risk of grid failure is structural, systemic, and likely to be stubborn for the next several years (more).

April 27 Update: Yesterday afternoon “ERCOT issued an AAN (Advance Action Notice) due to a possible future Emergency Condition of reserve capacity deficiency beginning Monday April 29, 2024, HE 2000 through Wednesday May 1, 2024, HE 2100. ERCOT may Delay/Withdraw Approved or Accepted Resource Outages. ERCOT may seek up to 2,832 MW from an OAE (Outage Adjustment Evaluation) and then make the OSA (Outage Schedule Adjustment). On Saturday April 27, 2024, at 14:30 ERCOT will execute an OAE if deemed necessary.” Bloomberg explains, “Grid conditions can be tight this time of the year because early heat can increase demand while supplies are hampered by scheduled maintenance in preparation for the summer air-conditioning season. The evening hours are especially vulnerable to shortages as solar power goes offline and other supply has to ramp up.”

April 30 Update: Hot temperatures in Texas increased power demand even more than originally forecast, first chart below. With wimpy winds, natural gas draws surged — and prices did too. See April 29 fuel mix chart below. Matching supply and demand will continue to be challenging.

April 29 Demand on ERCOT Grid

April 29 Fuel Mix on ERCOT Grid

+++

May 6 Update: The Financial Times has published a “Big Read” on how to pay for the green transition. One of several potential angles reported, “Over the next seven years, capital expenditure on renewables will roughly double while fossil fuel capex will halve, according to research from RMI published earlier this year. Falling fossil fuel capex will therefore provide around half of the growth in renewable capex, it concluded.”

Grid Reliability and Supply Chain Resilience

If the grid stays on or comes back quick, supply chains almost always persist. When and where the grid is gone and not bouncing back anytime soon (or anywhere close), supply chain resilience quickly becomes fundamental.

Where water, food, fuel, and pharmaceuticals are still flowing while the grid is gone, human suffering can be mitigated. Where the grid is gone and flows have seriously slowed or stopped, suffering and death will be amplified.

The global grid — including the US network — has undertaken a significant transition in sources and structure. Last year, 2023, the leading sources of US power generation were roughly: 43 percent natural gas, 18 percent nuclear, 16 percent coal, 10 percent wind, 6 percent hydro, 4 percent solar, 3 percent all other. Several projections anticipate this mix to undergo rapid changes in coming years, see chart below.

The financial and technological challenges involved in this transition are considerable. These supply-oriented challenges are super-charged by sharp increases in baseline demand for electricity in some places and, especially, weather-related demand surges (sometimes in the same places).

For almost two decades US electricity demand has been flat. The Energy Information Administration continues to project overall slow growth of about one percent through 2050. But within this general trend are dramatic local differences. Reuters recently reported:

Southern Co expects data centers to propel its electricity sales growth to 6% each year from 2025 to 2028, up from predicted growth of 1% to 2% annually through next year. Sales from its Georgia Power business unit are seen jumping to an unprecedented 9% a year… Executives from American Electric Power, an electric utility based in Ohio, said the company’s retail customer demand grew 2.5% in 2023, much faster than its earlier 0.7% projection, due primarily to the acceleration of data center power use.

On top of these sort of baseline increases, some regions — especially in the southern and western United States — face prospects of volatile demand related to extreme weather (more and more and more and more). For example, according to the Electric Reliability Council of Texas between June 27 and August 10, 2023 the Texas grid experienced ten successive all-time peak demand records as a result of high heat. The more expansive — and populated — these areas of extreme temperature, the more challenging to deliver reliable supplies. (Cold can also complicate, see here and here.)

NERC Summer Reliability Assessments for 2024 will be available next month (related here and here and here).

Meanwhile we already have several indicators of a significant 2024 Hurricane Season. Last week the Weather Channel projected, “24 named storms, 11 of which will become hurricanes and six of which will reach Category 3 status or stronger. T​hat is well above the 30-year average tally for both hurricanes and storms, and also markedly above the tally of 20 storms, seven hurricanes and three Cat 3-plus hurricanes in 2023.” In a similar season forecast, the well-respected team at Colorado State University “predicts that 2024 hurricane activity will be about 170% of the average season from 1991–2020. By comparison, 2023’s hurricane activity was about 120% of the average season.”

We know how tough grid loss can be as a consequence of hurricanes. Grid failure in the immediate advance of a major hurricane could be even worse, seriously complicating warning, preparation, evacuation, and grid recovery.

The energy transition plus increasing demand plus the increased threat of extreme weather will be a risk multiplier for both the grid and supply chains over the next decade and probably much longer.

Energy Fitness

In my experience supply chain resilience can more-or-less be assumed if the grid persists and fuel is available. It may be difficult and treacherous, but where electricity and fuel can flow, demand and supply will conspire to keep other flows moving too.

I have long argued that Supply Chain Resilience — as strategy and practice — is mostly about how well volumes persist and push fulfills pull when the grid is gone for an extended time over wide areas. In such circumstances, fuel flows and alternative sources of power spike in substantive and financial value.

The world is in the midst of significant, fundamental energy transitions (purposeful plural). A quarter-century from now the grid and other energy sources will be structured and behave very differently than today. The path between now and then is variable, exploratory, and very risky… especially when and where energy demand is surging. (Not making the transition would entail even greater risk.)

Earlier this week I confessed to needing more time before offering anything meaningful about our current energy fitness. I am trying to discern — and accurately condense — how various fossil fuel dependencies and emerging alternative energy sources can (or won’t) play together in case of major hurricanes, earthquakes, cyberattacks, and other very hard hits on people and places.

As my quarter-century framing suggests, there are several longer-term speculative issues to engage. There are also nearer-term issues of grid reliability, natural gas availability, velocity of technological adoption, and many other factors to actively observe and try to anticipate. This morning, though, I am fixated on the following chart of trades on Brent Crude future contracts over the last two years and last few hours.

Given our recent and continuing geopolitical context and as someone who cut-my-teeth on the 1970s oil market, I am amazed — thankful and hopeful — but still amazed and edgy at how this morning’s news is reflected in market expectations. I certainly acknowledge that today’s energy system (and geopolitics) is vastly different from a half-century ago. But in the face of this morning’s price action I should also acknowledge deeply discounting just how different (and what this means for Supply Chain Resilience).

This is not a time to discount risk or reality. This is very much a time to engage reality and risk at full value. Much more to come…

Amplified demand (and supply)

US retail sales growth for March was more than double what many economists expected. The Financial Times reported, “Data from the US Census Bureau published on Monday showed that retail sales, which include spending on food and petrol, rose 0.7 per cent last month. Economists surveyed by Reuters had expected an increase of 0.3 per cent.” It is worth remembering that February US retail sales were not as strong as expected, see chart below. China’s March retail sales were 3.1 percent higher, well below expectations for around a 4.8 percent gain (here and here). EU retail sales data for March are not yet available, but momentum is sluggish (more).

China’s manufacturing output strengthened in March. Export volumes achieved new records, but export values decreased. Some perceive an escalating problem with “over-capacity” characterizing many of China’s key manufacturing sectors (more). Others have argued that China is exporting deflation (here and here). (Might the United States be critiqued for an over-capacity to consume and, thereby, export inflation?) German exports continue below January 2023 levels (more and more). “Total Market Production” in the European Union has basically been flat or falling since the second half of 2022. The data is deeply retrospective, but US real — inflation adjusted — Gross Domestic Product has done very well in the post-pandemic period.

According to the latest US Department of Agriculture’s World Agricultural Supply and Demand Estimate global wheat and rice production is — and is expected to continue to be — abundant for the current year. Soybean production is flat or slightly lower on reduced demand. There is profound hunger in the world, but this reflects insufficient ability to signal demand (e.g. Somalia) and/or distribution problems (e.g., Gaza), not lack of potential supply.

Midstream flows are troubled by volatile — and often higher — fuel prices. Accumulating network friction — such as drought at the Panama Canal and Houthi missiles, drones and more at Red Sea approaches to the Suez Canal — are the cause of cost and delay increases (here and here , but Panama’s precipitation forecast is encouraging). US truck shipments were flat in February (here and here and here). Compared with the last two years and last two months consistently fewer US rail cars are moving. As a result, it makes sense that the supply chain component of core PCE has been increasing (see second chart below). Given continued — even surprising — US consumer demand plus all the midstream pinch points this is healthy adaptation.

You can compare this month’s flow fitness update to last month’s here. I need a bit more time to look at what is happening with both near-term and longer-term energy flows before reaching a fitness judgment regarding those factors.

I worry that the recent pace of US consumer spending is unhealthy. But given weak demand elsewhere, US consumers are arguably the best buddies of the global economy. There are all sorts of potential risks that could suddenly spike (more). But US productivity outputs have continued to be healthy. So… for yet another month pull is motivating push, demand is mostly being supplied. While there is profound uncertainty regarding future trajectories, right now supply chain speed, direction, and resilience are generally positive.

April 18 UPDATE: The Federal Reserve has released its Beige Book for April. After reading the Beige Book reporters at Bloomberg highlighted:

The US economy seems to be weathering the recent spate of supply disruptions with few signs that worrisome inflationary threats or major logistics headaches are returning… Attacks on commercial vessels near the Red Sea and the destruction of Baltimore’s Francis Scott Key Bridge “caused some shipping delays but so far did not lead to widespread price increases,” it said… “Third-party logistics contacts noted that both demand and shipping rates appeared to have bottomed out following what was characterized as an 18-month freight recession.”

A bit more for Gaza

The volume of supply trucks entering Gaza has increased since late March (see UN chart below). Volume remains below the 500-per-day pre-October 7 benchmark, but the improved pattern — especially if sustained — is helpful.

Distribution of food and other freight once discharged inside Gaza remains very constrained and entirely insufficient for a significant portion of the population. (Here and here and here and here and here.) [April 16 Update: Bloomberg provides a detailed map-based analysis of constraints in Rafah-proper.] This week the director of US AID confirmed in testimony to Congress that famine is stalking northern Gaza.

This morning NPR conducted a five-minute interview with Jamie McGoldrick, the just-departing UN Humanitarian Coordinator for the Occupied Palestinian Territory, regarding food and related supply chains for hard-pressed residents of Gaza. What I hear Mr. McGoldrick saying is coherent with the most credible reports I have otherwise received.

Big Picture: Demand is desperate, supply is readily available, distribution is tightly constrained by physical impediments and deadly risk to distributors. This risk must be persuasively mitigated before available supply can fulfill the fundamental needs of more than 2 million hungry people.

+++

April 14 Commentary:

The deaths of seven World Central Kitchen (WCK) staff in Gaza have had myriad consequences. Here is how the Israel Defense Forces (IDF) explained what happened:

The event occurred on April 1, 2024, during an operation to transfer humanitarian aid from the WCK to the Gaza Strip. The investigation found that the forces identified a gunman on one of the aid trucks, following which they identified an additional gunman. After the vehicles left the warehouse where the aid had been unloaded, one of the commanders mistakenly assumed that the gunmen were located inside the accompanying vehicles and that these were Hamas terrorists. The forces did not identify the vehicles in question as being associated with WCK. Following a misidentification by the forces, the forces targeted the three WCK vehicles based on the misclassification of the event and misidentification of the vehicles as having Hamas operatives inside them, with the resulting strike leading to the deaths of seven innocent humanitarian aid workers. The strikes on the three vehicles were carried out in serious violation of the commands and IDF Standard Operating Procedures.

Here is what World Central Kitchen says happened:

The WCK team was traveling in a deconflicted zone in two armored cars branded with the WCK logo and a soft skin vehicle. Despite coordinating movements with the IDF, the convoy was hit as it was leaving the Deir al-Balah warehouse, where the team had unloaded more than 100 tons of humanitarian food aid brought to Gaza on the maritime route. “This is not only an attack against WCK, this is an attack on humanitarian organizations showing up in the most dire of situations where food is being used as a weapon of war. This is unforgivable,” said World Central Kitchen CEO Erin Gore.

The United Nations Office for Coordination of Humanitarian Affairs (OCHA) has regularly reported on the deaths of others involved in delivering aid. Since October 7 at least 244 aid workers have been killed.

Since mid-November I have been peripherally involved — at a safe distance — in efforts to increase food-flows into Gaza. I gave initial priority to increasing throughput rates at Rafah. I was encouraged by the reopening of the Karem Shalom checkpoint. I then worked with others to increase the number of gateways, especially to fulfill the needs of survivors in Northern Gaza. Despite what sometimes seemed to be potential progress, throughput remained constrained and each newly promised gateway evaporated as if a desert mirage. By the end of 2023 we were trying to squeeze through a minimum of 200 trucks per day, but most days saw less than 100.

By late December I was increasingly focused on improving velocity — speed and direction — inside Gaza. Impediments ranged from structural to technical to kinetic to emotional. But in any case, poor velocity — sometimes near paralysis — further reduced the effective distribution of already insufficient volumes. Constraints on both volume and velocity needed to be (still need to be) loosened to feed increasingly desperate tens-of-thousands.

My first play to improve downstream distribution involved decentralization. In addition to the purpose-built relief nodes, I advocated for proliferating push points, including many more organized and spontaneous charitable operations, commercial sales, and even the black market. With more supply than could be responsibly distributed, I was explicitly pressing for “irresponsible” distribution. Some of my argument — more sanitized in writing than on Zooms and phone calls — can be reviewed at this January 21 post.

By late December I had reached a treacherous strategic judgment. Here is how I started to ease it into operational discussions:

In catastrophic contexts supply chains are almost always caught in a narrow place between what is prudent and what is imprudently possible (and failure may be probable). From this distance, I recognize the painful pinch in Gaza. I am not ready to second-guess decisions made by those whose lives are wedged in this tightly constricted time and space. But in any case, each day the deadly consequences sharpen and accumulate.

January saw no substantive improvement. February’s incoming volumes fell precipitously and distribution velocity decreased even further. Hunger accelerated toward famine. As the war entered its fifth month, the dogged determination of aid workers was, it increasingly seemed to me, diminished by despair. Again and again it was asserted that a sustained ceasefire was the minimum precondition for improved mass feeding. This was and is a prudent judgment. I continued to argue for imprudent possibilities.

On Thursday, February 29 as the IDF attempted to distribute food at Nabulsi, fear, chaos, and violence resulted in more than 100 dead and multiples wounded (more). In response to this horror, creativity and courage confronted both hunger and despair. World Central Kitchen was at the forefront of this new thinking and action. By mid-March, WCK was the first to use the Amalthea maritime channel. WCK arranged the construction of a practical jetty and delivered almost 200 tons of food into hardest-hit northern Gaza. A second even larger delivery was completed by sea on March 30. The seven who were killed on April 1 were pushing forward with plans for more. WCK has now paused operations. Development of the Amalthea maritime channel continues, but in the dark shadow of those who have died — some suddenly and too many slowly — despair has reclaimed much of its prior prominence.

Despair is a terrible adversary. Courageous creativity is needed now more than ever. Aristotelian prudence benefits from dialogue with Homer’s heroics and revelation of hubris… and Amalthea’s tender care.

Going forward in Gaza — and other catastrophes — the last four months have taught me to give much more attention to threat frequency, virulence, and intentionality.

Most of my prior experience has been in post-catastrophe contexts: the hurricane has moved on, the flood is draining, seismic aftershocks are diminishing. In responding to major disasters there are significant risks, especially in immediate response. But intentional violence is rare. Rather, in the aftermath of most disasters there is often an outbreak of intentional altruism and unusual collaboration. War time is different. Gaza has been different. I have failed to give sufficient weight to the amplified sense of risk when and where there is a pattern of intentional violence.

The frequency — recurrence — of any threat influences disaster response. Up to a point, more frequent encounters with a recognized threat can reinforce resilience — at least when a threat is perceived as random as with most natural hazards. Florida is more resilient to hurricanes than other places because of recurring experience. Gaza has been more resilient to food shortages due to many years of experience. But at a certain point too-many too-hard hits in too-short a period of time will exceed resilient capacities. Perceived — and actual — intentionality of recurrence accelerates this exceedance.

Virulence — severity and scope — of harm is also a threat amplifier. Three-quarters of Gazans have been displaced from their pre-October 7 homes. It is estimated that more than one million (of roughly 2.3 million) Gazans are experiencing “catastrophic levels of food insecurity.” More than 33,000 have been killed, many more have been wounded. Homes, workplaces, hospitals, water systems, roads, and power networks have been destroyed. That these are the outcomes of intentional violence amplifies the expectation and experience of harm.

Given this context, I ought not discount the courage required to survive each day. It is short-sighted and stupid to critique caution in risking innovative scalable answers. World Central Kitchen was taking this sort of risk. Seven of their staff paid the ultimate price for their creative commitment.

The last two weeks I have been engaged in reconnaissance of an active seismic area with catastrophic potential. When these faults explode the virulence of the event will, of course, inform the perceived risk of responding. The magnitude and frequency of aftershocks will, of course, shape the response and recovery strategy. If I am still alive for the aftermath, I will now be much more attentive to any aspects of intentionality that seem to be emerging. We need a response strategy that will lead with explicit, consistent, intentional care and as much courageous creativity as possible. Some of my peers who were in New Orleans post-Katrina have previously discussed these lessons-learned, but until now I did not fully hear them.

Saifeddin Issam Ayad Abutaha, Laizawmi “Zomi” Frankcom, Damian Soból, Jacob Flinkinger, John Chapman, James “Jim” Henderson and James Kirby, I have heard you. Thank you for your courage, creativity, and profound instruction. Thank you for your lives of self-sacrificing service to the most vulnerable.

+++

World Central Kitchen held an interfaith Celebration of Life to honor their colleagues who were killed in Gaza. The memorial service was held at the National Cathedral in Washington, DC on Thursday, April 25.   Below is a video of the service.