Month: August 2021

Update: Delta’s Demand Curve

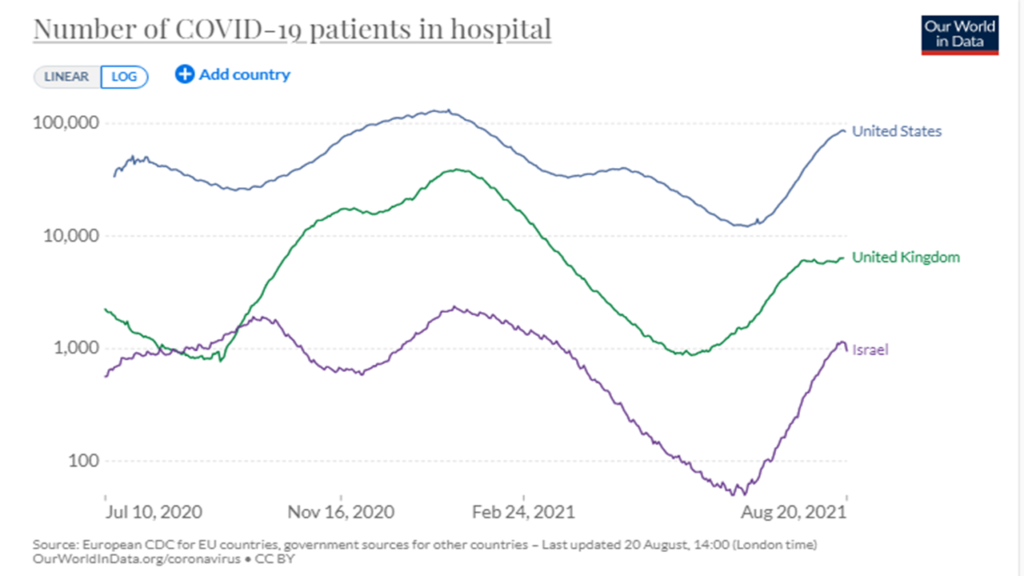
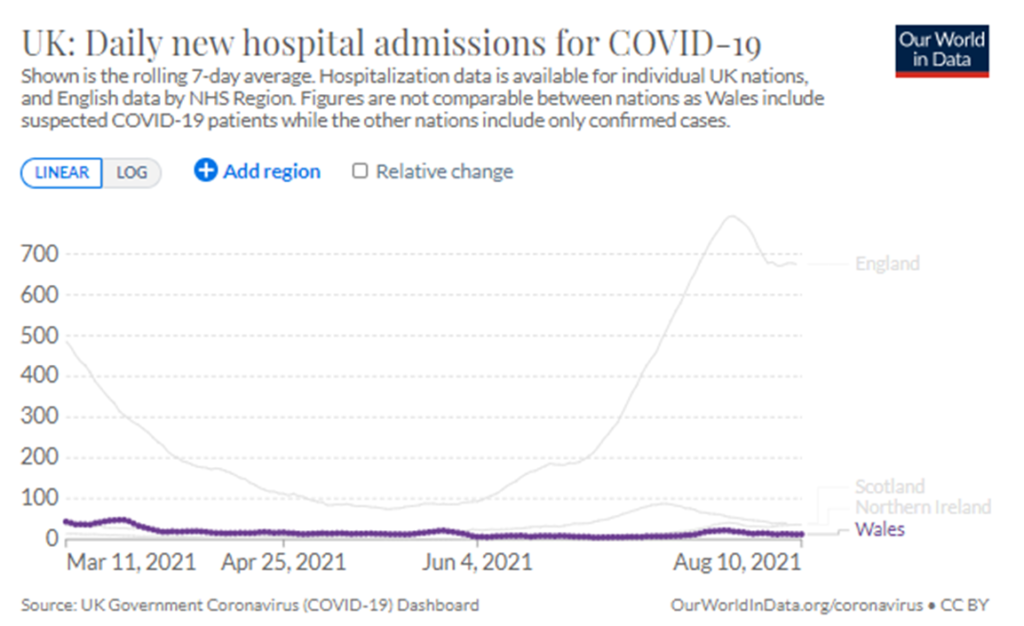
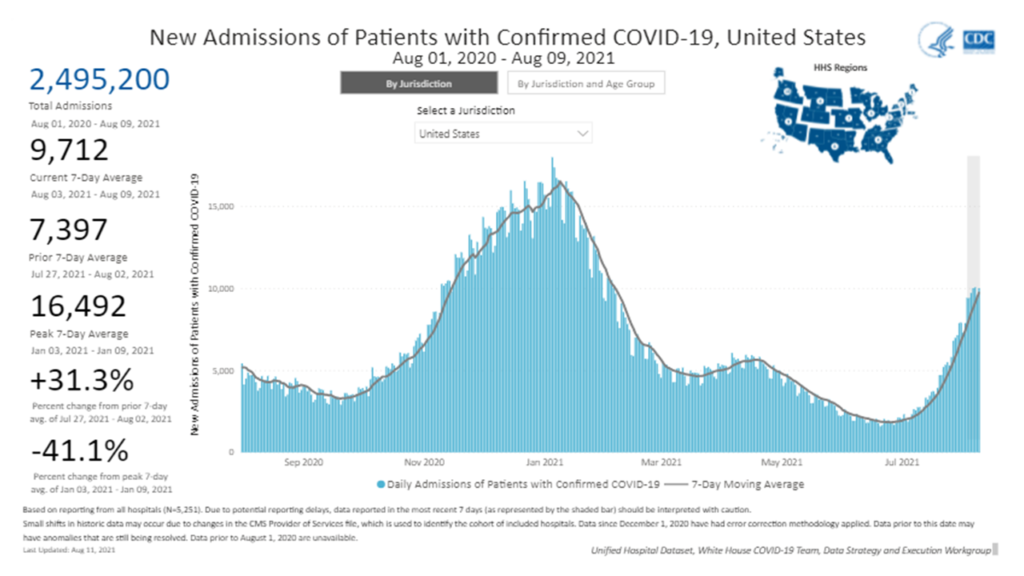
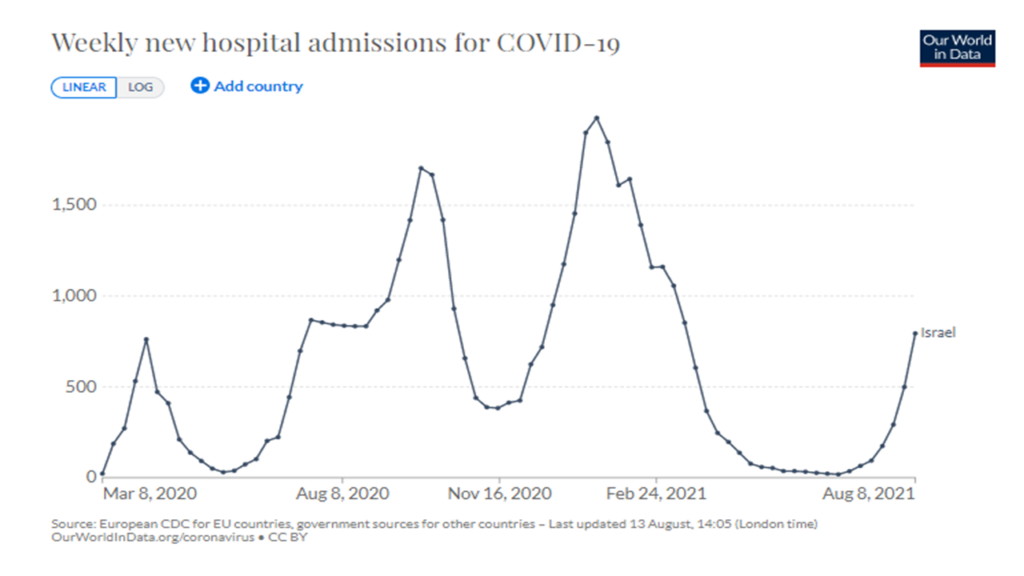
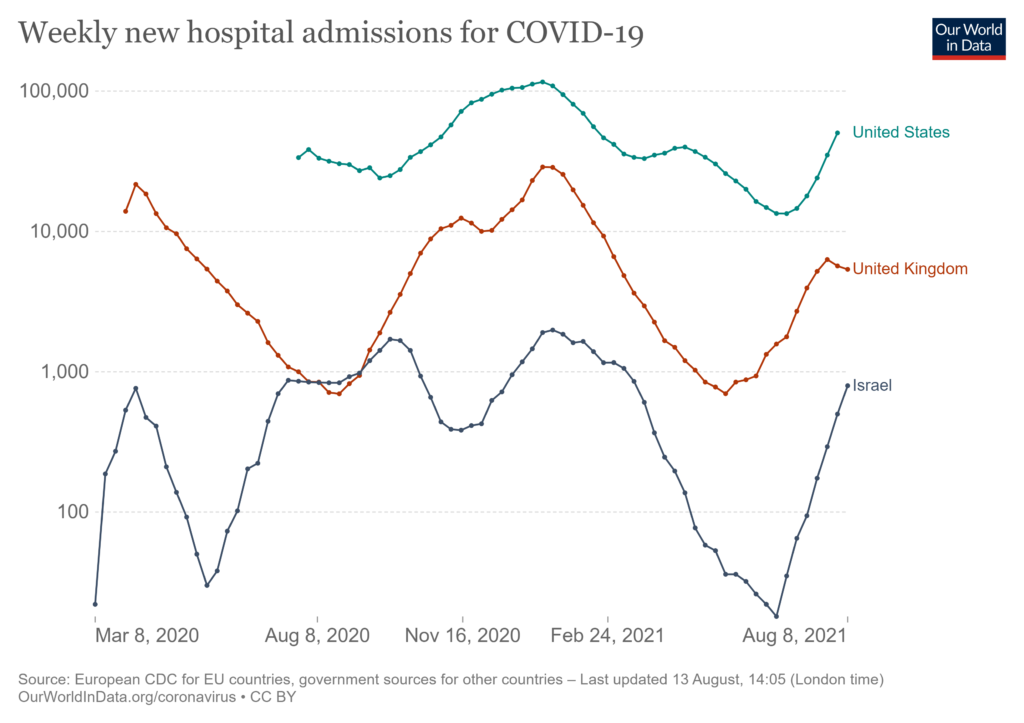
At the end of May when the UK — mostly England — began to experience increasing Delta-driven hospitalizations, both the USA and Israel still had a month more of declining covid-related hospital admissions.

After about eight weeks of sharply increased hospitalizations, England plateaued. Seven weeks into their own surge, the USA and Israel are seeing some softening. Will it continue? Will that plateau be replicated?

The chart below uses a logarithmic scale to better visualize the statistical ratios of three very differently sized populations.

Inventory to Sales Ratio steadies (?)

We have known for awhile that retail sales increased in June. We have wondered — worried — if inventories could get even worse. Well, worse is certainly possible, but we hoped it might be avoided. According to the US Census Bureau, hope has, just barely, hung on with the inventory to sales ratio increasing 0.8 percent in June. Combined with the 0.6 percent increase in May, we might even hope for a trend. According to the look-ahead for July (more), retail demand may be softening which would create space for inventories to claw back a bit more even in the face of continued disruptions in supply chain velocity.

Chokepoints

The Financial Times helpfully quantifies and maps this global challenge. These great ports were designed as bottlenecks, benign or better. They have become complicated chokepoints, incremental delays accumulating into self-amplifying congestion. To manage the problems, options mostly involve expanding time or space. For many ports, time is more elastic than space. Mario Cordero, executive director of the Port of Long Beach, is pressing for opening a third shift (more).

The power of reticence?

Since mid-July the number of new confirmed cases of covid in the United Kingdom has fallen from above 50,000 per day to about 20,000 per day.

According to The Financial Times:

In the week before the government lifted most remaining coronavirus restrictions in England on July 19, the average person was in close contact with 3.7 individuals a day, according to the CoMix survey of more than 5,000 people in England carried out by the London School of Hygiene and Tropical Medicine.

The CoMix Survey does not inspire enormous confidence as a data source. But even if the precise person-count is off, if the trend is correct this clearly would contribute to mitigating circulation of covid.

I would have even less confidence in a similar survey of US residents. The roughly analogous indicator that I watch is cell phone mobility. According to the Institute for Health Metrics and Evaluation at the University of Washington, in late July overall US mobility was only six percent below pre-pandemic “typical” mobility. Below is the mobility trend generated by Cuebiq’s data analysis methodology. Gregarious behavior opens all sorts of opportunities — and risks.

宁波 no longer serene

My favorite headline from earlier this seek is “Oh no, not Ningbo!” (thank you Freightwaves). Dark humor can be helpful, especially given recent — recurring — events.

Early Sunday, August 8, operations were suspended at the Meishan Island International Container Terminal (MSICT) at the Port of Ningbo-Zhoushan. The Meishan Terminal usually handles about one-quarter of Ningbo’s annual volume of 27 million plus TEUs. So, global container flows suddenly lost the equivalent of the Port of New York-New Jersey.

Early hopes that the shut-down would be a precautionary pause had faded by Friday, August 13. A dockworker with symptoms initially tested negative, but on August 11 a covid diagnosis was confirmed. He shared tight quarters with many other workers in a port-side dormitory. Any reopening date is speculative. There is also speculation of the virus spreading to other terminals and other China ports.

While miniscule compared to other larger nations, since July 1 China has reported a troublesome bump in confirmed covid cases, which the authorities seem intent on suppressing with the most rigorous measures.

According to some maritime sources, to avoid being stuck in this bottleneck, seventy percent of carriers are self-diverting to other (already crowded) ports. The viscosity of global flows just thickened again. Velocity just slowed and wobbled again. Supply and price volatility further fluctuates. Implications for US and European ports (and economies) should be clear enough.

宁 means serene. 波 means wave.  紊 means confused or disordered.

Below is a screen capture of maritime flows (non-flows… knots… bottlenecks) at Ningbo on August 14 via MarineTraffic.

Delta’s demand curve?

The Delta variant of the coronavirus is ferociously contagious. In India more than 2.4 million deaths have been credibly attributed to Delta’s rapid spread in the subcontinent’s so-called “second wave”, extending from April to June 2021.

Delta was also the principal culprit in the United Kingdom’s — well, England’s — pandemic surge between early June and late July. On June 1, 2021, ninety residents of England were hospitalized with covid-related disease. On July 27 this surge apparently peaked with 793 covid-cases in hospital. As of August 10 the number of related deaths was continuing to climb.

Delta has been spreading rapidly in the United States since May. But through most of June Delta was not causing an observable — confirmable — increase in disease. That began to change in late June. Initial disease outbreaks were localized. But since at least June 27, we have seen increasing hospitalizations over wide areas, especially among the Gulf Coast states plus Arkansas, Missouri, and Georgia.

England is roughly the size of Alabama, but has a population double that of Texas (England has about 56 million residents). England has close to a 90 percent vaccination rate for residents 18 and over, compared to about 56 percent of Texans over age 18 or almost 44 percent of residents 18 and older in Alabama. (More.) Comparing the US experience with Delta to that of England is imprecise.

But because inquiring minds want to know, if the US demand curve for Delta is anything like that of England’s, the US won’t achieve nation-wide peak hospitalizations until early September. Given the much larger geography and lower vaccination rates in the United States, I would not be surprised to see an extended rise. And — England’s fairly high plateau for hospitalizations is interesting too (see first chart above).

Delta is much more optimized to humans than earlier variants. What about Lambda? The covid demand curve in Peru, where Lambda has dominated, may suggest what a post-Delta wave could look like.

+++

August 13 Addition:

Israel is one of the most vaccinated (and healthcare data sophisticated) nations on the planet. Much smaller than England and with less than 10 million residents, Israel and its residents have been early and effective at mitigating covid’s evolving threat. But even Israel is finding Delta a significant challenge. It is now in the seventh week of increased hospitalizations with no signs of softening case counts. The second chart below shows US, UK, and Israel covid hospitalizations on a comparative logarithmic scale. This helps to reveal potential patterns between such dramatically different population samples.

Recovering Flow

In February 2020 we could have preserved flow. Pre-pandemic global demand had been strong. Processing, manufacturing, and transportation slightly lagged demand, but just enough to keep everyone busy.

By late February last year, flows inside China were recovering from a drastic, but brief hiatus. If North American, East Asian, and European demand had kept pulling, the push of supplies — both global and local — would have soon resumed typical seasonal patterns. First quarter global flows are usually comparatively slow.

But demand suddenly and deeply contracted. Existing orders were canceled. Deliveries were left unclaimed. Empty containers were not returned. Orders for future deliveries were not sent. Planes were parked. Ocean crossings were canceled. Assembly lines were slowed or stopped.

In an earnest effort to minimize circulation of a deadly virus, circulation of people was discouraged. This caused a sudden shift in circulation of money too. Well-established pull channels dried up. Other channels flooded. What was being pulled from where and how it was being pushed, changed in an economic blink-of-the-eye.

Unemployment soared, especially among the most consumer-facing service sectors. To preserve lives and livelihoods, more money was pushed out. Given radically altered options for expressing demand, this mostly resulted in an increased savings rate and increased consumption of a few narrow categories of durable goods. Many of my neighbors now have new guns, recreational vehicles, home improvements, and electronic gadgets. They are not alone. See Deloitte’s analysis of Personal Consumption Expenditures immediately below.

Responding to these unpredicted — unpredictable — sharp shifts in demand has been complicated. A persistent shortage of upstream containers has constrained flow recovery. Disease and self-quarantines among stevedores and drayage drivers has slowed movement through many ports. Container ships are waiting longer to embark and disembark. Retiring truck drivers and closed driving schools have reduced capacity available for almost every component of flow. In many cases, demand has been volatile, suddenly surging in one category and as suddenly shifting to another category. Each incremental pinch narrows overall push. Sudden pulls for one product tend to skew adjacent flows too.

So, it is not surprising that the inventory to sales ratio remains so depressed. Joseph Lupton at JPMorgan recently wrote, “While non-manufacturing activity is now tracking a strong and steady recovery, the goods-producing sector has been buffeted by supply constraints alongside continued boomy gains in final demand… The result has been a slump in inventories that, over the past two decades at least, looks to be unprecedented outside of a recession.”

Reflecting that “boomy” unevenness of demand, it also makes sense that there is accumulating evidence of selective stockpiling. How much of this might be Stermanesque (Doganic?) “phantom ordering”? And if so, how badly and widely might this unwind? In late July, John Dizard worried aloud in the Financial Times, “The inventory en route around the world defies the imagination, not to mention the antique information systems in the shipping business. All of that fitfully tracked and delayed stuff, when it finally lands where it is supposed to, looks as though it will create a big enough pile to trigger a bad inventory recession, where demand for goods drops while accumulated stockpiles are run down.”

Short of Dizard’s worst case, the current disequilibrium of supply and demand is likely to generate chop in many channels well into March 2022. And even this projection depends on Delta’s surge peaking as previously experienced in the UK and India. If Delta persists or post-Delta is worse, stand by for storm surge and drought and absence of anything that looks or feels like flow.

A fragment attributed to the ancient Greek philosopher Heraclitus reads πάντα ῥεῖ (panta rhei) or “everything flows”. Some suggest a better translation is “everything is flux.” Most of us find ourselves very much in flux. Some of us are happy with this, Dizard quotes one supply chain player as saying, “For me, the more chaos, the better.” But many others would prefer to recover flow.

In explaining Heraclitus, Plato points to Rhea, mother of the gods, as the source of what we now hear as flow or flux. In the classic myths Rhea overcomes murderous disorder, personified in her husband/brother Kronos (god of time and more), through a shrewd distraction. Flow transcends Time’s fearful greed by seeming to sacrifice what she carefully saves. Just-in-Time? Just-in-Case? Or flexible enough to strategically benefit from disorder. (More)

Early in the pandemic a local retailer simultaneously advertised a sale price for its private-label toilet paper while restricting purchases of all TP brands to no more than two twelve packs (or the equivalent). This fully satisfied the needs of most consumers and seriously reduced the “fearful greed” of a few. The combination of no more empty shelves plus the supply confidence implied by the sale price transformed recurring deficits into persistent flows.

Whoever deployed that paradoxical demand management tactic is a latter-day Rhea.

Re-balancing?

Last week Bloomberg interviewed the CEO of Sysco, who claims, “Restaurants are busy. They’re booming. They’re bouncing back in a strong way. They’re not up just over 2020, they’re up versus 2019 as well.” USDA statisticians agree, finding substantial increases in demand for food away from home since March 2021.

Chart showing increase in eating out expenditures

Expanded food away from home (FAFH) options have been long-awaited. If anything, insufficient supply of food service personnel has constrained expression of full demand. A big bump in Spring restaurant sales is not surprising. I am surprised that, so far, grocery sales have also continued elevated.

By August 2020 the initially huge pandemic surge in grocery demand was done. Total grocery sales increased roughly twelve percent nationwide for all of 2020. For example, Kroger reported an 8.4 percent sales increase, while Albertsons saw 11.6 percent plus. According to recent USDA research, during 2021 grocery sales have continued at about 12 percent above 2019 levels even as restaurant and other FAFH sales increase. Can this last?

As shown below, there has been some softening in grocery demand since May’s USDA report, but nothing dramatic. I am mostly impressed at how consistent grocery consumers seem to be. Deli is much stronger year-over-year because last year demand for prepared food plummeted. Seafood sales are down both because of sky-high prices and reduced supply. Otherwise consumers are buying more groceries than in 2019 or 2020 and spending more at restaurants too.