Month: November 2022

Chicken or egg, food or flow, push or pull?

In the United Kingdom eggs are in short supply. Culling flocks due to avian flu has reduced upstream production. There are social and regulatory constraints on imports (more and more). Avian flu has also reduced stocks of broilers and egg laying hens on the continent (France and Netherlands (US too)). Constrained supply and higher production/transportation costs (often energy-related) have caused prices to increase by half since earlier this year, discombobulating demand in a manner that disrupts supply. It is complicated.

This is not, however, as bad as some were predicting last Spring. At that point the scope and scale of the European energy crisis plus drought projections plus the risk of a wider war prompted some plausible worst-case thinking of wide-spread cuts in core food production, processing, and freight movement. Brexit-related frictions were expected to amplify British consequences (as they have).

While far from a best case, over the last six months adaptations in European energy flows have achieved higher inventories and much more flexible (effective) velocity than I expected. Agricultural production has been uneven, more costly, and bulk transport often delayed, but European food resources are diverse and imports have been available to fill gaps. Freight players and processors have — so far — demonstrated considerable agility. Volumes have been sufficient to fulfill European food demand in the vast majority of places for the vast majority of products, the vast majority of the time.

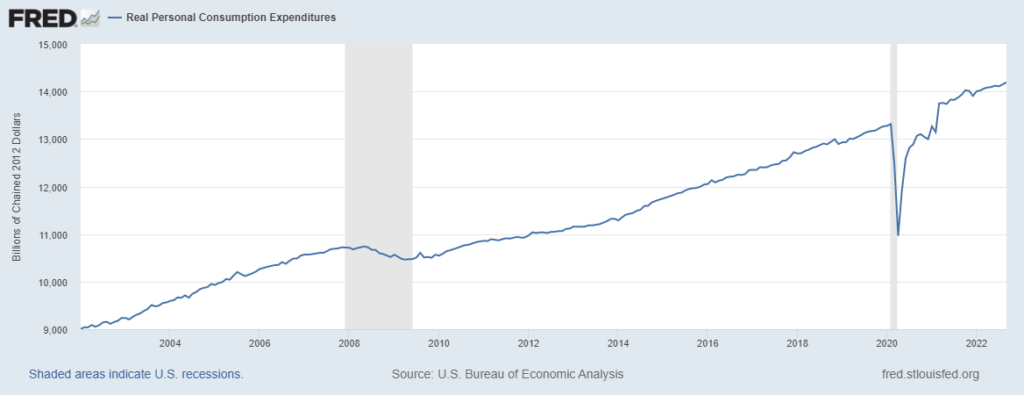
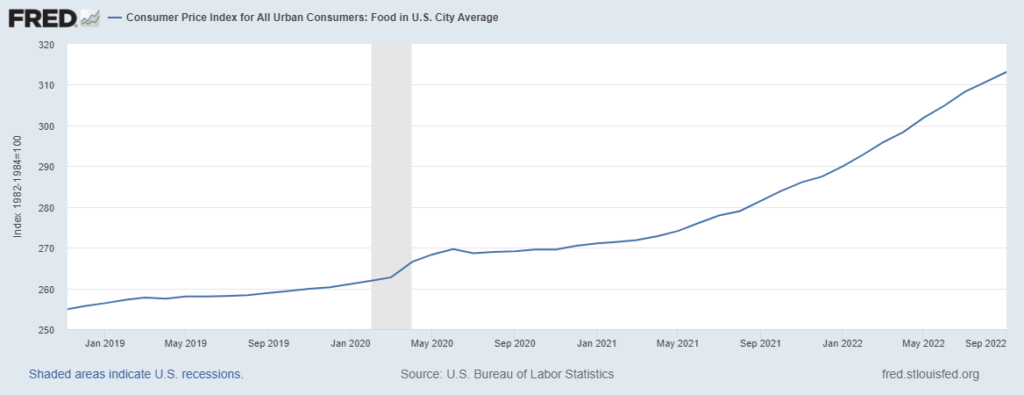
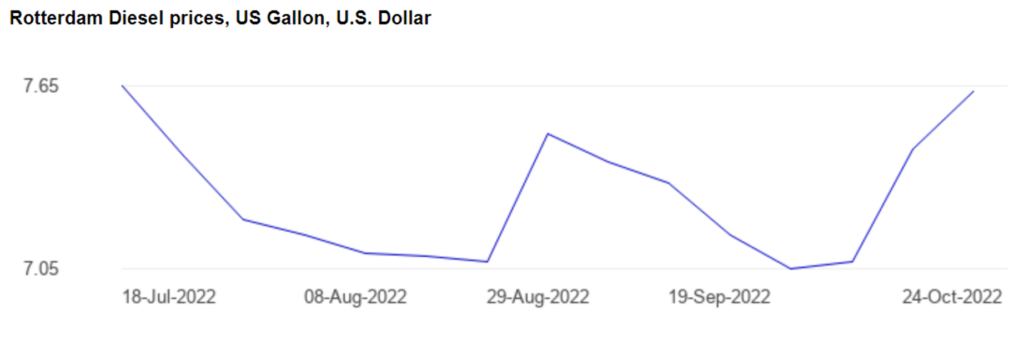
As usual, this success has many sources. But demand pull and open flows have been fundamental. If these two factors had not been available or more seriously constrained, other sources could not have delivered the energy and food needed by 700 million plus Europeans. Spending on energy has soared (here and here and here and here). EU household utility costs are up almost 40 percent compared to decade-plus averages. In October the EU-wide inflation rate for food was over 17 percent (core inflation was just under 6 percent). Through September 2022 LNG imports to the EU already equaled more than the previous full-year record in 2019. During the first half of 2022 total EU food imports increased by one-third. Increased pull has motivated increased push.

+++

In December 2016 I participated in a global consultation on mass care in case of catastrophe — or at least near-catastrophes. The consultation was hosted in Berlin and focused on food flows. One of the principal discoveries was wide-spread lack of understanding related to midstream aspects of the food supply chain. Expertise was readily available for upstream food production, imports, and exports. There was also considerable shared familiarity with consumer-facing retail. But flows in-between were often a mystery.

Nonetheless, after the Berlin consultation I wrote my German hosts, “Given the structure of European food flows and the character of your risk vectors, the only catastrophic potential I recognize is the intentional targeted destruction of war.” This was not a prediction. It was, in fact, supposed to be reassuring.

In February 2019 there was a loosely related Copenhagen consultation on post-Brexit food flows for (mostly) Northern Europe. The lack of midstream awareness persisted, but there was much more sensitivity to how regulatory constraints (e.g., customs processes) can create physical chokepoints. One of our Dutch colleagues noted, “given volumes required, very marginal constraints on flow can have enormous market consequences for volume, velocity and price, spontaneously generating unwanted chokepoints.”

Late this Spring some of the same folks and many new colleagues gathered around Zoom screens to think through European food flows for the soon to arrive war-torn winter. Despite (or perhaps because of) the earlier work, there was considerable anxiety. But by late September when we gathered face-to-face there was much more confidence. Our Dutch colleague was now hosting. His closing remarks included, “perhaps we now better understand the limitations of our understanding and share a deeper appreciation for the ‘invisible hand’ of market pricing to prioritize what is really needed.”

It remains a hypothesis requiring more testing — I can still imagine proving the null hypothesis. We are still a long ways from a proven theory. But there is accumulating evidence for a principle of good practice that gives priority to facilitating pull.

Five vital signs

The fitness of global flows is threatened. Pre-pandemic stresses have mostly persisted, especially related to climate change and terms of trade. The war has imposed further constraints, especially on energy and food (more and more). Demand is certainly not declining. As winter descends on the Northern Hemisphere current constraints will tighten — especially in Europe but there will be related global effects.

The war in Ukraine, Europe’s energy and economic conditions, global inflation, East Asian outputs, and a broad range of US social, economic, and political behaviors are easy to access. You will do so on your own. I will do so here as well. But to supplement these usual suspects, I will give ongoing attention to five upstream factors that should — especially taken together — provide a finer sense of velocity — both near-term and mid-term, say through June 2023.

  1. Southern Hemisphere Agricultural Production with particular attention to Argentina’s corn crop, Brazil’s soybean exports, Australia’s wheat crop (more), and Indonesia’s palm oil output.
  2. Global Diesel Demand, Production, and Price from IEA and EIA monthly updates plus front-month futures at New York Harbor and Amsterdam-Rotterdam-Antwerp. (More and more)
  3. Covid Hospitalizations (and mutations) according to OurWorldinData and whatever I can find and discern on China. To be explicit, I am concerned that as China tries to exit Covid Zero there will be a wave of new infections and variants (more and more).
  4. Chinese Export Volumes and Value can be more accurately tracked than its domestic economic outcomes (more and more). I will especially look for connections between vital signs 3 and 4.
  5. North American Electricity Demand and Supply is more precarious (and pricey) that previously. The worse this winter’s weather, the more cause for worry. Here’s the November 17 NERC Winter Reliability Assessment.

Especially poor performance by any one vital sign is plenty of cause for concern. Two simultaneous problems are more than double-trouble. Three at once is not a charm.

+++

Recently Eric Holdeman interviewed me for the DisasterZone Podcast. Similar to what’s outlined above, we covered a wide waterfront. You can listen here.

Food flows and food security

[Update Below] On Wednesday the G20 Summit in Indonesia concluded with a communique that includes:

Most members strongly condemned the war in Ukraine and stressed it is causing immense human suffering and exacerbating existing fragilities in the global economy – constraining growth, increasing inflation, disrupting supply chains, heightening energy and food insecurity, and elevating financial stability risks. 

On Thursday the Black Sea Initiative that facilitates food flows from three of Ukraine’s ports was extended for 120 days. (More and more and see summary far below.)

Bali and at the Black Sea are linked, more directly than you might think.

Ukraine is typically the source for a significant portion of global food flows — especially corn, wheat, and sunflower oil. Ukraine’s food flows have been disrupted by Russia’s invasion. Early in the war Russian naval attacks — and anticipated amphibious operations — trapped ships in several ports, damaged warehouses, docks, loading facilities, and vessels, and excluded commercial operations in the northwest Black Sea, north of the Danube Delta. This blog did not anticipate any of Ukraine’s ports being reopened until hostilities concluded.

On July 27 Turkey and the United Nations brokered a temporary deal. I did not expect the agreement to stick. But it has — so far. By mid-August a slow flow of foodstuffs had restarted. Several ports remain closed. Sources and channels are profoundly constrained. But according to the United Nations, “As of 17 November, the total tonnage of grain and other foodstuffs exported from the three Ukrainian ports is 11,186,228 million metric tons. A total of 941 voyages (470 inbound and 471 outbound) have been enabled so far.” This flow has been fundamental to sufficient global volumes and some very rough semblance of affordability.

Food security is an acute concern in the Horn of Africa, across the straits in Yemen, all along the Sahel, and in many other places as a result of local crop failures and/or inability to pay in dollars (more and more). Food security is a core long-term strategy for several nations, among them the People’s Republic of China.

S&P Global recently wrote, “In recent years, China’s astounding growth in commodity consumption has outpaced its domestic supplies, compelling the government to import food commodities in large volumes. The Xi administration acknowledges the dire need to raise agricultural imports to satisfy domestic demand. But all that dependency on imports is leaving China vulnerable in its quest to become a superpower… China has been importing corn primarily from the US and Ukraine. However, supply from these origins have been uncertain due to geopolitical tensions.”

This is not where Xi wants to be. So, Xi was ready to agree when the G20 draft communique offered:

We support the international efforts to keep food supply chains functioning under challenging circumstances. We are committed to addressing food insecurity by ensuring accessibility, affordability, and sustainability of food and food products for those in needs, particularly in developing countries and least developed countries. We reiterate our support for open, transparent, inclusive, predictable, and non-discriminatory, rules-based agricultural trade based on WTO rules. We highlight the importance of enhancing market predictability, minimizing distortions, increasing business confidence, and allowing agriculture and food trade to flow smoothly. We reaffirm the need to update global agricultural food trade rules and to facilitate trade in agricultural and food products, as well as the importance of not imposing export prohibitions or restrictions on food and fertilizers in a manner inconsistent with relevant WTO provisions. We are committed to sustained supply, in part based on local food sources, as well as diversified production of food and fertilizers to support the most vulnerable from the disruptions in food trade supply chain. We will avoid adversely impacting food security deliberately. We commit to facilitate humanitarian supplies for ensuring access to food in emergency situations and call on UN Member States and all relevant stakeholders with available resources to provide in-kind donations and resources to support countries most affected by the food crisis, as required and based on assessed needs by governments of affected countries. We continue to support the carve out of humanitarian activities from sanctions and call on all nations to support this aim, including through current efforts at the UN. We will continue to closely monitor the state of global food security and nutrition.

While at the G20, President Xi said that China, “resolutely opposes attempts to politicize food and energy issues or use them as tools and weapons.” (More and more)

Following release of the surprisingly strong Bali declaration, one insider was quoted, “The Indonesians were smart. They started on something everyone could agree on, which was food security, and then built on that…” If food security is fundamental, there is every motivation to acknowledge what is happening to Ukraine’s grain and support continued flows. After several days of negotiations, it was clear to almost everyone — even the Russian Foreign Minister at Bali — where the G20 would land on Wednesday. This was instrumental to deciding where Turkey, the United Nations, Russia, and Ukraine would land on Thursday.

Supply Chain Resilience is a policy, strategy, and practice to maximize continued flows of demand and supply under severe duress. Supply Chain Resilience focuses on natural, accidental, and intentional disruption of flows. Intentional government action is a recurring source of various impediments ranging from delivery curfews to weight restrictions to public health interventions to bombing port facilities. Government actions usually have a purpose only indirectly related to supply chains — and the flow impediments caused by these intentional acts are often unintended.

Our settings are seldom as dramatic as Bali and the Black Sea, but Supply Chain Resilience often involves unveiling heretofore hidden connections between flows and policy. Reducing impediments and releasing flows often requires resolving heretofore hidden conflicts between policies. Supply Chain Resilience often depends on key decision-makers (both private and public) recognizing that flows of water, food, fuel, pharmaceuticals, and other critical freight are priorities that should not be unintentionally constrained — especially in a crisis.

+++

Following is an infographic developed by S&P Global and published on November 16.

November 24 Update: S&P Global reports, “The first shipment of Brazilian corn has started its voyage to Guangzhou, China after MV Star Iris, laden with 67,000 mt of corn, sailed from the Brazilian port of Santos at about 5 pm local time Nov. 23… Currently, China imports corn from the US and Ukraine to meet its domestic demand on top of its local production. China’s long-awaited participation in the Brazilian corn market is expected to shift global trade flows for corn…”

November 29 Update: S&P Global reports, “Corn buyers in Europe are growing concerned that their competitively priced supplies from Brazil will dry up as China begins to buy from there too.”

Streams flowing slow and shallow

For the week ending November 12, barged grain movement in the United States was down one-third from last year at this time. Oceangoing grain cargoes from US Gulf Coast ports are down roughly 40 percent compared to 2021.

Upstream sources (in this context literal as well as figurative) are not nearly as sparse. It has been a spotty and in some places tough harvest, but the late-season forecast for US corn production is down eight percent from 2021 and soybeans are down less than four percent.

This year’s drought across the vast Missouri, Mississippi, and Ohio rivers watersheds certainly constrained this season’s US agricultural production. The secondary impact on riverine freight has been the worst since at least 1988. Bloomberg recently put these slow flows in global perspective:

This year has seen rivers across the US, Europe and China shrinking amid scarce rains and high heat. The vaunted Colorado River, caught in the Southwest’s worst drought in 1,200 years, has dwindled to the point where its major hydroelectric dams are in danger of shutting down, threatening the booming desert cities that rely on it. In Argentina, the Parana River fell to its lowest levels in 77 years, crimping crop exports down the waterway, while Europe’s Rhine and Danube almost saw traffic halt. And even as a powerful monsoon season flooded Pakistan, drought in China dropped the Yangtze River low enough that glittering Shanghai had to turn off lights to save power.

From mid-October to mid-November river levels across the interior United States were historically low. For most of thirty days, the water level at Memphis was eight to more than ten feet below median. The Mississippi River is highly engineered. But it has required constant dredging to keep a reduced number of lighter-loaded barges moving downstream

Over the last several days lower Mississippi River water levels have recovered slightly. This morning the river gage at Memphis is one-foot below median, compared to over eight-feet negative just last week. The number of grain barges unloaded at New Orleans is up over one-third compared to the first week in November. Slowly we turn…

It will, however, take considerable time — and continued precipitation — to decongest the long queues of barges that have accumulated during the low drafts and slow flows of the last several weeks (see map below). Earlier this month industry insiders pointed to several queues of “over 100 vessels towing over 2,000 barges waiting to pass through different points along the river.” Starting tomorrow, November 19, managed discharges on the Missouri River will begin to be reduced. The extended forecast for precipitation across several critical watersheds is especially uncertain.

Downstream demand for grain is persistent… even insistent. Upstream production can vary dramatically by season and region, but this year global harvests have not significantly reduced overall food availability. Midstream distribution has, however, been disrupted and constrained (not just in the United States). Distribution constraints increase costs (more). In just the last week, the barge freight rate for some portions of the interior United States has been close to 150 percent higher than the three-year-average. Increased costs are reflected in increased consumer-facing prices which can seriously constrain affordability. (Please see the Global Food Security Index.)

In the case of the Greater Mississippi River watershed, recent distribution constraints have had mostly natural causes. Accidental and intentional impediments have also occurred, but these have had mostly incidental rather than systemic impacts. Right now there is a fair chance that natural and supply chain flows will recover enough to feed those able to buy (and pay those growing, processing, and transporting). But it is worth noting how we have been operating so close-to-the-edge of several impervious impediments.

US maritime inflows

[Update Below] Over the last year, inbound maritime flows to the United States have slowed and dispersed (see chart below). This adaptation seems to be accelerating in the current quarter.

Recently declining demand for imports is behind the slowdown (see second chart below). The dispersion is part of a long-term trend. Demand-pull is usually fickle. Supply-push is inclined to be stubborn.

According to S&P Global, even as West Coast ports have experienced declining volumes, “South Carolina Ports handled 256,879 TEU during October… up 9% against the year. Loaded imports came to 121,305 TEU, up just under 13% on the year. October was the third busiest month in the port’s history. Elsewhere, the Port of New York/New Jersey moved 842,219 containers in September, over 130,000 more than the Port of Los Angeles during the same month.” (More and more.)

Dispersion arguably began in 2016 when new and larger locks allowed for passage of much bigger container ships to and from Asia through the Panama Canal. Pandemic pressures have accelerated use of alternatives to the Ports of Los Angeles and Long Beach (pre-pandemic it was typical for more than 40 percent of US container imports to be received at LA/LB). Intense congestion at LA/LB encouraged diversion of flow to ports other than San Pedro Bay. The ongoing threat of labor action at all US West Coast ports has reinforced this choice. A possible US rail strike would quickly cause congestion at just about every US container port, but West Coast inbound is especially dependent on long-distance rail to distribute East Bound flows.

So… while it took awhile to find, schedule, and coordinate vessels, drayage, warehousing, and surface transportation, over the last year-plus many US importers have spread their risk. Now that congestion is gone, LA/LB can reassert its innate proximity advantage for East Asian sources. Once the risk of labor action is resolved, US West Coast ports will reclaim some proportion of total flows. But the newly expanded US Gulf and East Coast channels will not be abandoned. They also have an innate comparative advantage in their proximity to many million US consumers.

[Soon to come: US Outbound Flows… especially via the Mississippi River]

+++

November 22 Update: Bloomberg reports: “Ports on the US West Coast could permanently lose as much as 10% of the seaborne cargo that has been diverted to the Atlantic coast amid logistics bottlenecks, regulatory headwinds and labor uncertainty.”

“Competition for non-Russian diesel barrels will be fierce.”

[Updates below] The International Energy Agency’s November Oil Market Report summarizes recent market behavior:

Diesel prices and cracks (differential to crude oil price) surged to record levels in October, and are now 70% and 425% higher, respectively, than year-ago levels while benchmark Brent prices increased just 11% during the same period. Distillate inventories are at multi-decade lows. French refinery strikes last month and upcoming embargoes propelled diesel prices in Rotterdam, Europe’s main trading hub, to more than $80/bbl above North Sea Dated at one point, before easing somewhat. Diesel premiums in the United States have also soared ahead of the winter heating season in the Northeast.

Diesel is not the only petroleum product with shallow inventories. Based on the IEA report, Bloomberg outlines, “Combined government and industry oil stockpiles in developed nations have fallen below 4 billion barrels for the first time in 18 years, having declined by 177 million barrels this year…”

Looking ahead, IEA anticipates more global diesel (and other petroleum) production capacity by the close of 2023 and, probably, flat or lower demand between now and then (on the back of high prices and economic slow-downs). The balance between demand and supply is, however, sufficiently tight and near-term push options are sufficiently constrained that outbreaks of regional disequilibria would not be surprising.

Tomorrow, November 16, we will get EIA’s update on US diesel inventories.

+++

November 17 Update: I will call the weekly change in US diesel stocks non-material: making moves that do not change our essential condition. Total national distillate inventories increased from an estimated 106,263,000 barrels to 107,383,000 barrels. See historical moves and comparisons in chart below.

Regional inventories are probably what will matter most in a pinch. The Central Atlantic (PADD 1B) is especially tight. Local refining capacity is anemic and it is a long distance from Gulf Coast refining capacity or European sources discombobulated by the uncertainties of war-time winter. But no US region has average, much less above-average diesel stocks. Many — all? — skate the edge of a supply chasm in case of any significant loss of current capacity resulting from natural, accidental, or intentional impediments.

Based on EIA data, S&P Global highlights strong US demand, “Robust refinery demand contributed to the draws. Nationwide refinery utilization climbed for a third straight week, rising 0.8 percentage point to 92.9% of capacity, while refinery net crude inputs edged up to 16.15 million b/d, an eight-week high. At those levels, utilization and net crude demand were 5.4% and 2.6% above their respective five-year averages.”

About midnight the Financial Times reported (in a helpful overview),”The contraction of diesel stocks comes amid steady demand and rising exports to Europe to offset now-sanctioned supplies from Russia. Pressure on US stocks is expected to worsen in the winter, when European sanctions on seaborne Russian crude oil tighten in December and are extended to refined petroleum products in February.”

November 21 Update: Reuters reports, “The European Union will ban Russian oil product imports, on which it relies heavily for its diesel, by Feb. 5. That will follow a ban on Russian crude taking effect in December. Russian diesel loadings destined for the Amsterdam-Rotterdam-Antwerp (ARA) storage region rose to 215,000 bpd from Nov. 1 to Nov. 12, up by 126% from October.”

November 22 Update: Bloomberg delivers an excellent update and overview regarding the global diesel market. Two paragraphs highlight prior reports by this blog:

Within the next few months, almost every region on the planet will face the danger of a diesel shortage at a time when supply crunches in nearly all the world’s energy markets have worsened inflation and stifled growth...

To be sure, prolonged, diesel shortages throughout the US are improbable since the country is a net exporter of the fuel. But localized outages and price spikes are likely to become more frequent, especially on the East Coast, where a dearth of pipelines creates huge bottlenecks. The region is heavily reliant on the Colonial pipeline that’s often full…

Just In Time, Just In Case, or just right?

JIT is taking plenty of punches. At recent conferences I have heard speakers accuse “Just in Time” of causing shortages of canned soup, diesel fuel, and baby formula.

A recent survey of 400 business decisionmakers by SAP found that almost two-thirds are moving from “just in time” supply chains to “just in case” supply chains featuring more stored inventory. An SAP executive explained, “Over the last couple of decades, the ‘just in time’ approach traded resiliency for efficiency and lower costs, which in turn made the supply chain fragile. The pandemic and the snowball effect of related disruptions exposed this fragility, which has organizations refocused on resiliency.”

Listening to those who blame JIT, I mostly hear complaints that contemporary supply chains have gone too far in reducing inventories. We need more stock in various back rooms they claim. This angle is especially emphasized by those pushing the so-called “Just In Case” approach.

There is evidence for reduced inventories. According to US Census Bureau surveys (see chart below) prior to 2002 the ratio of retail inventory to sales was usually above 1.6 to one. Between 2002 and 2008 the ratio declined to about 1.5. After an inventory surge — also-known-as demand destruction — early in the Great Recession, the ratio fell below 1.4 before recovering to about 1.5 for most of 2015-2019.

Clearly these aggregated data can obscure significant product-specific variations (and tell us next to nothing about upstream stocks). But if you perceive (as I do) that JIT has been an increasingly common characteristic (aspiration) of contemporary supply chains, these data suggest that for the last two decades JIT has been roughly predisposed toward a 1.5 to 1.0 retail inventory to sales ratio. In other words, for every three units expected to be consumed there is a well-demonstrated tendency for two more units to be on the shelf or in the “back room” (and more are supposed to regularly arrive).

Not enough? Too much? If not enough, how much more should be stored just-in-case? Just in case of what? A sudden demand for one-fifth more than ever before (as some products experienced in March 2020). Losing one-fifth of production capacity (as with refining capacity between 2019 and 2021). A weeks-long loss of Mississippi River barge flows or Suez Canal container flows or a long-term rail strike or… name your threat. We have also seen that increased inventories increase financial and operational vulnerabilities in case of lost demand… as many US retailers have recently learned.

Just-In-Time is not — should not be — an inventory minimization strategy. That is a misleading goal and risky measure. JIT inventory management is one element in a whole-system process to better calibrate supply with demand. JIT is part of a flow optimization strategy — involving production, procurement, distribution, inventory, sales, consumption, and more — to better ensure delivery of what is needed, where it is needed, when it is needed, at a price that consumers can afford, and at a cost consistent with sustainable capacity.

The interplay of these variables can be treacherous. Failure to deliver what is needed when and where it is needed suppresses potential financial outcomes — and opens opportunities for competitors. Consistent failure to deliver what is needed will threaten the survival of the enterprise. Depending on the product, failure to deliver what is needed can threaten lives. Regularly delivering more than is needed wastes resources, increases overall costs, reduces potential financial margins, and diverts constrained assets — human, financial, operational, and more — that could be used to more effectively fulfill higher priority needs.

It is wasteful — and in many cases, practically impossible — to establish buffer stocks sufficient to fulfill high volume, high velocity demand in the aftermath of worst-case events (more). Blaming insufficient buffer stocks for pandemic-related supply chain challenges is analogous to blaming too few dining room chairs for problems in the kitchen (or grocery store or garden) or the arrival of sixty unexpected guests. The prescription is not to abandon JIT, but to ensure that whole-system planning and development deploy JIT disciplines to mitigate worst case risk. How this is done depends a great deal on the nature of each product and patterns of demand. There are, though, three strategic factors that — so far — I have found to be universally applicable.

Diversity of players and places across demand and supply networks enhances structural resilience. Avoid single points-of-failure. Instead of concentrating production or distribution or other throughputs in one place, invest in portfolios of critical capacity (more and more). Control related marginal costs through active management including strategic specifications, standardization, and interchangeability.

Distance is directly relevant to potential costs and time. Capacity closer to dense demand can mitigate possible delays and enhance supply velocity. But diversification still applies. Having all our eggs in any single henhouse (seismic zone or hurricane alley) amplifies the potential threat of the most unlikely fox.

Demand matters most. Too many supply chain decisionmakers watched demand crash between March and May 2020 and apparently could not see around the corner. Demand shifted dramatically, but did not disappear (see second chart below). The most successful firms understood their consumers (and suppliers) well enough to adapt to these shifts (and ongoing volatility). In many cases inventory ratios were suppressed by accelerated demand and higher sales. This is a happy problem.

Diversification of supply chain capacity will almost always involve marginal costs compared with maximized concentration. Proximity to diverse demand clusters will involve variable costs and some increased marginal costs related to labor rates, real estate, and other local conditions. Deep understanding of and creative engagement with demand emerges from sustained investments.

Non-resilience is also costly. In 2020 research by the McKinsey Global Institute found:

A single prolonged disruption can destroy half—or almost all—of a company’s yearly profits, depending on the industry. Based on those results and the probability of actual occurrences, we estimate that, on average, companies can expect disruptions to erase almost 45 percent of one year’s profits over the course of a decade. These are not distant future risks; they are current and ongoing patterns. On top of those losses comes the additional cost of rebuilding damaged physical assets, not to mention the risk of permanently losing market share to competitors that are able to sustain operations, recover faster, or seize on a crisis to innovate successfully.

Just In Time is a rational tactic that for seventy plus years has reduced wasted time and physical resources even as it has facilitated speedy, affordable fulfillment. As with any tactic JIT can be deployed strategically or stupidly. Stupid is as stupid does — too often the result of myopic management measures. Smart strategy requires an expansive sense of space, time, and behaviors. Trite but true (even if Sun-Tzu did not say it): Strategy without tactics is the slowest route to victory, tactics without strategy is the noise before defeat.

Improved equilibrium of demand and supply?

The October Consumer Price Index cooled. According to the Bureau of Labor Statistics, “In October, the Consumer Price Index for All Urban Consumers increased 0.4 percent, seasonally adjusted, and rose 7.7 percent over the last 12 months, not seasonally adjusted. The index for all items less food and energy increased 0.3 percent in October… up 6.3 percent over the year…”

The Wall Street Journal describes this morning’s report as, “the smallest 12-month increase since January 2022. The reading was down from 8.2% in September. June’s 9.1% inflation rate was the highest in four decades.” Several stock market indices jumped with joy at this news.

Specific to food (see chart below), the BLS reports:

The food at home index rose 0.4 percent in October, the smallest monthly increase in this index since December 2021. Four of the six major grocery store food group indexes increased over the month. The index for other food at home increased 0.9 percent in October, after rising 0.5 percent in September. The index for meats, poultry, fish, and eggs rose 0.6 percent over the month while the index for cereals and bakery products increased 0.8 percent in October. The index for nonalcoholic beverages rose 0.5 percent in October, after rising 0.6 percent last month. In contrast, the index for fruits and vegetables fell 0.9 percent over the month after increasing 1.6 percent in September. The index for fresh fruits fell 2.4 percent and the index for fresh vegetables fell 0.5 percent. The index for dairy and related products also declined in October, falling 0.1 percent.

As a supply chain guy my focus on inflation is rather narrow. I am mostly interested in what inflation suggests about the balance between demand and supply. Inflation signals an imbalance exists: there is more demand than capacity can currently fulfill and/or increased production/distribution costs are pushing retail prices higher. At some point persistent inflationary patterns will result in demand destruction.

As previously confessed (and complained about), I have been surprised that despite historically very high inflation, demand for Food-At-Home has remained well-above pre-pandemic levels even as Food-Away-From-Home purchases have fully recovered. Supply capacity for food (here and here) has incrementally increased, but remains challenged by consumer pull (here and here) that is elevated both nominally (as a result of inflation) and substantively (in terms of volume/value being consumed). Each month US consumers are continuing to spend at least 20 billion more inflation-adjusted dollars on food beyond pre-pandemic trends (this is much closer to trend than in January 2022, but still surprisingly high… seems to me).

Given the limits of wage-growth and the savings rate, I don’t see how this level of food demand can be sustained. I am not alone in this judgment, which is one of the reasons that food manufacturing capacity has not filled the gap. Sooo… to move closer to equilibrium, demand needs to decline just a bit more. Today’s CPI can be read to imply this is happening. The Personal Consumption Expenditures report later this month will be more directly informative.

Der Krieg ist eine bloße Fortsetzung der Politik mit anderen Mitteln

[Update Below] S&P Global has, once again, delivered a helpful visualization of the intended (likely? possible?) outcomes of G7 price caps on Russian oil and refined products (see below). S&Ps analysis and commentary highlights ambiguities, especially for shipping markets and related insurers. In any case, this is a further deployment of financial markets and mechanisms to make it more difficult for Russia to continue its war against Ukraine. Since the February 24 invasion, the G7 nations — Canada, France, Germany, Italy, Japan, United Kingdom, and United States (and EU) — have closely coordinated sanctions on Russia. According to an October 11 G7 statement, “We have imposed and will continue to impose further economic costs on Russia, including on individuals and entities – inside and outside of Russia – providing political or economic support for Russia’s illegal attempts to change the status of Ukrainian territory.” These actions are part punishment, part constraint, part setting the stage for future negotiations. Echoing Clausewitz (title’s German phrase ), this too is a “continuation of policy by other means” — perhaps two steps removed from direct violence. (More and more and more)

+++

November 29 Update: The Financial Times delivers a very helpful “Big Read” on prospects for the price cap on Russian oil, with considerable attention to implications for network structures. S&P offers a skeptical angle on the entire effort.

Diesel’s dance with demand

[Update Below] Global refining capacity is very tight (more). Most North American and European refineries are just fulfilling demand by operating at well-over 90 percent capacity. The most significant current concentration of “excess” capacity is in China — which is producing about one-third below capacity (perhaps 18 million barrels per day) due to its domestic economic slowdown (and is not, in any case, organized to export significant flows of refined fuels).

Disrupted flows of Russian crude have complicated refining operations in Europe. Impending constraints on Russian refined product have complicated fulfilling current demand. Recent strikes at French refineries reduced EU fuel inventories, raised prices, and caused spot shortages. Nigeria’s new Dangote refinery has suffered several delays in opening. New capacity in the Persian Gulf and East Asia is not scheduled to begin production until late 2023 or beyond.

The United States is exporting diesel at volumes not seen since pre-pandemic (see first chart below). Latin America has long been a significant consumer of US refined products, especially from US Gulf Coast refiners. This year European demand for US diesel has surged (more and more). Since Russian flows have been disrupted, there has been a particular tug-of-war between diesel demand (and prices) at New York Harbor and Amsterdam-Rotterdam-Antwerp (see second and third charts below). Depending on week-to-week differentials, NYH can still attract diesel flows that would otherwise serve diesel-thirsty Europe. Volatility has been the most discernable pattern (more).

This volatility is reinforced by a structural feature of fuel networks serving the the US east coast — and especially the mid-Atlantic (say, New York to Norfolk). From Maine to Florida (PADD 1) there are only seven operational refineries with total capacity barely above 800,000 barrels per day. Total consumption along the Atlantic is typically more than 7.5 million barrels per day. A big part of the difference is filled by 2.5 to 3 million barrels per day of refined product transported from Texas and Louisiana by the Colonial Pipeline. Another 700,000 barrels per day of Gulf Coast product is carried by the Plantation Pipeline. Maritime deliveries to Florida of about 840,000 barrels per day originate with the same Gulf Coast sources. About 1 million barrels per day of refined product imports serve the east coast, mostly from Canada and OPEC.

This gives Gulf Coast refiners plenty of sales options: Rio, Rotterdam, Riga, and really wherever. Since the Russian invasion of Ukraine there have been plenty of days when non-US consumers were ready to pay way more for Gulf Coast diesel than prices being paid where the pipeline ends near New York Harbor (more). Especially when pipeline capacity is fully allocated, there is a clear incentive to sell where margins are best… and, supposedly, where demand is most desperate. But this also means that East Coast diesel inventories — already suffering late-pandemic anemia — have not been restocked even as pre-pandemic demand patterns re-emerge (here and see final chart below). On a proportional basis diesel stocks are equally low or even lower in Amsterdam-Rotterdam-Antwerp and Singapore than in the United States.

If recent global diesel demand persists, it is unlikely that East Coast diesel stocks will be refilled any time soon (despite the increase last week). If US Gulf Coast refineries continue to operate at 90 percent or better capacity, the Colonial and Plantation pipelines are likely to be fully allocated through this winter. If so, East Coast inventories will probably not see materially deeper deficits per the five year range. If the US economy slows and diesel demand declines, recovery in regional diesel stocks becomes more likely.

+++

November 10 Update: According to Reuters, “U.S. gasoline stocks were down by 900,000 barrels in the week to 205.7 million barrels, the EIA said, compared with analysts’ expectations in a Reuters poll for a drop of 1.1 million barrels. ​Distillate stockpiles, which include diesel and heating oil, fell by about 500,000 barrels, a smaller-than-expected decline.” Here’s the baseline data from the Energy Information Administration’s Weekly Petroleum Status Report. Nice overview of diesel prices and prospects by the New York Times.