Month: February 2023

Global wheat flows

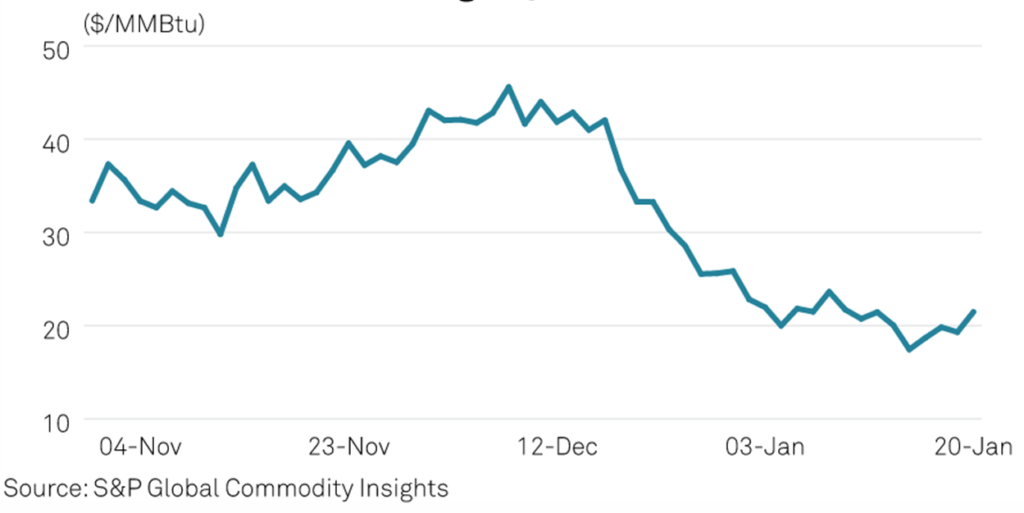
Given wartime constraints on Ukraine’s ports, processing, and internal transportation; serious US, European, Argentine, and other drought; and price-pinching by a strong US dollar, a few months ago there were credible wide-spread concerns regarding sufficient upstream supplies of wheat reaching downstream demand. There have been deep deficiencies in some places. But overall global flows have remained strong and wheat prices have mostly returned to pre-war patterns. Below is a very helpful overview created by S&P Global.

US food consumption slows (again)

US Personal Consumption Expenditures for food, adjusted for inflation, once again showed modest reductions in January (see chart below). In January $1021.9 billion chained 2012 dollars were spent compared to December’s $1022.5 billion (red line). This compares to $1084 billion in January 2022 and $985.9 billion in January 2020. Slowly, slowly we turn. But we are still spending at least two percent more on Food At Home than pre-pandemic — for reasons I can guess about, but have decided data cannot conclusively demonstrate. The economic implications of this consumer behavior (spending more for less) are making many nervous (here and here). But the supply chain implications seem rather benign, at least to me. The full January report from the Bureau of Economic Analysis is available here. In the version of the chart shown below the blue line is nominal consumer spending while the red line shows spending adjusted for inflation.

+++

February 26 Update: Writing at Bloomberg, Laura Curtis observes, “Supply chains across the world are healing up almost as fast as they broke down. That doesn’t mean the pressure they’re exerting on inflation will disappear as quickly… It’s easy to underestimate how long it can take for inflationary trends to work through supply chains.” She then gives evidence for the why, where, and how fast our velocity.

Slowing maritime flows

According to Loadstar, “January import volumes at the ten largest US container ports fell 17.9% against the record throughput of January last year, with the biggest declines at west coast ports.” This morning Bloomberg adds, “Container trade in China has been slow to pick up following Chinese New Year in late January, suggesting the market will likely continue to struggle in coming months as blank sailings have failed to arrest the slide in spot rates.” Demand has fallen deep and fast. The International Shipping News summarizes the current situation as, “the global shipping industry is facing a complex situation, with a freefall in container rates, weak demand, and a shift in trade routes. While the shipping industry may witness a rebound in the future, the current outlook remains uncertain.”

Updating vital signs

It has been about one month since my last update, here we go again:

Southern Hemisphere Agricultural Production: Brazil is poised for a record-breaking soybean harvest, while Argentina’s harvest goes from bad to worse (more and more to even less). Australian yields and export volumes are strong. Ukraine’s outflows have marginally improved, but future flows are profoundly uncertain. US exports are slightly down. (Good global overview from USDA.)

Global Diesel Demand, Production, and Price: The February 5 EU import ban on diesel refined in Russia was widely expected to drain stocks and increase prices. Not yet. Europe bought even more Russian diesel as the ban approached and Chinese exports to Europe have also surged (refining Russian crude?). US diesel inventories have improved since January lows, partially because others have not needed as much as expected (more). European futures have edged mostly higher since February 5, but not really much (see chart below).

Covid Hospitalizations (and mutations): The Lunar New Year holiday has come and gone with plenty of excess deaths in China but no recognized acceleration in mutations or increased virulence.

China’s Export Volumes and Value: Last year was a record-year for China’s exports, but demand cooled considerably in late 2022. According to Trading Economics, “Exports from China slumped 9.9% from a year earlier to USD 306.08 billion in December 2022, broadly in line with market consensus of a 10% fall and following a revised 8.9% drop a month earlier. This was the steepest fall in exports since January-February 2020, amid cooling global demand due to stubbornly high inflation and rising borrowing costs.” Bloomberg economists and others expect reduced demand for China’s exports to persist in the months ahead. Related reporting from the Financial Times, “This month it cost $1,444 to ship a standard 40ft steel container from eastern China to the US west coast at short notice, according to shipping data specialist Xeneta, down from a peak of $9,682 in March last year. The widespread delays and queues, which hit ports at the height of the pandemic, have also dissipated.” (But longer-term shipping costs are still well-above pre-pandemic.)

North American Electricity Supply and Demand: Earlier today the Federal Energy Regulatory Commission ordered improved operational analysis, training, and grid-wide collaboration to reduce the risk of extreme weather to the national electrical grid (more and more). The late December grid crisis caused by sudden weather changes and unexpected shifts in demand across much of the Eastern half of the United States is prompting several efforts at systemic improvement, such as here and here and here and here and here. When this factor was included in these five vital signs, I was not expecting the depth of trouble we have seen this winter. But these hard hits and even more close calls are accelerating mitigation measures.

Two weeks ago the International Monetary Fund released its economic forecast for 2023. Among much more detailed projections, the IMF also offered, “the global economic outlook hasn’t worsened” which many received as good-enough news (more and more). Four months ago when I started monitoring these particular vital signs, I could imagine plausible outcomes much worse than those outlined above. As we move into the Northern Hemisphere’s springtime (wartime?), slightly different vital signs may be more meaningful. But flows of food, fuel, viruses, freight, and electricity are likely to be worth watching in one form or another.

+++

February 17 Update: Helpful complementary round-up on global food flows (and a few other bits) from Bloomberg. European natural gas prices fall to an 18 month — pre-war — low. German supplies of natural gas are in good shape, but there is a concern that demand management efforts are not meeting their objectives… warmer weather has been a much bigger help.

February 20 Update: Bloomberg gives us a “Big Read” on the out-sized role of Russia and China regarding flows of fertilizer.

US January retail sales

Demand rebounded according to the US Census Bureau:

Advance estimates of U.S. retail and food services sales for January 2023, adjusted for seasonal variation and holiday and trading-day differences, but not for price changes, were $697.0 billion, up 3.0 percent (±0.5 percent) from the previous month, and up 6.4 percent (±0.7 percent) above January 2022.  (See chart below). The inventory to sales ratio also improved (see second chart below), despite the bounce back from a couple of softer months. Many are concerned about what this signals for inflation, but the supply chain implications are mostly positive. (More and more and more.)

US January Food Inflation

Here is the complete quote from the Bureau of Labor Statistics on food inflation for January (bold highlights are by me):

The food index increased 0.5 percent in January (see chart below), and the food at home index rose 0.4 percent over the month. Four of the six major grocery store food group indexes increased over the month. The index for other food at home rose 0.7 percent in January. The index for meats, poultry, fish, and eggs increased 0.7 percent over the month, as the index for eggs rose 8.5 percent. The index for cereals and bakery products rose 1.0 percent over the month, while the index for nonalcoholic beverages increased 0.4 percent in January.

In contrast, the fruits and vegetables index fell 0.5 percent over the month with the fresh vegetables index declining 2.3 percent. The index for dairy and related products was unchanged in January.

The food away from home index rose 0.6 percent in January, after increasing 0.4 percent in December. The index for limited service meals increased 0.7 percent over the month and the index for full service meals increased 0.5 percent.

The food at home index rose 11.3 percent over the last 12 months. The index for cereals and bakery products rose 15.6 percent over the 12 months ending in January. The remaining major grocery store food groups posted increases ranging from 7.2 percent (fruits and vegetables) to 14.0 percent (dairy and related products).

The index for food away from home rose 8.2 percent over the last year. The index for full service meals rose 8.1 percent over the last 12 months, and the index for limited service meals rose 6.7 percent over the same period.

Underestimating resilience: my Freeport confession

When a June 8, 2022 fire at Freeport LNG export facility shut-down flows, I assumed the worst. I was not the only one. According to Reuters, “Natural gas prices slumped in the United States and soared in Europe on news of an extended shutdown. The facility accounts for about 20% of U.S. LNG exports and has been a major supplier to European buyers seeking alternatives to Russian gas since its invasion of Ukraine.” (More and more and more.)

In June last year the ability to replace Russian natural gas pipeline flows to Europe with global LNG deliveries seemed very iffy. Losing a major US node would not help. In August when Freeport’s shut-down was extended, I was worried — and said so here.

But even without Freeport’s capacity, LNG flows to Europe have fulfilled this winter’s European demand (and exceeded expectations).

Sunday morning the BP-chartered Kmarin Diamond departed Freeport for Suez, additional flows from Freeport are expected to resume soon. This morning S&P Global reports, “European LNG prices have fallen to an 18-month low with returning Freeport volumes adding further bearish sentiment to the market” (See chart below). The global natural gas market remains constrained, but a mild winter, effective demand management, and proactive procurement has kept Europe supplied without Freeport’s help.

I underestimated the enormous power of effectual demand to attract abundant supply. When suppliers are confident of effectual demand, volumes and velocity will move accordingly. There are always capacity constraints — and less effectual sources of demand may suffer. But when supply is available and there is sufficient value to trade for supply and this value can be effectively expressed, supply will almost always flow.

EUROPEAN BENCHMARK (TTF) LNG FRONT-MONTH PRICING

+++

February 23 Update: S&P Global provides the following infographic. S&P Global also reports, “The return of Freeport volumes is a bullish factor for US markets and a bearish factor for international ones,” Michael Stoppard, global gas strategy lead at S&P Global Commodity Insights, said in an interview. “The return of Freeport LNG is expected to be the single largest supply addition to the global LNG market in 2023 relative to 2022.” As Freeport ramps up to full operations, its return stands to ease tightness in the global gas market, while cutting a US supply overhang that is weighing on domestic prices.

Vegas rules and demand management

Thursday Kinder-Morgan found a gasoline leak in their pipeline that transports refined products from Watson Station near Long Beach to fuel racks in Southern California, Arizona, and Nevada (more and see map below). To fix the leak, pipeline operations were suspended. Before sundown on Saturday the leak was isolated, fixed, and flow was restored.

Friday night and Saturday morning the pipeline pinch prompted so-called “panic buyingin parts of the Las Vegas region. According to the local CBS affiliate, “The panic started when Clark County officials announced they were aware of a leak, affecting a Kinder Morgan gas pipeline in California. That pipeline feeds gas storage facilities with unleaded and diesel fuel here in southern Nevada. It’s one of two major pipelines that feed our area, the other comes from Utah.” (More and more)

As far as I can determine — and according to local contacts — a similar buying surge did not emerge in the Phoenix metro area, despite gasoline flows also being suspended to Arizona and the extra pull of Super Bowl visitors. Worth considering: In Nevada both the Governor and Clark County declared related emergencies. Each statement discouraged panic buying. But neither statement offered any estimate of duration for the pipeline shutdown (more).

I don’t know what Kinder-Morgan was telling government officials — in my experience there can be a reluctance to say much and to avoid restoration estimates in particular. If I was a public official, however, I would have pushed hard for a duration estimate before saying anything — and I would have been very reluctant to declare an emergency. Given the storage capacity of fuel racks in the Las Vegas region, I would have been much more inclined to advise the public that there had been a temporary shut-down of the pipeline, but there was plenty of local buffer stock and no significant disruption in retail supply was likely — unless unnecessary nervous buying began to drain the system (which is what started happening).

Given public attitudes in Las Vegas this more optimistic tone might have caused the same dysfunctional consumer behavior. But in 2021 I was impressed to hear Governor Edwards of Louisiana explain gasoline supplies to his citizens after Hurricane Ida shut down several refineries. I was even more impressed that the citizens evidently listened and panic buying was not a problem. Crucially, in my judgment, Governor Edwards often emphasized local buffer stocks, cycle time distribution realities, and a credible duration calendar.

+++

I have been absent without leave again — and I expect this to continue into March. Real-time demand for face-to-face communication is constraining my time for research and writing. I apologize.