Month: August 2022

Jackson Mississippi water system

The Mississippi Emergency Management Agency is providing ongoing updates on the response to the Jackson water crisis. See below for related summaries and updates.

+++

Upstream Sourcing: Water is sourced from the Pearl River, Ross Barnett Reservoir (just northwest of the city, see map below), and six wells drawing on the Sparta Aquifer. The Pearl River typically flows through Jackson at a depth of under ten feet. Flooding that began on August 22 reached over thirty-five feet on August 29. This morning (August 31) the river level continues to be above thirty feet.

Upstream Processing: Water is treated for safe consumption by Jackson residents at the J.H. Fewell plant (originally constructed in 1908 to draw on the Pearl River) (more and more) and the O.B. Curtis plant, originally built in the late 1980s to draw on the Ross Barnett Reservoir (more and more). Each well also injects chemical treatments.

Midstream Distribution: Pumping is required to feed the distribution network. Some primary pumps failed well before the last several days of flooding. Backup pumps failed on Monday, August 29, according to some reports. [There are conflicting reports on the location and cause of pump failures.] Water towers are not being consistently refilled. Flooding combined with aging infrastructure has exacerbated leaks and breaks in water mains. The related loss of water pressure has reduced network flow by at least forty percent. The current quantity and quality of distributed water is insufficient to serve the population.

Downstream Consumption: The water system has been operating with a boil order since July 29 due to quality concerns (more and more and more). Because of the flood-related processing and distribution issues outlined above, early this week the Governor of Mississippi, explained, “we do not have reliable running water at scale… It means the city cannot produce enough water to fight fires, to reliably flush toilets, and to meet other critical needs.” According to Mississippi emergency management officials, 10 tractor trailer loads of drinking water arrived Tuesday and 108 more truckloads are en route. More than 160,000 water consumers are impacted. On August 30, President Biden declared an emergency and directed FEMA, “to coordinate all disaster relief efforts which have the purpose of alleviating the hardship and suffering caused by the emergency on the local population, and to provide appropriate assistance for required emergency measures, authorized under Title V of the Stafford Act, to save lives and to protect property and public health and safety, and to lessen or avert the threat of a catastrophe in Hinds County.”

Very Preliminary Strategic Assessment: While Lake-Mead-like events are an increasing threat (more), sourcing is not the most common cause for supply chain challenges. As in Jackson sourcing can be both abundant and redundant, problems should still be anticipated.

Especially for significant concentrations of demand, flows usually depend on concentrated processing and/or distribution. The two water processing plants serving Jackson are obvious critical nodes. Such nodes usually host a set of interdependent functional bottlenecks. Pumps are an example — as are grid connections, chemical supplies, competent personnel, and much more. [The August 30 Mississippi EMA Incident Command Brief specifically calls out, “Both O.B. Curtis and J.H. Fewell water treatment plants lack sufficient Class A Operators and maintenance staff.”] Bottlenecks can become chokepoints. Especially for “significant concentrations of demand” (aka lots of people), restored functionality of preexisting bottlenecks is almost always the only sustainable, practical solution.

In many cases, extended stress eventually prompts an amplified shock (more). Since at least 1980, the city of Jackson has experienced a steady decline in population, from just over 200,000 then to just under 150,000 today (more and more). Roughly one-quarter of the city’s residents meet the federal definition for living in poverty. The median household income is $40,000, compared to a national median of over $67,000. The ability to pay for a wide range of city services, infrastructure maintenance, and anticipatory adaptation has seriously degraded overtime. Jackson is not unique in this regard.

September 1 Update: According to the August 31 Incident Command Brief pumping has resumed — and surged — at the J.H. Fewell plant (more). A new backup pump has now been installed at the O.B. Curtis plant. Total volumes remained about forty percent below normal most of Wednesday. Pressure of about 87 pounds per square inch is needed for optimal flows. On August 31 40 PSI was measured in many locations. Most elevated water towers are reported to be nearly drained. Some improved system pressure is anticipated by this morning. Distribution of bottled drinking water and bulk water is expanding.

September 2 Update: According to the September 1 Incident Command Brief as of 1800 Central Time on September 1, water volume was close to 57 percent of authorized network capacity. An average pressure of 74.3 pounds per square inch was being measured for the full network. Achieving 87PSI has been the goal. Last evening at least one elevated water tank remained empty, a second was almost empty. There are ten tanks serving the surface water system, all are considerably less than full. There are three elevated tanks serving the well system. I don’t know about the ability of the Jackson water system to sequester pressure zones. Pressure usually builds overnight as (– if) usage declines. Reestablishing the network’s volume and pressure will restore sanitary and fire-suppression capacity. A fully pressurized system also reduces the risk of water contamination. Long before the recent flood-related shocks, Jackson’s water system has experienced serious challenges maintaining minimum drinking water standards. Human hydration will require continued boiling and distribution of bottled water until the preexisting network is restored to close to full capacity — both in terms of quantity and quality. Friday afternoon update: The mayor of Jackson reports that discharged water from the O.B. Curtis plant has now achieved 80PSI for a sustained period. Six of the tanks serving the surface water system are now at a sufficient level to support system-wide pressure and progress is being made with the remaining. The mayor is now concerned that higher pressures may increase the number of pipe ruptures.

September 3 Update: The most recent Incident Command Brief suggests an improved ability to sustain progress on building water volumes and pressure, but continued challenges with intake and pumping capacity at the O.B. Curtis plant.

September 4 Update: Sounds like there was significant progress yesterday (Saturday). According to the Incident Command Brief volumes discharging from O.B. Curtis are increasing. Last night total flows were equivalent to 63 percent of authorized system capacity. Systemwide pressure is reported at just over 80PSI. Most elevated towers have achieved a sufficient level to sustain pressure. Barring a new disruption (not impossible), towers should have further filled overnight. If the current PSI can be maintained, priority can shift from water quantity to quality… which in any case has also been receiving attention. Current conditions substantially enhance sanitary and fire suppression capacity. Water quality issues long preceded the current crisis. (More and more and more).

September 5 Update: Volume and pressure are now sustainably restored. Intake, discharge, pumping, and tower levels are now sufficient to supply demand. So far the distribution network has mostly maintained its integrity. Water quality remains insufficient for safe human hydration. (Here and here and here and here).

September 6 Update: Progress continues on maintaining quantity and improving quality. Further information here and here and here.

On September 15 at 1:00PM Central Time the boil order in place since July 29 was rescinded. Further information here and here and here.

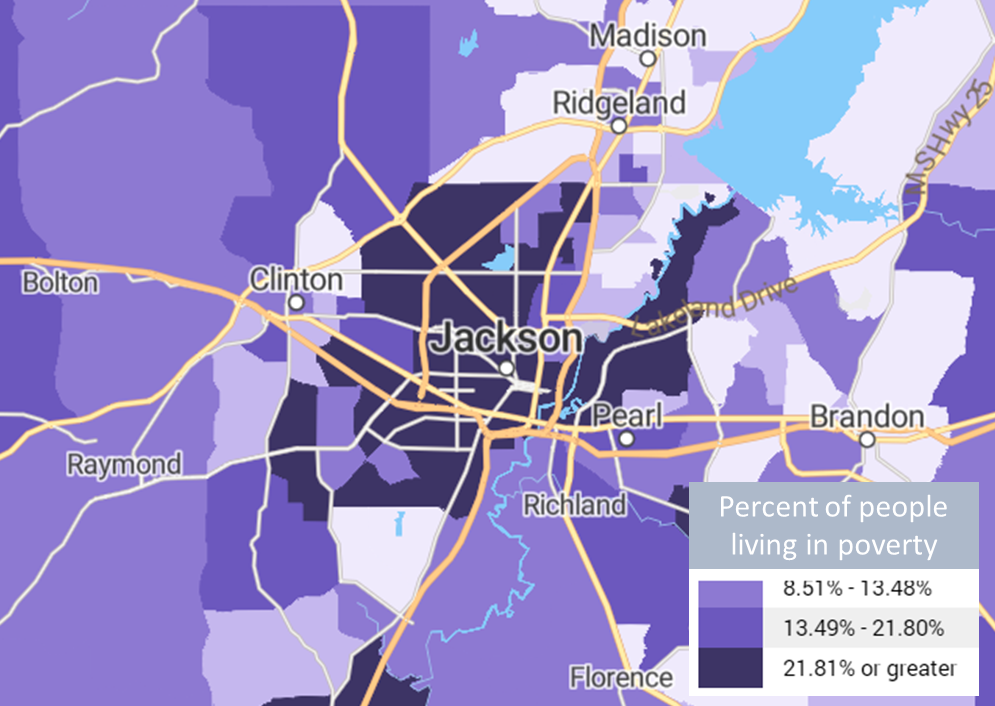
Map generated by PolicyMap based on 2020 Census

Today’s discount, tomorrow’s tragedy

In the near-term — such as the next eight weeks — there are risks to supplies of refined fuels serving US demand, especially in the Northeast. Current diesel inventories in New England and Central Atlantic are anemic. And every hurricane season, there is some risk that a major hit in the wrong place could disrupt highly concentrated Gulf Coast refining and distribution capacity, which is the principal source of supply for the East Coast.

In the mid-term — such as the next eight months — there are risks to supplies of energy serving European demand. Reduced fossil fuel flows from Russia have increased demand (and prices) for energy from elsewhere including the United States. There are some comparatively mild forecasts, but winter is coming. Major efforts to build inventory are underway (more). But mid-winter resupply will be much less predictable — much more liable to disruption — than in the recent past. Energy-related economic, social, political, and national security risks are rising… and not just for Europe (here and here and here and here and here).

In the long-term — such as the next eight years and more — there is a risk of accelerating climate change. According to an IPCC Special Report, “Without increased and urgent mitigation ambition in the coming years, leading to a sharp decline in greenhouse gas emissions by 2030, global warming will surpass 1.5°C in the following decades, leading to irreversible loss of the most fragile ecosystems, and crisis after crisis for the most vulnerable people and societies.” Reducing the use of traditional fossil fuels is an important element in “increased and urgent mitigation.”

These risks are related (I trust this is not a surprise). Because of long-term risks related to continued use of fossil fuels, fewer investments have been made overtime in maintaining, much less expanding legacy energy sources. Since 1992 over ninety US refineries have permanently closed (more). This has removed more than 6 million barrels per calendar day of capacity. US refining capacity is now more concentrated and, often, farther removed from demand than ever before.

As a result, near-term risks of US supply disruptions are higher than ever before, especially for places like New England and the mid-Atlantic that are far away from major sources of supply. There have been times when a mismatch in the Northeast’s supply and demand has attracted European — often Russian — refined product across the pound. This is much less likely to happen this winter. One of the reasons New England and Central Atlantic inventories are underwhelming is because Europe needs so much more from the US to replace what is not coming from Russia. The pull of high prices is attracting US diesel inventories to push outward toward Rio or Rotterdam or wherever the price is highest (here and here).

In an August 18 letter to several leading US refiners, the US Energy Secretary tries to counter the pull of higher prices. She wrote, “Given the historic level of U.S. refined product exports, I again urge you to focus in the near term on building inventories in the United States, rather than selling down current stocks and further increasing exports” (more and more). The threat of hurricane season was specifically referenced. In effect, the US energy secretary is arguing that the global diesel market is under-estimating the risk of hurricane season. The diesel price at New York Harbor ought to be higher. Well… maybe she is not saying that, given the risks of domestic inflation and related political risks. But pricing is how markets resolve risk differentials. [Increasing the risk of sky-high fuel prices will probably minimize actions to limit US exports.]

Markets are not infallible. Markets should not be our only risk-management method. But for other methods to equal or exceed the power of markets great clarity is needed. For too long humans discounted the risk of climate change. Now that climate change is belatedly, reluctantly, and inconsistently acknowledged by most, we have tended to discount the risk involved in making the energy transition required to mitigate climate change.

For too long many discounted the risk of Putin’s authoritarian hubris. Even with plenty of prior examples, troops massing, and pseudo-historical justifications for invasion on offer, Europe increased its dependence on Russia’s energy.

All of these risks have been discounted largely because positively engaging such “uncertainty” has seemed too expensive. As my father often says, “You get what you pay for.” My grandfather said, “The customer will forget about prices, but will never forgive poor quality.” [There is increasing evidence that my grandfather’s once-upon wisdom has now been overcome by events.]

What we have paid for is tightly constrained capacity that is sufficient to meet typical US demand and help close the gap elsewhere, as long as disruption or destruction does not hit the wrong place too hard. If a CAT-4 or 5 hurricane or earthquake or cyberattack or fire or a long list of other threats takes down the wrong place for long enough, even maximum seasonal inventories will not be enough to avoid cascading pain. This combination of high prices and poor quality suggests our previous discounts were delivered with hidden time-bombs.

TARA is a nice summary of our risk management options: We can Transfer, Avoid, Reduce or Accept risk. Discounting and denial are other words for accept.

+++

August 31 Additional Comment: More than one reader has complained about the title for this post. “Strained alliteration.” “Hyperbole.” “A better choice would have been Today’s discount, tomorrow’s expense.”

Thank you. This feedback is helpful. Recently I have been leaning into snarky or cynical. I will work to straighten up.

I will also offer that for me a true tragedy requires a heroic character to make self-subverting choices. Tragedy is not just a terrible event, it is the consequence of good intentions gone seriously awry.

July Personal Consumption Expenditures

This morning’s July report suggests a largely unchanged consumption glidepath. Nominal consumption increased 0.1 percent from June. Inflation adjusted consumption was up 0.2 percent. (See first chart below.)

While many discretionary expenditures (e.g., non-durable goods) have flattened or fallen, other factors — such as shelter costs — are keeping consumption historically high. The Bureau of Economic Analysis notes, “The $23.7 billion increase in current-dollar PCE in July reflected an increase of $33.3 billion in spending for services that was partly offset by a decrease of $9.6 billion in spending for goods. Within services, the largest contributors to the increase were spending for housing and utilities (mainly housing) and for “other” services (mainly international travel). Within goods, gasoline and other energy goods was the leading contributor to the decrease.” (More and more.)

Fairly steady durable goods spending and reduced spending on food-at-home and non-durable goods means production and distribution capacity has mostly caught-up with increased demand. It is, however, helpful to acknowledge how much higher demand remains. In terms of chained 2012 dollars, in July 2019 total consumption was $13,161 billion. Last month US consumers spent $13,959 billion. That’s about double any previously encountered rate of change, with even higher and volatile rates in between.

Two months ago, based on PCE patterns percolating in the May report and prior, I attempted a prediction:

I hypothesize that between May and September we will see food-at-home real consumption gradually decline by another seven to ten percent and then flatten or incrementally increase. I hypothesize that durable goods and services will begin to show slopes similar to 2022 food consumption. I also hypothesize a more rapid rate-of-change than that for food between last November and April. These are deniable hypotheses. I am not sure. It does seem plausible. If this happens, demand and supply will be closer to equilibrium.

So far my hypothesis for food seems to be happening (see second chart below), even if at the low end of — or below — my guess (more). Given June and July PCE results, it is almost time to acknowledge I was wrong on durable goods and services. I was expecting durable goods to continue (and accelerate) its April-to-May decline in consumption. I expected services to be supported by summer spending, I did not expect a sustained decline before September. But the consistent increase in real service spending is stronger than I anticipated. Batting 300 is only good in baseball.

Freeport: Sturgis redux?

Yesterday Freeport LNG announced another delay in restarting their Texas facility. Shut-down since a June 8 explosion, flows had originally been expected to resume in September, but based on regulatory action had then been delayed until October. (See text of action by Pipeline and Hazardous Materials Safety Administration.)

According to a news release, “Although typical construction risks could impact the recovery plan, it is anticipated that initial production can commence in early to mid-November, and ramp up to a sustained level of at least 2 BCF per day by the end of November, representing over 85% of the export capacity of the facility. The recovery plan will utilize Freeport LNG’s second LNG loading dock as a lay berth until loading capabilities at the second dock are reinstated in March 2023, at which time we anticipate being capable of operating at 100% of our capacity.” (More)

Yesterday, before the Freeport LNG announcement, benchmark European LNG futures prices for November deliveries hit a new all time high (see chart below). Recent turmoil in the European natural gas market can claim many mothers and fathers, but a big part of the most recent price rise reflects Friday’s announcement by Gazprom that the Nordstream 1 pipeline will suspend flows from August 31 to September 2 for previously unscheduled maintenance.

US natural gas prices fell yesterday reflecting the continued constraint on export capacity (more and more), Freeport typically accounts for about 15 percent of US LNG exports. As of this morning, global natural gas prices are still churning as implications are played out on 3-D chess boards worldwide (here and here). Prices may be approaching the point of demand destruction.

European natural gas inventories — critically important for this winter — currently stand at almost 78 percent. Pretty good for a normal August. But this is an abnormal August worried about a potentially surreal mid-winter (more and more and more).

So… I hope I am not the only one who is cautiously comparing PHMSA actions at Freeport to FDA action at Sturgis (here and here and here). In each case there were (are) real safety risks justifying regulatory interventions. In regard to the Abbott production plant at Sturgis there was also failure to fully anticipate the implications of an extended shutdown.

Fortunately, the flow capacity concentrated at Freeport — while significant — is no more than half that concentrated at Sturgis… and depending on what you count as replacement flows, even less. Replacement flows for Sturgis were also tightly constrained by various government import and procurement policies. Natural gas operates in a much more open market with much higher volume flows. Comparing natural gas to specialty formula is not an easy apple to apple market comparison.

But in terms of risk management, the analogy may be more like-to-like. There are many good reasons for an FDA or PHMSA action to be narrowly framed in terms of existing statutory and regulatory authorities. There are many good reasons to ensure that specific safety issues not be complicated by more ambiguous economic or, especially, political issues. There are many good reasons for private sector engineers and lawyers to cooperate with narrowly targeted safety regulations.

I also remember in late March when I received my first call from a senior federal official worried about the downstream implications of the shutdown at Sturgis. He seemed surprised when I outlined limited options: restart, import, or empty shelves. I did not notice this surprise motivating many changes for another four weeks or more. By then shortages of specialty formulas were, in some cases, life-threatening.

I hope the professional expertise of PHMSA staff is deep and respected. I hope their peers at Freeport LNG are competent and fully committed to safe operations. I also hope USDOT Senior Executive Service staff and/or the right Deputy Assistant Secretary and/or a thoughtful National Security Council staffer are asking for regular updates and communicating downstream implications. While I want the safety inspectors to be able to stay in their lane, I also want others to fully engage how that lane connects to flow of LNG to Europe and the strategic implications of containing Putin’s aggression.

Dutch TTF Gas Futures for November Euro cents per megawatt hour

Black Sea berths

The trickle of agricultural exports leaving three Ukrainian ports has continued. Sailings include not just those ships trapped since February, but new ships arriving to receive new loads. That new ships have arrived so soon surprises me. It is further evidence of the power of effectual demand — even in the midst of very high risk (more and more and more and more).

There is now a sufficient flow that according to S&P, “The Black Sea dry bulk shipping markets have resumed spot trading as the Ports of Odessa and Yuzhny saw an influx of spot grains cargo inquiry into West Africa and the Mediterranean… On a time-charter basis, one Supramax near Algeria was reported to be asking $30,000/d for a trip via the Black Sea, with redelivery in the Mediterranean. By comparison, similar ships were asking between $15,000/d and $20,000/d for similar duration trips in the North Sea.”

Flows of Ukraine’s grain, fertilizer, sunflower oil, and more nonetheless remain constrained and disrupted. According to Reuters and Ukrainian officials, “Agricultural exports between Feb. 24 and Aug. 15 this year fell to 10 million tonnes from around 19.5 million in the same period last year.” Half full is also half empty, but better than even less.

Below are recent views of Black Sea channel flows (updated map here). Based on very irregular monitoring, I seem to see a steadily increasing number of ships gathering in the “Southern Waiting Area” east of Constanta (Romania) before moving north into the corridor that connects with berths at Odesa, Yuzhny, and Chornomorsk (more).

Big picture: Resilience diagnosis and prescription

[Update Below] Resilience implies problems. We spring back from adversity. The more rapid and complete a recovery from hard hits, the more resilient a system’s character. In recent years there have been plenty of serious supply chain problems. In most cases and places, supply chains have demonstrated significant resilience.

The Coronavirus Pandemic continues to stress global networks of demand and supply. Thirty months of disruption (and counting) demonstrate that concentrated push capacity plus pull patterns plus distance matter most. The war in Ukraine has reinforced these insights (here and here and here).

When pull — demand — can be effectively expressed, push is persistent and creative in response (e.g., US grocery sector). When and where pull is silenced or diminished or comparatively disadvantaged, push will rapidly dwindle (e.g., Lebanon or Sri Lanka or low income US neighborhoods).

High volume, high velocity, affordable push typically depends on highly concentrated sources and channels. We build purposeful bottlenecks (e.g., processing plants and ports and Distribution Centers and roadways) sized and organized to serve existing and predicted pull. During the pandemic most of these concentrations have adapted more effectively than I expected given dramatic shifts in demand. Except when destruction, disruption, or congestion seriously complicated preexisting flow (e.g., decommissioned power plants, blockaded Black Sea ports, cramming more than is discharged into almost anyplace). The best bottlenecks can quickly become dangerous chokepoints.

The more distance between concentrated demand and concentrated supply, the more risk of push not matching pull. Early in the pandemic most of the planet’s Personal Protective Equipment was (still is) made in a comparatively few facilities 5000 to 7000 miles away from significant concentrations of demand. Production and shipping capacity was constrained (see prior paragraph) and distance amplifies any mismatch of supply with demand. Today the price and availability of non-Russian natural gas in Europe is impacted by this distance amplifier (more and more and more).

The pandemic has also demonstrated the fantastic potential of private-public partnerships to create new production capacity to fulfill new demand (e.g., vaccinations, especially mRNA vaccines). The public sector essentially expressed persuasive demand and private sector small-batch innovations were rapidly scaled.

All in all, a pretty positive big picture, right? Could certainly be worse.

And… there is cause for concern. The pandemic has been a slow-onset catastrophe. The war in Ukraine has been a slow-onset crisis. Climate-related disasters seem to be accelerating, but have been predicted for at least half my long life. I am concerned there is a tendency to discount the difference between slow and fast onset catastrophes.

I am also concerned we discount the difference between destructive events and disruptive events. The pandemic has been very disruptive, but the power grid and communications and fuel supplies and road networks and other key infrastructures have continued to function.

I am concerned that many of our most valuable pandemic lessons are poorly calibrated with fast-onset, destructive risks, such as very high magnitude/intensity earthquakes or any high energy kinetic force (e.g., hurricane, tsunami, flood, fire, nuclear… ) that hits the right (wrong) concentration. A Category 5 hurricane with storm surge whipsawing the northwest Gulf of Mexico next month could cut off US LNG exports to Europe preparing for war-time winter. The East Coast could lose almost half of its ordinary supply of refined product flowing through the Colonial and Plantation pipelines. One-fifth to one-third of US fuel capacity might be offline for weeks. Talk about a mismatch of push and pull. Talk about supply-driven inflation. How much food or pharma or other crucial flows might just stop?

The pandemic’s non-destructive, comparatively slow-onset character has reinforced perceptions of potential control that are not well-suited for fast-onset, destructive events (and tend to discount crucial failures of pandemic response as well). In mid-February 2020, we could confidently predict there was at least five weeks before trans-Pacific flows to the United States would be seriously impacted by the epidemic then sweeping China. (I don’t think we did much with that insight, but the prediction was accurate.)

In the aftermath of a worst-case Cascadia or San Andreas earthquake, millions of survivors will suddenly be separated from moments-before sources of water, food, fuel, and much more. Major freight corridors will be down for the count and alternative sources of supply will be far away. Rather than five weeks, the impact will be immediate. A workable solution will be needed inside five days.

This “workable solution” cannot be planned in any detail. Precisely how a catastrophic kinetic event will unfold is beyond prediction.

As a result, effective responses are more likely to emerge from exploratory adaptations than centrally directed instructions. It was tough enough to deliver millions of doses of vaccines from known points of origin to well-communicated points of destination even with a few months of stand-up time. How do you facilitate creative emergence in the absence of grid power, telecommunications, and several bridges?

A strategic capacity for an effective rapid response is enhanced by a meaningful comprehension of core functions of preexisting demand and supply networks. Knowing the principal places and players for a high proportion of preexisting flows can inform quick and helpful after-impact assessments and potential mitigation measures. Many details of preexisting flows will not survive a catastrophic hit. But recognizing which major concentrations did or did not survive tees-up real-time options and choices.

Even more important are effective collaborative relationships between owners/operators of these core functions and between these owners/operators and emergency management. These players’ actions will decide the network’s resilience (or not). This kind of preparedness — very much focused on relationship-building, conversation, and discovery learning — puts in place the potential for creative problem-solving between preexisting competitors and between the private and public sectors.

But rather than “meaningful comprehension”, I see recurring attempts to trace and direct black-sky flows with greater detail and fidelity than most large scale blue-sky systems. Rather than authentic questions and conversations, I encounter instructional workshops. Rather than discovery learning there is a proliferation of command-and-control frameworks and pre-scripted task orders and DPA rated-orders.

I am slack-jawed and often silent because I do not second-guess the good intentions and hard work involved, but I am reminded of the admonition, “vanity of vanities, all is vanity.” Complex networks are tough enough to track on the best days. Effective flow depends on myriad independent agents each doing their part — often more than their part — to midwife the network’s potential emergence. Especially on the worst days, humility, risk-taking, encouragement, trusting, and cooperation become very practical virtues. One-hundred plus page plans and almost-as-many PowerPoint screens do not cultivate these virtues. Such outputs often distract from building real relationships.

A few weeks ago I was in conversation with some leading US food and freight providers. In case of a fast onset, wide-area, time-extended catastrophe these key players said that their ability to keep flows going would be enhanced by receiving the following “Big Picture” from a credible, competent source:

  • Infrastructure status including grid and telecommunications recovery timelines
  • Transportation networks including bottlenecks, chokepoints, availability of trucks, vans, pallets, and related assets
  • Fuel networks including availability, accessibility, transaction capabilities, and resupply
  • Labor availability including approved access (e.g., in case of perimeters or curfews), priority access to fuel when necessary, and support for non-local supplementary personnel
  • Demand dynamics including where purchases are (and are not) happening, how purchases are being transacted, comparative flow, and identification of most vulnerable places.

For more than a decade I have heard similar folks ask for similar help. In Southern California, San Francisco Bay Area, Pacific Northwest, Florida, and the mid-Atlantic, the biggest providers of food, fuel, pharmaceuticals, and other crucial freight have identified the same essential needs. Again and again, I hear them saying, “We know ourselves and our capabilities pretty well. But we need help with the Big Picture, especially when the Big Picture has suddenly changed. Give us confidence in the Big Picture and we will be creative finding solutions.” They offered to contribute their local observations to constructing the Big Picture. They also want to have a speed-dial connection for intergovernmental troubleshooting in case of conflicting priorities.

But there is — so far — no sustained effort to provide these owners/operators with the strategic insight they have requested. There is no sustained effort to organize the key players that are the usual suspects for up to 80 percent of total flows for food and fuel in large risk-prone regions. There is small-talk at conferences and workshops. There are irregular tactical encounters. There is no continuity to foster ongoing, purposeful, operationally meaningful, strategically effective relationships.

Why not?

Because humans discount catastrophic risk. Because we prefer delusions of control rather than realities of randomness. Because we are already busy with the pressing demands of today. Because we are easily distracted from long-term investments by near-term activity traps. Because choosing between priorities involves uncertain rewards and possible penalties. Because relationships are hard and dependent relationships are especially difficult. Because in a catastrophic context our interdependencies loom large. Because crises highlight our shared limitations and vulnerabilities. Because most of us are reluctant to depend on the competence and care of others. Because many — most? — humans dislike uncertainty.

If this is an accurate diagnosis, then the therapeutic response is clear enough. But as the pandemic (and more) has demonstrated, many are ready to neglect or even reject their medicine.

+++

August 24 Update: About the same time as I was posting what’s above, a team at McKinsey & Company published a meaningful contrast. Two days later (this morning) I received a link to: The History and Future of US Crisis Management. The McKinsey team is focused on disasters, I am focused on catastrophes. They give some attention to private sector roles, but clearly conceive the public sector as being in the lead. In regard to Supply Chain Resilience, I argue the private sector is the only source with capacity to serve millions of survivors. The McKinsey essay describes crisis management in the United States as it is or aspires to become. I am complaining that these aspirations will not be sufficient when the predictable surprise of a worst day arrives.

US retail sales and savings

July retail sales — both nominal and real — continued to be strong. The Wall Street Journal summarized:

Overall retail sales—a measure of spending at stores, online and in restaurants—were flat in July compared with the prior month’s revised 0.8% increase, the Commerce Department said Wednesday. But a measure of spending that strips out gasoline and auto sales rose 0.7% last month from June, showing shoppers maintained the ability to spend with much of the spending moving online.

In July 2019 US consumers spent $453,667 million on retail goods and services. Last month we spent $596,765 million, slightly more than ever before. Even when adjusted for inflation, retail sales are more than 13 percent higher than an entirely prosperous — and low inflation — mid-summer 2019 (see first chart below).

How are we doing this? We are saving less of our income (see second chart below) and we are spending down savings some of us accumulated early in the pandemic (more). I suspect that this spending spree is encouraged by a combination of pandemic-induced pent up demand and strong employment (there are now about 1.6 million more employed than in July 2019). Wages have also been increasing (more), if not keeping up with inflation. (Is this about to change?)

The demand surge that started in early 2021 mostly explains last year’s acute supply chain challenges (more). The persisting high rate of demand — and mismatch with production/distribution capacity — mostly explains inflation.

US domestic freight flows

I just completed a 2000 mile road-trip. Truck traffic seemed strong, especially at Indianapolis (major road construction undoubtedly amplified that observation). I can confirm that Lexington KY loads and flows circling Cincinnati are impressive (lots of activity at the nearly one-year-old Amazon hub).

Demand for stuff has moderated (I agree), but it remains plenty strong. July shipment numbers are almost identical to July 2021 and 2019. In 2020 flows were still early in recovery. In July 2018 we were just past an unusually high peak. More people are now employed in trucking than ever before. The number of warehouse workers soared through this Spring and has been mostly stable since.

Diesel is still expensive, but is well-off its mid-June peak.

This Spring the freight market went through another transition: shifting consumer demand and swiftly rising fuel prices seemed to threaten capacity-shedding (more). Some trucking firms closed. I was worried. But adaptation happened (more and more and more). By early July I was telling clients that third quarter freight capacity would mostly be well-balanced between demand and supply. Half-way through, that forecast has (so far) unfolded. Below is Freightwaves’ national Outbound Tender Volume Index showing changes between the first and second weeks in August. Pretty placid.

Given fertile sources of volatility, I have no confidence regarding the fourth quarter or beyond… but for now and the near-term we are making clean, dry hay… most of the time in most places.

Flows: better but not balanced

Disruptions, disconnections, delays, surprising demand, congestion, and confusion are supply chain constants. Minimizing and mitigating mismatched pull with push is what supply chain managers do. So do production line workers, DC selectors, truckers, and retailers… day after day, even minute-by-minute.

War (and rumors of war), natural disasters, and pandemics can create especially dramatic complications. Recent collisions of all three (plus more) certainly have had consequences. Yet flows have continued. According to some measures, push is now much better aligned with pull.

Here is one angle of measurement focused on US supply chains:

The Logistics Managers’ Index reads in at 60.7 in July, down (-4.3) from June’s reading of 65.0. This is the lowest reading since May of 2020 and the second consecutive reading below the all-time index average of 65.3. While this does still represent a healthy rate of expansion in the logistics industry, it is a far cry from March when the index hit an all-time high reading of 76.2. As is often the case, transportation metrics are the driving force behind this shift. Transportation Prices read in at 49.5 in July. While this is very close to no movement month-to-month, with a reading under 50.0 we have crossed the Rubicon into a state of contraction for the first time since May of 2020. Fueling this deflationary pressure are levels of growth in available Transportation Capacity (reading in at 69.1) that we have not seen since April of 2019. Interestingly, the downshifts we observed in transportation metrics were much more muted in the last week of July (as we will discuss below), leaving open a possibility for a bit of recovery as we move towards peak season. Warehousing and Inventory metrics continue to buoy the logistics sector. Inventory Levels remain high (and are responsible for dragging down U.S. GDP in the second quarter), and warehouses continue to struggle to hold and manage the volume.

Below is a chart reflecting a second angle of measurement for global supply chains. According to the principal researchers at the New York Federal Reserve:

  • Global supply chain pressures declined in July, continuing the easing observed over the past two months.
  • The July decline was uniform across most of the subcomponents of our index.
  • The moves in the GSCPI from the beginning of 2022 suggest that although global supply chain pressures have been decreasing, they remain at historically high levels.

Current constraints include rigorous counter-covid policies in China. The planet’s second largest economy shrank in the second quarter. (Yet China’s exports to external demand have remained strong.) There are stubborn constraints on global fossil fuel production capacity (more and more and more) and US refining capacity is very tight. This blog has given recurring attention to serious challenges with food flows, both US domestic and global (here and here and here). While there is still plenty of food and fuel flowing, prices have increased and the most price-constrained consumers are struggling to pull what they really need. According to many of the world’s shippers and carriers a combination of persistent demand, volatile demand, and resulting congestion of flows is keeping freight costs elevated.

There is a wider recognition now than thirty months ago of the ebb and flow of demand and supply. It is more fully undertood that the beautiful bottlenecks built to enhance flow velocity can suddenly become ugly chokepoints cutting off supply. The Suez Canal can be blocked. Pipelines can be turned off. Ports can back-up. There are real reasons for worry and motivaton to continue minute-by-minute, day-by-day, practical and principled and strategic steps to reduce risks, such as those suggested in the map below.

July food inflation persists

While the headline and core numbers moderated (see chart below), food inflation continues to hurt. Here is the complete CPI blurb for food from this morning’s Bureau of Labor Statistics report:

The food index increased 1.1 percent in July; this was the seventh consecutive monthly increase of 0.9 percent or more. The food at home index rose 1.3 percent in July as all six major grocery store food group indexes increased. The index for nonalcoholic beverages rose the most, increasing 2.3 percent as the index for coffee rose 3.5 percent. The index for other food at home rose 1.8 percent, as did the index for cereals and bakery products. The index for dairy and related products increased 1.7 percent over the month. The index for meats, poultry, fish, and eggs rose 0.5 percent in July after declining in June. The index for fruits and vegetables also increased 0.5 percent over the month. The food away from home index rose 0.7 percent in July after rising 0.9 percent in June. The index for limited service meals increased 0.8 percent and the index for full service meals increased 0.6 percent over the month.

The food at home index rose 13.1 percent over the last 12 months, the largest 12-month increase since the period ending March 1979. The index for other food at home rose 15.8 percent and the index for cereals and bakery products increased 15.0 percent over the year. The remaining major grocery store food groups posted increases ranging from 9.3 percent (fruits and vegetables) to 14.9 percent (dairy and related products).

The index for food away from home rose 7.6 percent over the last year. The index for full service meals rose 8.9 percent over the last 12 months, and the index for limited service meals rose 7.2 percent over the last year.