Disruptions, disconnections, delays, surprising demand, congestion, and confusion are supply chain constants. Minimizing and mitigating mismatched pull with push is what supply chain managers do. So do production line workers, DC selectors, truckers, and retailers… day after day, even minute-by-minute.
War (and rumors of war), natural disasters, and pandemics can create especially dramatic complications. Recent collisions of all three (plus more) certainly have had consequences. Yet flows have continued. According to some measures, push is now much better aligned with pull.
Here is one angle of measurement focused on US supply chains:
The Logistics Managers’ Index reads in at 60.7 in July, down (-4.3) from June’s reading of 65.0. This is the lowest reading since May of 2020 and the second consecutive reading below the all-time index average of 65.3. While this does still represent a healthy rate of expansion in the logistics industry, it is a far cry from March when the index hit an all-time high reading of 76.2. As is often the case, transportation metrics are the driving force behind this shift. Transportation Prices read in at 49.5 in July. While this is very close to no movement month-to-month, with a reading under 50.0 we have crossed the Rubicon into a state of contraction for the first time since May of 2020. Fueling this deflationary pressure are levels of growth in available Transportation Capacity (reading in at 69.1) that we have not seen since April of 2019. Interestingly, the downshifts we observed in transportation metrics were much more muted in the last week of July (as we will discuss below), leaving open a possibility for a bit of recovery as we move towards peak season. Warehousing and Inventory metrics continue to buoy the logistics sector. Inventory Levels remain high (and are responsible for dragging down U.S. GDP in the second quarter), and warehouses continue to struggle to hold and manage the volume.
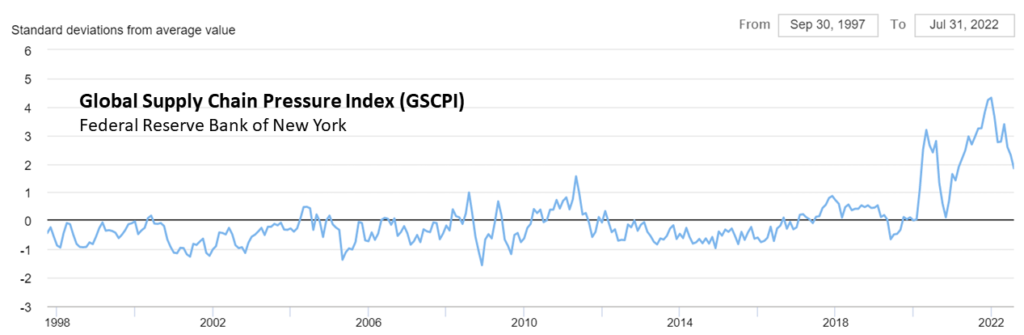
Below is a chart reflecting a second angle of measurement for global supply chains. According to the principal researchers at the New York Federal Reserve:
- Global supply chain pressures declined in July, continuing the easing observed over the past two months.
- The July decline was uniform across most of the subcomponents of our index.
- The moves in the GSCPI from the beginning of 2022 suggest that although global supply chain pressures have been decreasing, they remain at historically high levels.
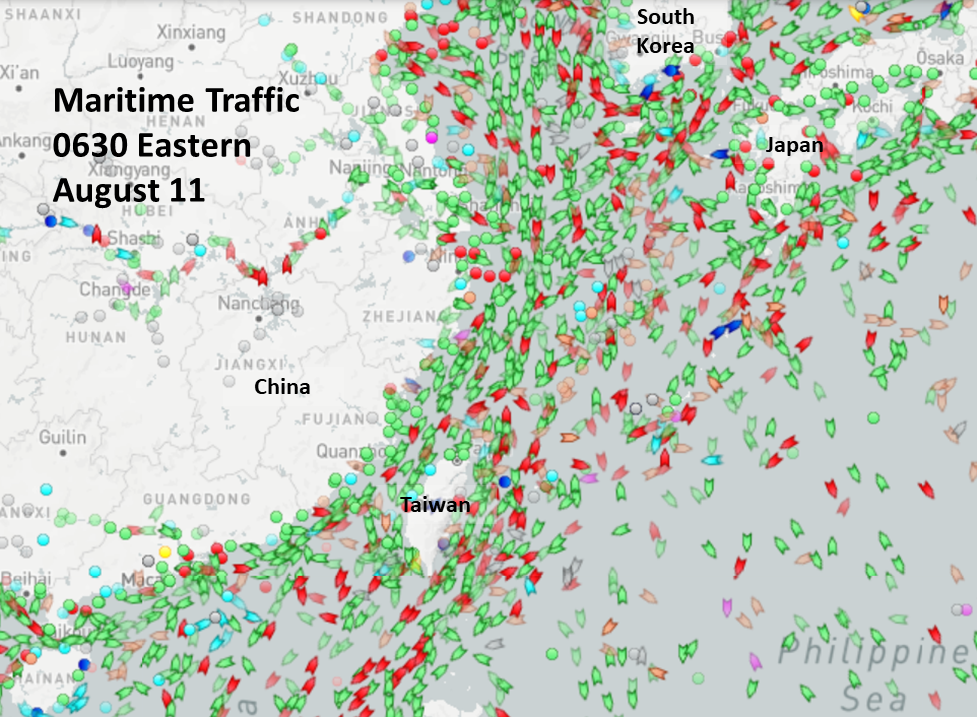
Current constraints include rigorous counter-covid policies in China. The planet’s second largest economy shrank in the second quarter. (Yet China’s exports to external demand have remained strong.) There are stubborn constraints on global fossil fuel production capacity (more and more and more) and US refining capacity is very tight. This blog has given recurring attention to serious challenges with food flows, both US domestic and global (here and here and here). While there is still plenty of food and fuel flowing, prices have increased and the most price-constrained consumers are struggling to pull what they really need. According to many of the world’s shippers and carriers a combination of persistent demand, volatile demand, and resulting congestion of flows is keeping freight costs elevated.
There is a wider recognition now than thirty months ago of the ebb and flow of demand and supply. It is more fully undertood that the beautiful bottlenecks built to enhance flow velocity can suddenly become ugly chokepoints cutting off supply. The Suez Canal can be blocked. Pipelines can be turned off. Ports can back-up. There are real reasons for worry and motivaton to continue minute-by-minute, day-by-day, practical and principled and strategic steps to reduce risks, such as those suggested in the map below.