Month: July 2022

Food consumption: summer diets?

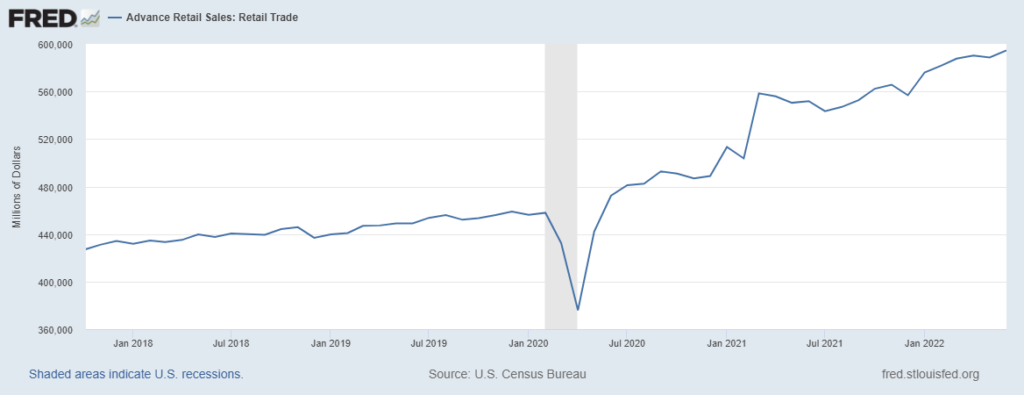
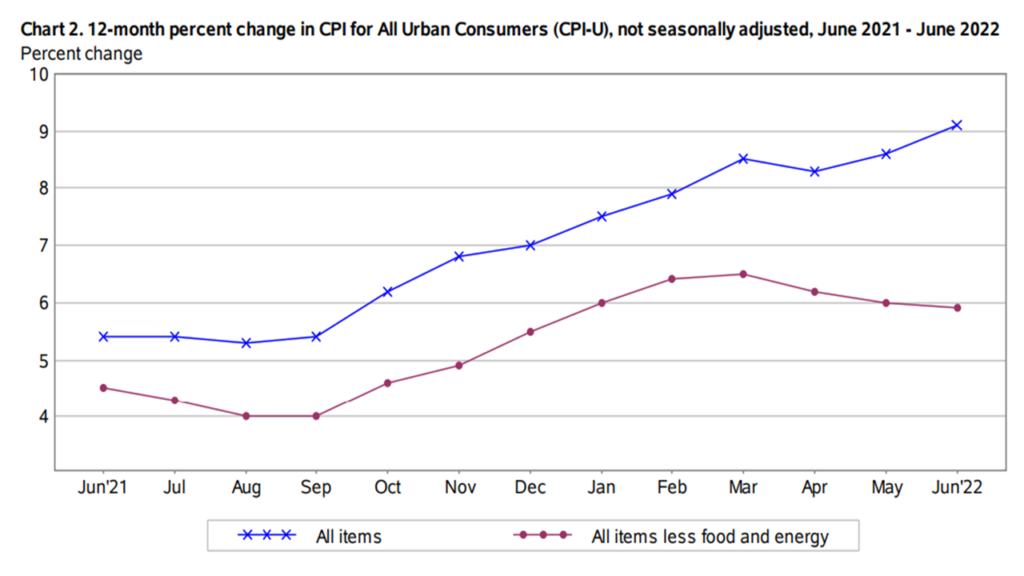
According to this morning’s report from the Bureau of Economic Analysis, during the month of June US real personal consumption expenditures continued flat, almost unchanged from January and basically the same as October 2021. The “feels-like” rate of expenditure is much hotter because of inflation (economic humidity?), but in terms of steady 2012 dollars US demand for aggregate goods and services has been very consistent.

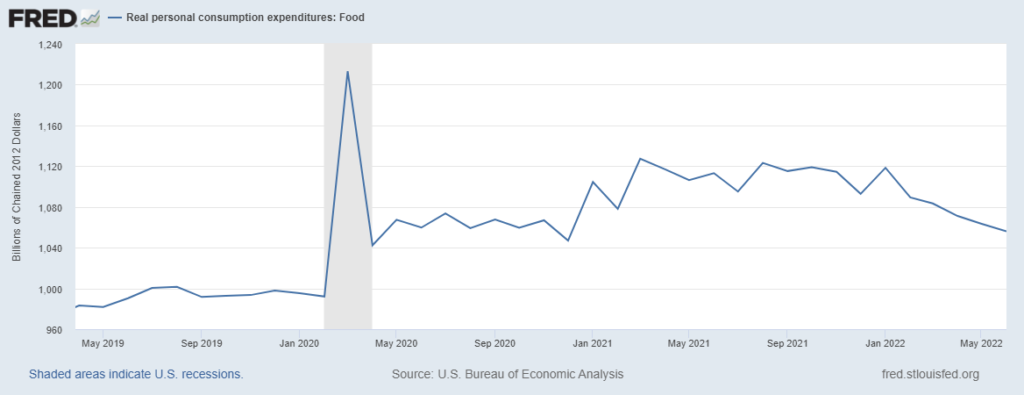
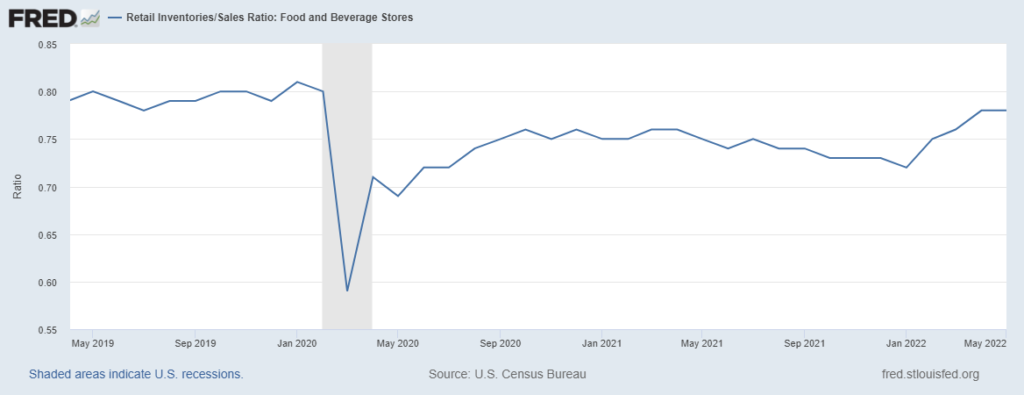
In June 2019 US consumers spent $990 billion on food-at-home (see chart below). In March 2020 fear-of-missing-out (and plenty more fears) spurred grocery purchases to over $1200 billion. But as most shelves continued to be stocked and various viral fears subsided, the contents of grocery carts settled at about six to seven percent higher than pre-pandemic, partly reflecting significantly reduced consumption of Food-Away-From-Home.

Then in the first quarter of 2021 grocery purchases lifted over ten percent and wobbled there most of last year. I will confess (again) that I expected to see this level of grocery buying gradually decline as eating-out climbed. But according to the data, starting in April 2021 American consumers spent as much or more at restaurants than pre-pandemic, even while maintaining our plentiful pandemic pantries (and/or expanded waistlines?).

Until February 2022since at least Super Bowl Sunday real expenditures on groceries have declined. Despite this decline, US consumers are still spending well-above real pre-pandemic trend on food-at-home and far above the prior trend on food-away-from-home. I suspect — but don’t have evidence to prove it — that this bifurcation reflects the very different “felt” reality of the top two earning quintiles from the other three. (Nominal dollars spent on groceries are still increasing slightly, but this is due to inflation.)

On June 26, in the context of several posts related to how supply chain disruptions can contribute to inflation, I wrote:

I hypothesize that between May and September we will see food-at-home real consumption gradually decline by another seven to ten percent and then flatten or incrementally increase. I hypothesize that durable goods and services will begin to show slopes similar to 2022 food consumption. I also hypothesize a more rapid rate-of-change than that for food between last November and April. These are deniable hypotheses. I am not sure. It does seem plausible. If this happens, demand and supply will be closer to equilibrium.

The durable goods slope is not (yet?) displaying my anticipated slant. Neither is the services slope… but I really did not expect services to begin falling until summer is over. The June services number is lower than expected. Sustained demand for durable goods remains higher than I expected five weeks ago. (This is why it is called a deniable hypothesis.)

In April the PCE for food-at-home was $1071 billion. Real food expenditures in June were $1056 billion or a decline of about 2.5 percent. If the May+June rate of change continues through the end of September consumption would be lower by slightly less than seven percent. I hope this more gradual easing is maintained. That result is certainly better for the grocery industry and would be consistent with an economic “soft-landing.” More when we see July’s data…

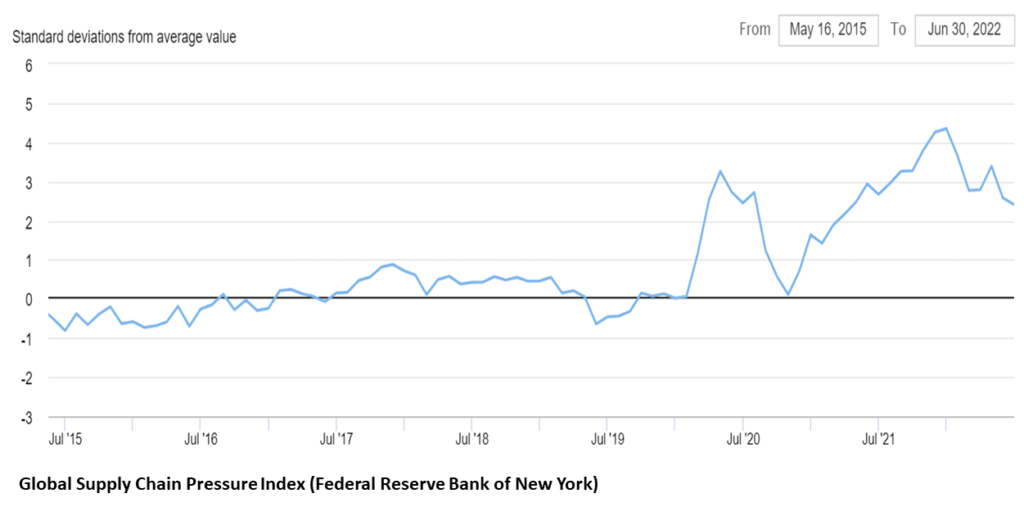
In any case, at least in the food sector, we now have a level of demand much better calibrated with current production and distribution capacities. In my judgment, this means the supply-driven contribution to inflation is diminished.

BELOW: INFLATION ADJUSTED PCE FOR FOOD-AT-HOME THROUGH JUNE 2022

Decadent Demand?

President Putin is depending on decadent demand. He is depending on European consumers and bourgeois politicians to succumb to high prices and chilly room temperatures.

Putin has restored General Winter to a prominent place in Kremlin councils. He hopes this month’s temperature extremes will return to Europe in dramatic winter garb. January is Berlin’s coldest month with an average low of 29°F and high of 38°F.

In recent years natural gas has generally provided between one-fifth to one-quarter of the European Union’s total energy mix. There is considerable variation nation to nation.

Natural gas fuels roughly one-fifth of EU electrical generation. This ranges from over 40 percent in Italy and Netherlands to less than 15 percent in Germany or barely more than 5 percent in Denmark.

Last year more than 40 percent of EU natural gas consumption was supplied by Russia. Since February 24 this proportion has plummeted. Flows vary by season. I’m not confident of a current comparative statistic. But several credible sources (here and here and here) indicate that Russia’s EU market share for natural gas has been reduced by at least one-quarter, maybe as much as one-third. But, once again, dependence on Russian flows differs considerably by region. Hungary, Slovakia, Italy, and the Czech Republic are much more exposed to reductions in Russian flows than other EU nations.

Europe has significantly increased imports of non-Russian LNG. In June for the first time, US LNG deliveries to Europe exceeded Russian pipeline deliveries (more). The US would almost certainly be exporting even more if the Freeport LNG facility was still operating (and price-pull could be found). Qatar and Algeria (more) are also increasing LNG flows to Europe (more). As of July 25, EU natural gas domes are about two-thirds full. [Below is a map showing current LNG terminals and natural gas pipelines. At the source map natural gas storage facilities can also be located.]

Yesterday, July 26, The European Commission announced decisions intended, “to reduce gas use in Europe by 15% until next spring. All consumers, public administrations, households, owners of public buildings, power suppliers and industry can and should take measures to save gas. The Commission will also accelerate work on supply diversification, including joint purchasing of gas to strengthen the EU’s possibility of sourcing alternative gas deliveries.” According to S&P, a significant proportion of this reduced consumption may also be teed-up by price-driven reduced demand (see chart below):

A 15% voluntary gas demand reduction target aligned relatively closely with a Platts Analytics’ estimate of demand destruction due to high prices. Gas demand in Northwest Europe would fall by 13% between August 2022 and March 2023 compared to the five-year average demand for the period, Platts Analytics modelling showed. Based on its TTF price forecast of Eur125-140/MWh, demand would be reduced in the power sector through maximum coal and oil switching, while industrial demand is forecast to drop by 15%.

President Putin has cut back Russian natural gas flows to Europe. He has not cut off these flows. As long as any Russian natural gas is going, this gives him potential leverage to cut further or promise increases. The cuts so far are enough to cause European economic (and political) friction (and to significantly increase prices being paid for what is delivered). Putin perceives that time is on his side. Maybe the Atlantic hurricane season will wallop US LNG exports. Maybe General Winter will descend on Amsterdam to Warsaw with the coldest temperatures in two centuries. He is confident that contemporary European consumers — and voters — are effete, weak, self-indulgent, and can eventually be distracted from any concern for Ukraine… much less what might come after Ukraine.

Yesterday the host of the EU energy consultations said, “… everybody understands that this sacrifice is necessary. We have to, and we will, share the pain” (more). Putin is not alone is perceiving time as a potential ally.

The sharp and mostly unified NATO (plus) response to the invasion surprised Putin. But it now seems clear enough (to him) that this was just reflexive sentimentality. With the help of some snow and ice, his debauched neighbors will, he now expects, turn against their current political leaders who will then turn to him to restore flows…

+++

WEDNESDAY AFTERNOON UPDATE: The words above (and charts below) were posted about 0600 Eastern this morning. Natural gas prices were already moving higher. They continued to do so as the promised Gazprom cutbacks materialized. According to the Financial Times: “European gas prices jumped higher on Wednesday after Russia followed through on its threat to further reduce supplies to the region, increasing the risk the continent could face shortages in the winter months. Gas prices rose as much as 13 per cent on Wednesday as flows on the Nord Stream 1 pipeline were cut to just a fifth of normal capacity.” (More and more and more.) Prices might be even higher (and will move higher) when China’s demand for energy recovers. EARLY THURSDAY MORNING: European natural gas prices eased overnight and, so far, this morning on indications that the lower flows from Russia are, in fact, flowing.

Mid-summer US grocery flows

The US grocery supply chain continues to close the gap between demand and supply.

Despite (and because of) high food inflation and plenty of competition for spending (e.g. eating out and travel), in June US consumers spent almost one-fifth more on groceries than in June 2019 (see first chart below). Inflation-adjusted spending is flat or incrementally down, but Americans are still buying many more calories (not just spending many more dollars) than pre-pandemic (more and more and more).

Despite this very strong pull, push is catching up. According to IRI, there are now fewer stock-outs than earlier this year (see second chart below. Since January there have been improving inventory levels for grocery stores (see final chart below). We are now very close to parity with 2019 grocery inventories. These are May numbers from the US Census survey. Based on what I have heard from grocery distributors, I bet the inventory to sales ratio further improved in June and July (more).

For my friends in the grocery industry — and for general economic reasons — I am glad that we have not seen significant demand destruction for groceries as inflation and spending-competition increase. I will also confess: such persistent pull so much higher than pre-pandemic surprises me. The response by production, distribution, and retail players has been creative, risk-taking, and — as demonstrated by the numbers — effective.

Fuel and food twist and shout

Deutsche Welle tells us: “Water levels in the Rhine River are just inches away from forcing another shutdown of ship transportation.” Freight volume at Rotterdam was basically flat in the first half of 2022. Loss of the riverine connection, especially if early in the second half, would further narrow flows.

Slower and lower flows characterize many aspects of a Europe once again at war and worried about what’s ahead.

As this blog has repeatedly reported, Russia’s oil — despite various sanctions — continues to flow. More effort is required to buy it, but it is still sloshing about the world. Below are charts from S&P. (The original S&P resource is interactive and very much worth accessing, please also see the shifting sources of European oil imports since February.)

Yesterday there was good news that Nord Stream 1 has resumed operations (more and more). For now the flow is one-third or, perhaps, two-fifths of heretofore, but Europe is happy to get it here and now. Tomorrow is another day.

More good news — or at least progress toward potential good news — in releasing more flows of Ukraine’s grain to world markets, especially customers in the Middle East and Africa. Today a Turkey-brokered agreement will be signed in Istanbul. According to France24, “A coordination and monitoring centre will be established in Istanbul, to be staffed by UN, Turkish, Russian and Ukrainian officials, which would run and coordinate the grain exports, officials have said. Ships would be inspected to ensure that they are carrying grains and fertiliser rather than weapons. It also makes provision for the safe passage of the ships. The control centre will be responsible for establishing ship rotation schedules in the Black Sea. Around three to four weeks are still needed to finalise details to make it operational, according to the experts involved in the negotiations.”

Disrupted channels are the most common complication facing high volume (and especially high velocity) demand and supply networks. Severe reductions in discharge of Ukraine’s grain are a dramatic example. But what we also see is that where effectual demand and production persists, the flow of supply may twist, turn, and cuss, but continue…

BELOW: FIRST FEBRUARY, SECOND JULY

The pour continues, swallow carefully

[Update below]This morning natural gas is flowing again in the Nord Stream 1 Pipeline. This is a principal channel for natural gas from Russia to Western Europe. The pipeline had been closed for usual summer maintenance. There was, however, concern that future flows could be held hostage to posturing related to the war in Ukraine (more and more and more).

According to Reuters, “Nord Stream 1 transports 55 billion cubic metres (bcm) a year of gas under the Baltic Sea and has been offline since July 11… A spokesperson for Austria’s OMV said Gazprom signalled it would deliver around 50% of agreed gas volumes on Thursday, levels seen before the shutdown.”

Depending on demand and availability of other sources, natural gas typically provides between one-fifth and one-quarter of European Union grid generation (see chart below). Over the last two weeks, reduced wind and heat-related high demand have increased natural gas draws. On some recent days natural gas has provided nearly one-third of EU generation.

Despite the temporary shutdown of Nord Stream 1 and strong demand, European natural gas inventories have not (yet) fallen during July and storage domes are about 65 percent full, ranging from a low of 42 percent in Bulgaria to 100 percent in Portugal. France is at 72 percent. Germany’s natural gas inventories are currently measured at 65 percent full.

According to an S&P report on German natural gas purchases, “The share of Russian gas deliveries averaged 55% in the past, but this fell to 26% by the end of June,” the [German economics] ministry said, adding that last year Russia supplied 46 Bcm of gas to Germany. The lower share in June is a result of Russia’s Gazprom cutting supplies through the Nord Stream pipeline to just 40% of capacity in mid-June, citing issues with maintenance at a key compressor station. The ministry said the claims of technical problems was a “pretext”… Germany currently does not have the infrastructure to directly import Liquified Natural Gas (LNG) (more).

The natural gas network crossing west from Russia through Ukraine continues to operate at less than half its 2020 capacity and flows. Most recent deliveries are to Veľké Kapušany, Slovakia, with Hungary a distant second-place recipient.

The prospect of natural gas shortages during a war-torn European winter has increased the need to maximize inventories and diversify channels and sources.

US LNG exports to Europe have been lower than expected partly due to the fire-related loss of the Freeport LNG terminal in early June. This is usually the second largest of seven US LNG export facilities. But other LNG operations are exporting at full capacity (more). Loss of Freeport has also meant lower than otherwise natural gas prices. Without this, current electric rates in heat-ravaged Texas (and elsewhere) would be even higher.

So obvious it is barely more (or less) than nagging, but still: Concentrating flows to fulfill demand usually enhances efficiency and always concentrates risk. The most beautifully planned bottleneck is one surprise short of becoming a chokepoint.

July 25 Update: Nord Stream 1 flows will now be cut to 20 percent of once-upon-a-time expected. According to the Wall Street Journal, “Russian state-owned energy producer Gazprom PJSC said gas exports through the vital Nord Stream pipeline to Germany would drop to about a fifth of the pipe’s capacity, blaming sanctions-related problems with turbines that have already reduced flows. The fresh reduction in the pipeline’s capacity—from 40% currently to 20%—is expected to take effect Wednesday, Gazprom said.”

Feeling the burn

Several consecutive days of high temperatures across much of North America and Europe means much more demand for electricity, especially for air conditioning. Over the last decade-plus there has been considerable conversion to natural gas for grid generation. Today close to 40 percent of US electrical generation depends on natural gas.

Until recently, natural gas could claim a significant price advantage over other alternatives. Not so much now. US prices lag global, but the 90-101 percent increase in global benchmarks since January has also pulled US natural gas prices higher especially with recent spikes in domestic demand. According to S&P:

On July 21, the US power burn is forecast to average 48.6 Bcf/d in what would be a new single-day demand record, according to data from Platts Analytics. Assuming the forecast is accurate, the new high would outpace the prior single-day record from July 2020 by over 500 MMcf/d, or about 1%.Already this month, generator gas demand has trended a record-breaking pace for July of 44 Bcf/d. Compared with July 2020, when low prices made gas a go-to fuel for power generators, demand is up about 650 MMcf/d, month to date. Compared with July 2021, generator demand is up by a brow-raising 6 Bcf/d or almost 16%, this month… [See chart below]

Higher prices are tracking this demand. For example the US benchmark Henry Hub futures market is displayed in the second chart below. But paying more for abundant supply is much better than European prospects for not having enough no matter how much is paid (more and more and more and more and more to come).

Dog days bite and hold on tight

[Updates below] Several days of unrelenting triple digits plus several million people plus an electric grid (more) built for considerably lower demand: Do you perceive a potential problem?

You can keep looking here:

Energy Reliability Council of Texas (ERCOT) Dashboard

Unfortunately the EIA Electric Grid Monitor continues to be down…

Here are some prior comments on the near-term risks facing Texas electric power consumers and downstream systems… meaning most of modern life, certainly including supply chains.

Texas is not the only region facing serious gaps between demand and current grid power capacity (more and more). But the Texas grid is designed to be even more self-reliant than most, and arguably more vulnerable as a result.

Monday Afternoon Update

At 3:30 Central Time the temperature in Dallas is 108 degrees Fahrenheit. Demand is about 2100 megawatts less than current capacity (not counting ancillary services) or within three percent of current capacity. At 3:47 demand was slightly higher. At 3:57 electrical use had increased by about 360 megawatts. I will admit my felt concern was heightened when 1200 miles away a thunderstorm knocked out our grid for about an hour while I was monitoring ERCOT. It is much better to look at supply-and-demand measures than an outage map.

According to S&P today’s most serious threat for continued flows may come at sunset when temperatures will still be in the triple digits and solar power drops. Texas spot prices for natural gas are surging.

July 19 Update: Below is the complete demand curve for the ERCOT grid on Monday July 18. Despite the high temps, demand stayed just below production capacity even as the sun set. But the forecast is for as hot or hotter today… and August is still to come.

Inch by inch, step by step

Bloomberg has posted a very helpful overview headlined “Supply Chains Inching Back to Normal“. The report includes recent assessments and charts by Oxford Economics, Flexport, Freightos, and more. The core takeaway: “Economists generally agree that US household demand for merchandise will be key to watch in coming months, but they’re split about whether it will stay strong or start to soften.”

Last week’s June retail sales figures have been read by many as a stay-strong signal. There are, however, start(ing)-to-soften signals too. For example real consumption for food-at-home and real consumption of durable goods are both well off peak.

Below are two Federal Reserve sources for overall supply chain fitness. (GSCPI is mentioned but details are not included in the Bloomberg report. The Cass Freight Index is not mentioned.) Given the high-pressure on US supply chains in 2021, this is one time when down-hill slopes are welcome.

Reduced demand and related cooling of friction are also apparent in other freight market indicators. Just one: the van load-to-truck ratio is 30 percent below June 2021. As previously outlined, I expect this softening to widen and persist. I hope for a few months of gliding, rather than sharp drops in demand.

But as the two charts below also suggest, US flows continue to be volatile. There are plenty of current problems (more and more and more) with risks worth anticipating. In the classic Three Stooges routine — inch by inch, step by step — the slow turn is not achieved without related pain.

Retail sales increase

Retail sales in June 2018 were $437,527 million. Retail sales in June 2019 were $448,992 million. Good growth. Steady growth. For most Americans the summer of 2019 felt like a prosperous time.

Retail sales for June 2022 were, according to this morning’s US Census Bureau survey, $594,499 million. (See chart below for 2018 to current, seasonally adjusted.) This is a new, inflation-fattened record.

A generous extension of 2015-2019 sales might have us buying about $500,000 million last month. Instead we spent one-fifth more than pre-pandemic trends. Given the unusual amount of cash burning in our pockets (top 1 percent, bottom 50 percent, and more), this is not surprising (warning: Fed data not updated since 1st Quarter, but still…) Given strong employment and steady wage growth, any sharp decline in spending would be surprising.

But no wonder we have continued supply chain challenges. I had really hoped for a continuation of May’s very modest softening in sales. Given this level of demand, I am even more impressed with current fulfillment.

No wonder Wednesday’s Consumer Price Index found such significant inflation.

Contemporary economies are addicted to growth. There are good reasons (and good outcomes). But every addiction has its dark side. Inflation is the current shadow. The possibility of recession preoccupies the imagination of many. But I will suggest, just several months of steady could be a sunny tonic.

Consumer Price Index: Food

Above are the headline numbers for June CPI: Overall up 9.1 percent, core (less energy and food) up 5.9 percent over the last twelve months. This is a couple of decimal points higher than expected… and expectations were plenty high. Still, given prices at the pump for most of June, not a huge surprise. Rents are also rising fast. The slight, continuing decline in core inflation is more interesting to me.

Food price hikes pale next to fuel, but so did the faces of many June grocery shoppers. Most US consumers under age-60 have never experienced this size and rate of food price increases. We also know that, partly as a result of prices, inflation-adjusted grocery expenditures have been falling all this year. I have predicted real food-at-home expenditures still have a ways to fall until intersecting with pre-pandemic trends. (More on food price trends.) Given June’s velocity of food price increases, I will be surprised if demand destruction has paused. This also tracks what I hear informally from retailers and distributors. While total revenues are still going up, actual volume of groceries shipped is declining. This dynamic has started to show up in a reduced incidence of stock-outs.

Reduced demand is reducing friction in food supply chains.

+++

Here’s this morning’s full statement on food from the Bureau of Labor Statistics:

The food index increased 1.0 percent in June following a 1.2-percent increase the prior month. The index for food at home also rose 1.0 percent in June, the sixth consecutive increase of at least 1.0 percent in that index. Five of the six major grocery store food group indexes rose in June. The index for other food at home rose 1.8 percent, with sharp increases in the indexes for butter and for sugar and sweets. The index for cereals and bakery products increased 2.1 percent in June, with the index for flour rising 5.3 percent. The dairy and related products index rose 1.7 percent over the month, following a 2.9-percent increase in May. The fruits and vegetables index increased 0.7 percent in June after rising 0.6 percent in May. The index for nonalcoholic beverages rose 0.8 percent over the month. The only major grocery group index to decline in June was the index for meats, poultry, fish, and eggs which fell 0.4 percent over the month as the indexes for beef and pork declined.

The food away from home index rose 0.9 percent in June after rising 0.7 percent in May. The index for full service meals rose 0.8 percent over the month. The index for limited service meals increased 0.7 percent in June, as it did in May.

The food at home index rose 12.2 percent over the last 12 months, the largest 12-month increase since the period ending April 1979. All six major grocery store food group indexes increased over the span, with five of the six rising more than 10 percent. The index for other food at home increased the most, rising 14.4 percent, with the index for butter and margarine increasing 26.3 percent. The remaining groups saw increases ranging from 8.1 percent (fruits and vegetables) to 13.8 percent (cereals and bakery products).

The index for food away from home rose 7.7 percent over the last year, the largest 12-month change since the period ending November 1981. The index for full service meals rose 8.9 percent over the last 12 months, and the index for limited service meals rose 7.4 percent over the last year.