[Updates below] Dallas did not go dark on Monday. The Texas grid is flowing strong. But there was cause for concern.
Sustained temperatures above 100 degrees resulted in record high demand for electricity. Persistently high temperatures are forecast.
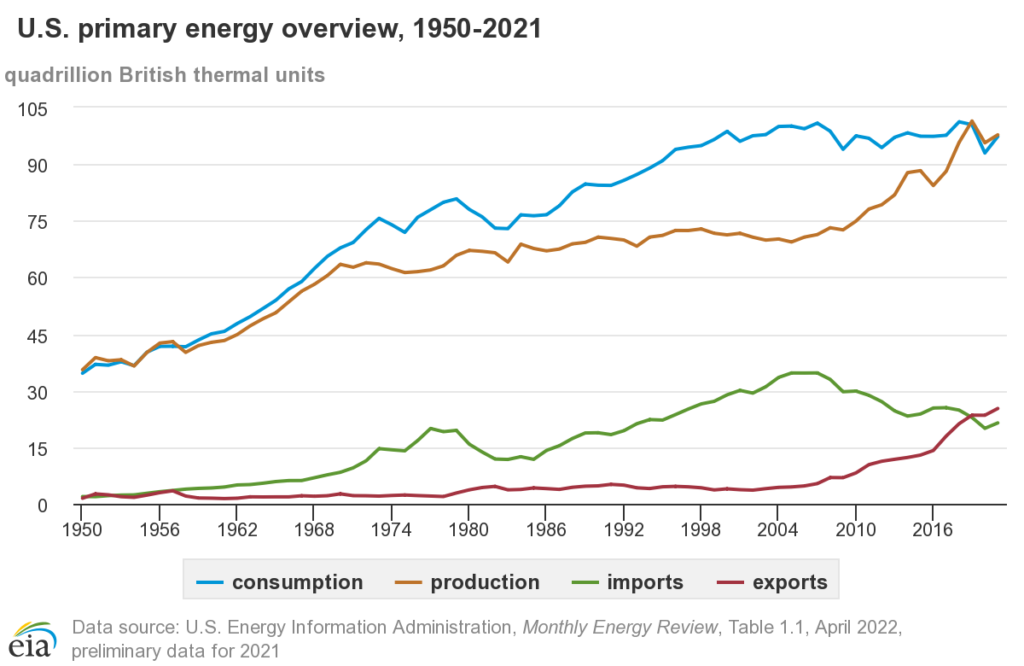
This year demand for electricity in Texas is regularly exceeding prior records (here and here and here). It is only mid-July, more records will likely fall in weeks ahead.
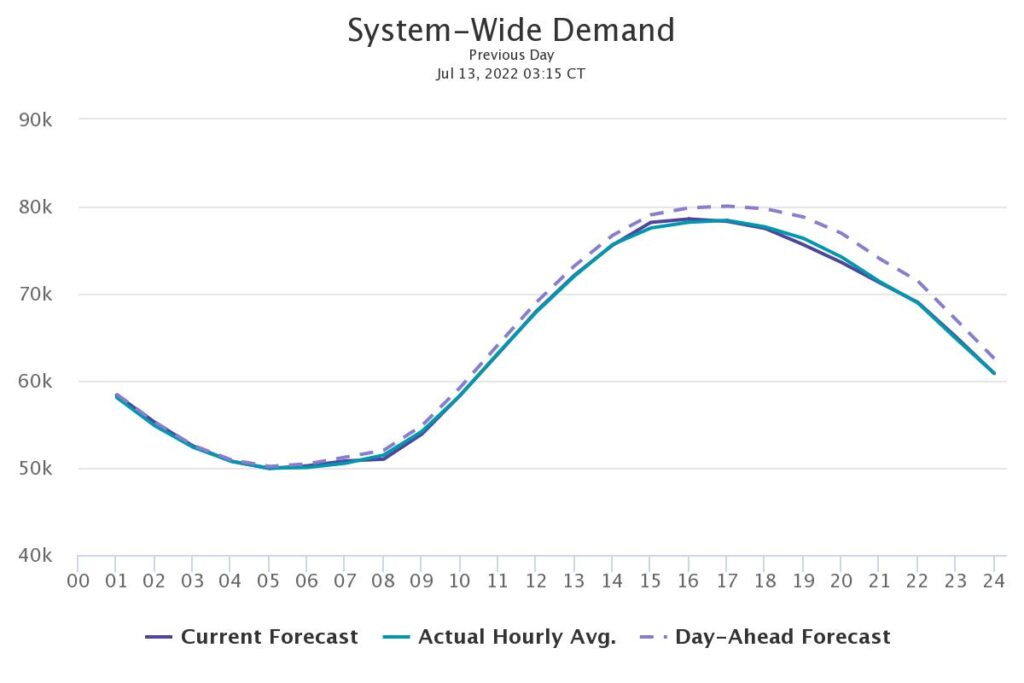
At about 5PM on Monday electricity demand in Texas hit a new all-time record of 78,264 MegaWatts. The Energy Reliability Council of Texas (ERCOT) reports there was just over 81,000 MW of generation available. The chart below shows Texas-wide electricity demand for Tuesday, July 13, again just within forecasts and capacity.
In terms of supply, over the last few days in Texas there was lots of sun, less wind, and plentiful natural gas. High heat tends to suppress wind density. On Monday wind was generating less than ten percent of installed capacity. Solar sources were producing at just over 80 percent of installed capacity.
Natural gas and other thermal sources were also delivering more than 80 percent of installed capacity. Texas is not the only source of strong pull for natural gas. According to S&P, “… the largest annual increase in gas demand this season appears to be coming from power generators. In the US Southeast – which includes East Coast states outside of the South Central region, like Florida, Georgia and the Carolina – gas-fired power demand is up nearly 2.5 Bcf/d summer-over-summer to trend at an average 13.8 Bcf/d from June 1 to date.” This strong demand has emerged earlier than usual… Along with a roughly 2.3 Bcf/d increase in LNG exports and a combined 400 MMcf/d increase in residential-commercial and industrial consumption this summer, demand in the Southeast is now outpacing supply at some downstream locations, fueling previously unseen price premiums.”
Supply would be tighter and prices even higher if the Freeport LNG terminal was still operating. More supply is available to Texas and nearby with the United States’ second-largest LNG export facility closed. The United States typically exports roughly 10 to 12 percent of LNG production. With Freeport offline exports are likely to be closer to ten than twelve percent. Good for Houston.
Not so good for Hamburg (or Hokkaido or Hyderabad). As Europe loses Russian flows of natural gas, US LNG is an important gap filler. Summer is when European natural gas domes are refilled for winter draw-downs. Current inventories are uneven, but mostly moving in the right direction at the low end of five year averages. But there is cause for concern that ordinary supplies are about to be reduced, while unusual summer heat increases demand (in Europe too), and alternative sources of supply will be too little, too late.
This is another example of an extreme event (weather) prompting a demand surge (for electricity) that challenges both midstream (grid power) and upstream (natural gas, wind, and solar) production capacity. Where effectual demand (access and money) can be deployed and delivery channels are operating, networks have again and again demonstrated robust and creative abilities to fulfill demand. But this has mostly been achieved through unusually — unsustainably? — high capacity utilization levels.
Extraordinary flows are being generated… and regular maintenance is often abbreviated or delayed… and longer hours are being worked over extended periods… and price-increases cause a whole host of downstream complications… and any sustained loss of almost any fraction of production or delivery capacity can quickly exclude a substantial number of customers.
Abundance and fragility are dancing cheek to cheek.
ERCOT Demand for Tuesday, July 12
+++
July 14 Update: A few hours after what’s above was posted, ERCOT projected that demand would exceed capacity on Wednesday afternoon, July 13. While wind capacity utilization picked up slightly yesterday, both solar and thermal were lower (more and more). Once again, Texans cut back and the lights stayed on. But what if we are looking at ten more weeks of this — with the prospect of a couple of hurricanes too?
July 15 Update: Bloomberg reports, “To meet the surge in power demand, Ercot, the grid operator, is leaning heavily on a mechanism called reliability unit commitments to ensure there’s enough supply. Plants are being regularly ordered to go into service, or remain in operation, and skip any scheduled maintenance. The measure also overrides shutdowns for economic factors or any other issues. And Ercot is using the rule more than ever before as the state battles bout after bout of extreme weather… Maintenance for power plants — especially older ones — can be time consuming and complicated, said Webber, who also serves as chief technology officer of Energy Impact Partners, a clean tech venture fund “You kind of have to dismantle the plant,” he said. “It’s not something you can do in a couple of hours.””