Month: September 2022

Coal for the cold

Speaking on September 10, the President of Ukraine said:

This will be the most difficult winter in the whole world… Russia is doing everything to break the resistance of Ukraine, the resistance of Europe and the world in 90 days of this winter. Because this is what Russia hopes for. This is its last argument. The last one, I am sure of it: the cruelty of the winter period, which is supposed to help when the cruelty of man is not enough. And we must be ready – not to break down, not to split, not to deviate from our path. There are 90 days ahead, which will be more crucial than 30 years of Ukraine’s independence. 90 days that will be more crucial than all the years of the existence of the European Union. Winter will determine our future and the risks.

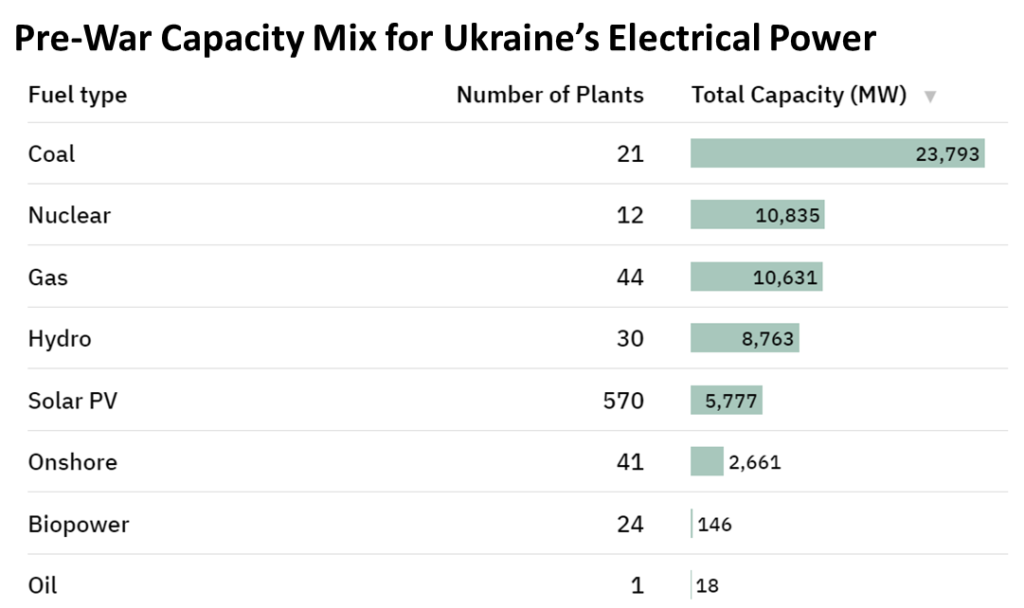
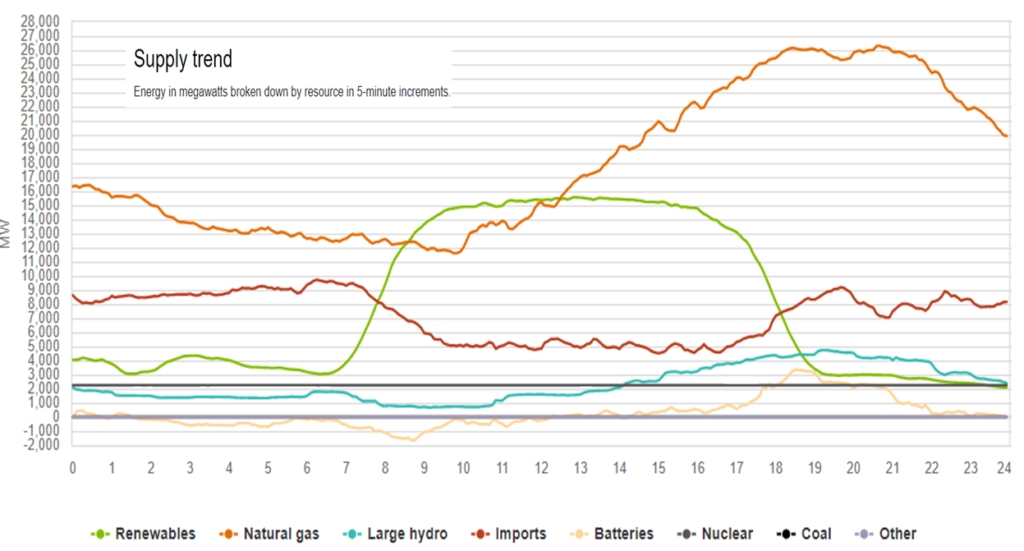
This week’s controlled shut down of the Zaporizhzhia Nuclear Power Plant reduces Ukraine’s grid capacity by 5700MW or almost one-tenth of the nation’s pre-war electric generation capacity (more and more).

What Russian cyberattacks did not achieve is now being advanced through military actions and intimidation.

Earlier this week Euronews reported, “Russia has been accused of attacking power stations and other infrastructure in eastern Ukraine on Sunday, which caused widespread outages. The bombardment ignited a massive fire at a power station on Kharkiv’s western outskirts…” (more)

Forty-four natural gas-fired power plants contribute about 10,000MW to grid capacity. Ukraine’s natural gas storage facilities are less than one-quarter filled.

Coal stocks are, however, reportedly more than double 2021’s winter-ready inventory. Since June Ukraine has banned all coal and most energy-related exports. Twenty-one coal-fired plants constitute more than one-third of Ukraine’s grid power capacity. Coal-fired capacity can be maximized, but is not sufficient to replace lost nuclear or natural gas. Overall demand for electricity has fallen due to war-time economic disruptions. New capacity is being developed, but is unlikely to be available this winter.

Still, Ukraine apparently now has sufficient confidence in its coal-fired capacity that it may provide urgent support to neighboring Poland. While Poland is Europe’s largest coal producer and exporter, before the war Poland was also a major importer of cheap Russian coal (sell high, buy low). Since April Warsaw has banned imports of Russian coal and is now facing a significant shortfall in stocks needed for electric generation and household heating using lump coal (more and more and more).

Ukraine’s calculus seems to be: If our coal plants continue to operate, we have sufficient coal stocks and replacement flows to generate at capacity. We cannot use more coal than current capacity. If the Russians continue to attack our coal plants, we will not be able to fully utilize these coal inventories. Earlier this month, President Zelensky said, “We have sufficient volumes for ourselves and we can help our brothers to prepare for this winter.”

This map and the chart above originally appeared in Power Technology

European Energy Flows

Nordstream 1 is closed (Nordstream 2 never started). Natural gas continues (rather amazingly) to flow west from Russia through Ukraine to Velke Kapusany then farther along (more and more and more). Current Natural Gas inventories in Europe range from a low of about half-full in Latvia to two-thirds full in Bulgaria to more than 90 percent full in Britain, Denmark, France, and Poland. The EU average for natural gas in storage is hovering around or above 85 percent of available containment.

European electrical generation typically depends on natural gas for one-fifth to one-quarter of its energy mix. The need for natural gas is typically (but not always) a bit less in summer (first chart below) and a bit more in winter (second chart below). But core capacity to power the grid is largely fixed, barring major infrastructure changes. With access to Russia’s natural gas now seriously compromised, grid generation this winter will use more coal, nuclear, and non-Russian natural gas (more and more and more). This is the supply-side contribution to a solution (more and more).

The EU is also moving toward an ambitious demand-management effort. (Britain is not.)

Tuesday, September 13, the European Commission proposed:

To target the most expensive hours of electricity consumption, when gas-fired power generation has a significant impact on the price, the Commission proposes an obligation to reduce electricity consumption by at least 5% during selected peak price hours. Member States will be required to identify the 10% of hours with the highest expected price and reduce demand during those peak hours. The Commission also proposes that Member States aim to reduce overall electricity demand by at least 10% until 31 March 2023. They can choose the appropriate measures to achieve this demand reduction, which may include financial compensation. Reducing demand at peak times would lead to a reduction of gas consumption by 1.2bcm over the winter.

Efforts by the EU and its members states to reduce energy consumption began in the weeks following Russia’s invasion of Ukraine. As the summer ended, these efforts have escalated (more and more).

Much will depend on winter weather. As previously noted, for President Putin colder is presumed to be much better.

Both charts above were generated by EnergyMonitor

Inflation’s role in demand destruction

Since March 2020 American consumers have wanted more of many food products than there has been capacity to supply these food products (more). The first chart below displays real personal consumption expenditures for food. The second chart shows an index for US food manufacturing. Even after several months of consecutive declines, food demand remains well above 2019 levels, while food manufacturing outputs have remained consistent with or only slightly above 2019 levels for most of the last two years (more).

Given this imbalance of demand and supply, prices have increased to test the depth and persistence of this demand. Given the tight labor market, volatile operational costs, and recent increases in the cost of capital, suppliers have been reluctant and/or constrained in their ability to increase manufacturing capacity. Increasing food prices have (as the real PCE chart below suggests) begun to re-balance demand in the overall food category. There is still a ways to go before supply capacity and real demand are balanced.

This morning’s Consumer Price Index for August confirms that US food prices continue to increase. According to the Bureau of Labor Statistics, “The food at home index rose 13.5 percent over the last 12 months, the largest 12-month increase since the period ending March 1979.” (See third chart below.)

These price increases and their rate of change are reducing real demand. As of the end of July there was roughly $40 billion in “excess” monthly food demand still to be shed. The August PCE will almost certainly show more such shedding. Once the excess is mostly gone, the CPI arc should begin to flatten or even decline… as long as pre-pandemic sourcing, manufacturing, and distribution capacity can be maintained. On a seasonal basis, the US food manufacturing sector is — so far –demonstrating an ability to fully deploy existing capacity. In July 2022, for example, this sector produced a bit better than three percent more than July 2019.

US Railway Squeeze

[Updates Below} Yesterday, Friday, September 9, US railroads began to prepare for a possible strike. Here is what BNSF told its customers, “Due to the possibility of an interruption of service when the cooling off period expires September 16, we will begin to take steps to manage and secure the shipments of hazardous and security-sensitive materials as early as Monday, September 12.”

Reuters reports, “A railroad work stoppage would cost the U.S. economy $2 billion per day in output and require 467,000 long-haul trucks daily to handle shipments diverted from rail – [far, far, far (Palin note)]exceeding supply… “Additional insecurity placed on the still fragile U.S. supply chain – as we recover from COVID and other supply chain stressors and move towards the holiday season – will harm the economy at large and individual Americans,” according to the American Trucking Associations (more and more).

Bloomberg explains, “Railroad workers’ complaints are similar to those of other employees who have threatened to walk out in the wake of the pandemic: They’re overworked, understaffed, and underpaid, and they’ve been operating without a contract for more than two years.” (more and more)

The United States Surface Transportation Board gathers significant near-time data on railway performance. Supply Chain Dive has created a visual dashboard that converts some of this data into comparative reports over time meaningful to the human mind. (An example below for BNSF through September 7.) Please see their railway performance dashboard. Many thanks to Matt Leonard and Nami Sumida.

September 12 Update: Nice overview of current railway flows and bottlenecks from Bloomberg (more and more).

September 14 Update: Very helpful breakdown of commodity impacts of the potential strike from S&P. Good overview of current status of negotiations from Reuters.

September 15 Update: Early this morning a tentative agreement was reached (more and more). Threat of an imminent strike has been avoided.

California grid: demand management

[Update Below] Yesterday, September 6, at 17:48 Pacific Time the California Office of Emergency Services sent the following mass text message:

“Conserve energy now to protect public health and safety. Extreme heat is straining the state energy grid. Power interruptions may occur unless you take action. Turn off or reduce nonessential power if health allows, now until 9pm.”

In the next seven minutes demand for grid power declined 1.2 gigawatts and continued to drop. See chart below (more and more and more). An emerging — potentially cascading — threat to sufficient supply was mitigated by well-timed, well-aimed action that engaged a well-prepared target.

September 8 Update: Wednesday evening and overnight headlines are once again similar to California Avoids Blackouts (more and more). When a big risk avoided is also big news, the risk context is clearly higher than desirable.

September 10 Update: Supply and demand continued to play cat and mouse with California’s grid. Late this week a second cat — in the form of tropical storm Kay moving north from Baja — increased risks (more). But as Kay bounced into the heat dome, SoCal temperatures fell and the new cat turned (mostly) out to sea. (More on demand management and related duck curves from a UCLA engineer.)

California’s Constrained Grid Capacity

[Updates Below] According to the National Weather Service in Sacramento that region and most of California will experience, “a prolonged period of dangerously hot conditions with record and near record temperatures up to 105 to 115 degrees. Limited overnight relief, especially in the foothills… The most significant heat is forecast to occur Monday and Tuesday with excessive heat continuing through at least Thursday.”

According to the California Independent System Operator (CAISO), “We are facing a load forecast of 48,817 megawatts and energy deficits between 2,000 and 4,000 megawatts for Monday, resulting in the highest likelihood of rotating outages we have seen so far this summer.”

Real time balance of supply capacity and demand can be monitored at the CAISO website. Late afternoon local time today and tomorrow are when rolling blackouts are most likely to be implemented to avoid even worse outcomes. Below is how the emerging deficit is reported early this morning by CAISO. More and more and more and more.

September 6 Update: As Wellington supposedly said of Waterloo, “It has been a damned nice thing — the nearest run thing you ever saw in your life.” Below are charts displaying Monday, September 5 demand and supply. Very close, but “rotating outages” were avoided for one more day. CAISO reports that demand behavior has been crucial to balancing flows. Imports (interchange) from neighboring regions were also important (please see below). For today the ISO is projecting “supply deficiencies of 400 to 3,400 MW between the hours of 5 p.m. and 9 p.m.” California time. The Sacramento Bee has a helpful overview (more).

Black Sea: fragile flows grow

[Update Below] Grain and other agricultural flows from three Black Sea port are persisting (see first map below). Reuters reports, “A total of 61 cargo ships carrying around 1.5 million tonnes of food have left Ukraine under a deal brokered by the United Nations and Turkey to unblock Ukrainian sea ports…” (more)

This Black Sea flow is now sufficient to effectively compete with Australian grain exports to Asia. According to S&P, “when Ukraine started offering wheat in Asia in early-August, payment and banking issues as well as high freight cost and insurance were key concerns. However, as the flow of ships from Ukraine increased, confidence in cargo execution has grown, an Indonesian buyer said.

Ukraine’s principal port at Odesa is less than 100 miles from the frontlines at Kherson (see second map below). The fragility of current flows were underlined on Tuesday when Russian artillery hit grain silos at Mykolaiv (not one of the ports protected under the UN/Turkey agreements with Ukraine and Russia).

September 2 Update: As a quick mention in a round-up of several food-related reports, Bloomberg notes, “The grains sector has reduced a price spike of about 40% in the first half to around 10% this year to Aug. 30 as the Corn Belt harvest approaches. The bias is tilted toward a downward phase of the commodity price cycle into year-end…” Canada’s harvest looks good. US grain production has been mixed. Not bad overall, but not good enough to make up for shortages elsewhere.