Month: March 2022

Shanghai’s asymmetries

As China imposes it’s largest lock-down since the early days in Wuhan, the United Kingdom is shedding the last of its pandemic restrictions. Numbers alone do not explain the distinction. [Updated through April 4, see below.]

According to the South China Morning Post, “Shanghai reported 3,500 new locally transmitted cases on Monday, most of them with mild or no symptoms. More than 10,000 infections have been found through mass testing in the past week – over 9,900 of them asymptomatic.” (More)

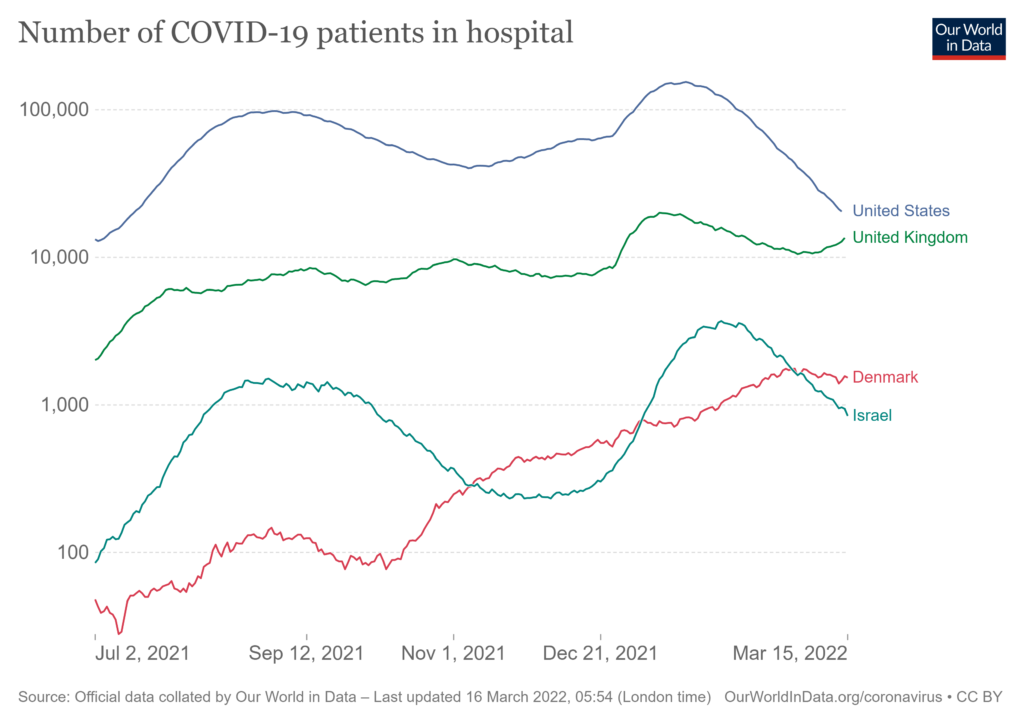
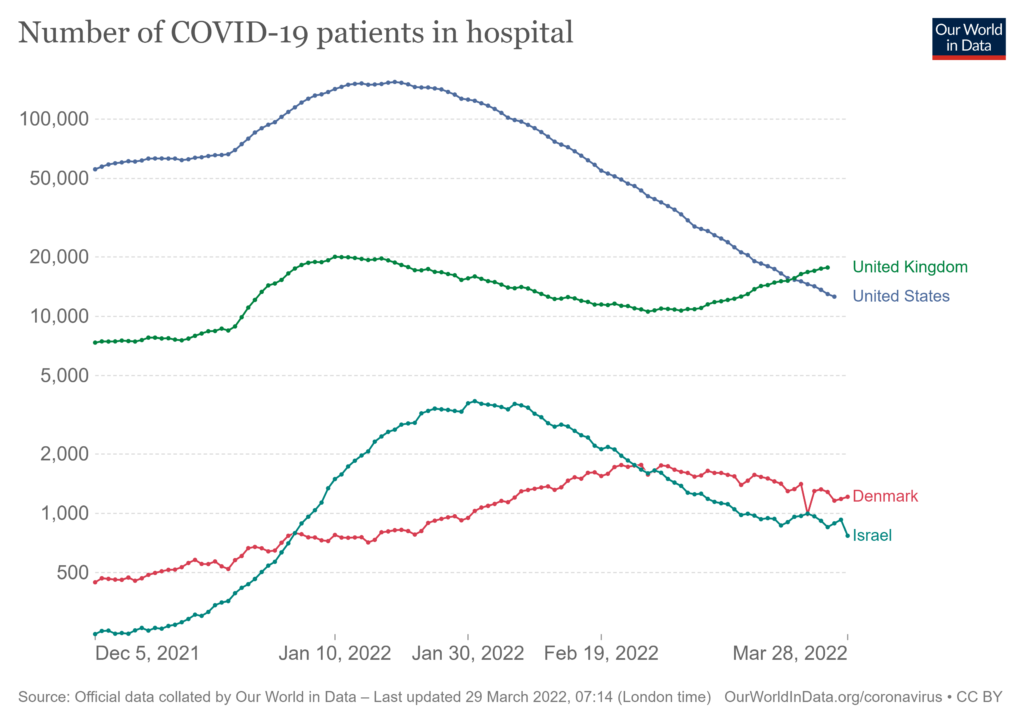
Over the weekend the United Kingdom confirmed more than 215,000 new infections. The recent surge in the BA.2 variant has hit Scotland especially hard. But Scotland’s legal restrictions related to covid were still discontinued on March 21. Wales has since taken similar steps. England began unwinding last month, even as hospital beds were filled about as much as during the omicron surge (see chart below)

China’s legal, political, and cultural context facilitates more rigorous restrictions than the UK. China’s public health demographics arguably justifies more containment. Vaccination rates in Shanghai are close to 80 percent, but Sinovac (CoronaVac) has demonstrated less efficacy against omicron and BA.2 (more). More than 130 million Chinese over age 60 have not been vaccinated. British vaccination rates (with a so-far more efficacious mix of vaccines) have approached 90 percent of the over-sixty population. The United Kingdom has hospital intensive care capacity about one-third larger than China. Different risks motivate different responses.

It is also worth acknowledging that the risk of more virulent mutations persists in China, UK, and wherever transmission invites adaptation.

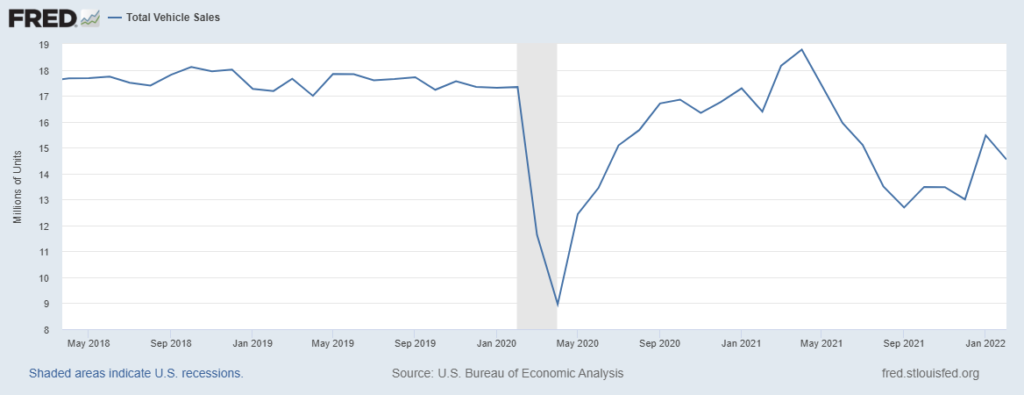
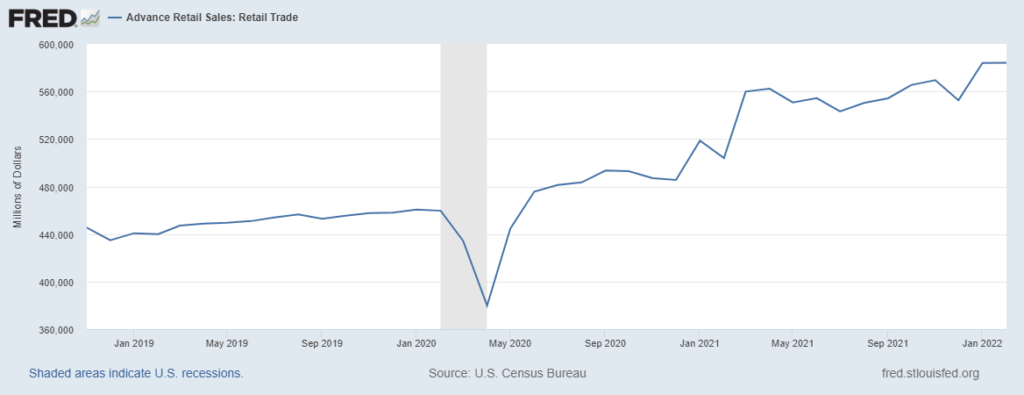
The Wall Street Journal observes, “A lockdown in Shanghai marks another potential setback for China’s export machine, reigniting concerns over the risk of renewed disruption to global supply chains pummeled by the pandemic and war in Ukraine.”  This is possible. There is also evidence that disruptions can be mitigated.

Supply chains prefer — work hard to create — continuous, predictable flows. What we are seeing in China — the world’s largest exporter — is analogous to a three-year-old fascinated with toilet flushing downstairs while upstairs a teenager is in the shower. Big sister may still get clean enough, but she will not be happy. Mix in disrupted financial and commodity flows (especially for petrochemical and agricultural volumes) related to the Russian invasion of Ukraine, some indiscriminate cyber destruction, and a host of other risks and the whole family feels very much on-edge.

March 31 Update: According to the Financial Times: “China’s manufacturing and services activity contracted in March for the first time in almost two years, highlighting the economic strains of the government’s strict coronavirus measures. The official manufacturing PMI, a gauge of factory activity in which a reading of 50 separates monthly expansion from contraction, fell to a five-month low of 49.5. The non-manufacturing PMI dropped to 48.4, its lowest level since August.”

According to Loadstar: “The Shanghai lockdown is playing havoc with Chinese supply chains, driving up inland logistics costs and disrupting shipping schedules…”

April 1 Update: Bloomberg has a long-form assessment of China’s options — and potential implications for the rest of us.

April 3 Update: All of Shanghai is now locked down. According to the Financial Times: “Shortages of food and medicine have left residents in China’s biggest city desperate and frustrated as authorities struggle to gain control of a Covid-19 outbreak.” According to an April 2 report in the Global Times (Chinese language, official Communist Party publication), a new variant of coronavirus is now confirmed as being transmitted in Suzhou, near Shanghai, “The infection was sequenced and compared to the BA.1.1 evolutionary branch of the VOC/Omicron variant strain. No highly homologous sequences of the novel coronavirus genome were found in the database.” (Google translation). Meanwhile in the United Kingdom, last week the coronavirus infection rate reached an all time high (more), without prompting new public health measures. The currently surging BA.2 version of the virus is highly contagious but typically features mild morbidity. Does the high transmission rate increase mutation probabilities? Yes. Britain is betting its “carry on” approach to living with covid is worth the mutation risk (more and more). China has, so far, decided the risks remain too high. But containment costs have also accumulated and are increasing. By Easter BA.2 will almost certainly be surging in many parts of the the United States.

April 4 Update: The Financial Times has a long-form assessment of China’s counter-pandemic policy and practice: “the measures introduced in Shanghai on March 28 highlighted the government’s commitment to a now-globally unique strategy — fine-tuned across outbreaks from Xi’an to Shenzhen — of attempting to completely eliminate local cases no matter the economic and social costs.” Bloomberg is reporting on new mutations (more). This report’s tone and details are cautiously optimistic, emphasizing cautions. Loadstar reports, “Covid lockdowns in China, war in Ukraine and the threat of hyper-inflation are a toxic mix of unpredictability for liner trades, but they have so far not had an impact on container freight rates. Indeed, container spot rates, although trending down, are broadly in line with normal seasonal falls and, moreover, ocean carriers are succeeding in driving-through significant contract rate increases.”

(Re-)construction ahead

Thursday BlackRock’s chairman, Larry Fink, included the following concise assessment in his annual letter:

Russia’s aggression in Ukraine and its subsequent decoupling from the global economy is going to prompt companies and governments worldwide to re-evaluate their dependencies and re-analyze their manufacturing and assembly footprints – something that Covid had already spurred many to start doing. And while dependence on Russian energy is in the spotlight, companies and governments will also be looking more broadly at their dependencies on other nations. This may lead companies to onshore or nearshore more of their operations, resulting in a faster pull back from some countries. Others – like Mexico, Brazil, the United States, or manufacturing hubs in Southeast Asia – could stand to benefit. This decoupling will inevitably create challenges for companies, including higher costs and margin pressures. While companies’ and consumers’ balance sheets are strong today, giving them more of a cushion to weather these difficulties, a large-scale reorientation of supply chains will inherently be inflationary.

Dependencies will persist, but diversification and decentralization can reduce network-wide vulnerability. Trading near-term cost reduction and flow optimization for longer-term strategic resilience will be more acceptable now that existential risks associated with over-concentration have become more viscerally experienced.

How, where, and especially how-much and how-quickly this de-concentration happens will depend on density of demand, velocity of demand, distances between demand and supply, perceived geopolitical risk, access to capital, comparative friction of flows between nations involved, and perceived host-nation regulatory/ confiscatory risk. Price competition, related opportunism, and innovation will continue to stir the pot.

Where Larry Fink and his peers decide to invest — and even more pointedly: not invest — in these demand and supply networks will do a great deal to determine pace and places.

+++

A few hours after writing what’s above I read online at the Wall Street Journal a piece about supply chains become more web-like. Very complementary to what Larry Fink and I are saying. [March 27 Update] More weekend catch-up reading: Exposing Capitalism’s Great Illusion at Bloomberg. This is a helpful, important exploration of a century-plus adventure in economic integration and disintegration. Which way are we leaning today? Tomorrow?

WSJ: Chain Reaction

The Wall Street Journal has produced a video primer on recent supply chain stress. It is fifty-four minutes of well-researched, well- produced insight on sometimes hidden aspects of sociology and technology and their intersections. I have characterized supply chains as “socio-technical systems,” so I am sympathetic. The video is a great companion piece to Arriving Today: From Factory to Front Door by WSJ reporter Christopher Mims. This soon-to-be classic will appear again and again in classrooms nationwide. (And… the critical role of demand is referenced occasionally, but too easy to neglect along the way. Concentration effects are implicitly referenced (e.g., “ports” and “clusters”), but may not be obvious to many viewers. The focus is mostly on US domestic supply chains. This is mostly the story of shelf-stable flows. And, somehow, the producers are not aware of my argument (more and more) that not every instance of disequilibrium between demand and supply should be labeled a “shortage”. But in less than one hour we see and hear much that we really need to know.] Probably worth your time…

Substantive scarcity

There are real risks of insufficient sources. These include:

Lengthening duration, deepening scale, and expanding scope of drought. For example, this year has started very dry in California’s San Joaquin Valley, Sacramento Valley and Central Coast. According to the National Oceanic and Atmospheric Administration, “Many of these areas have experienced record dryness since the start of 2022, which has driven some reservoirs to record low levels and resulted in widespread stream flows and soil moisture ranking below the 2nd percentile. Water availability is a real concern as allocation from the Central Valley Project is likely to be either much reduced or non-existent for many farmers in California’s Central Valley, according to the U.S. Bureau of Reclamation.” (More) Increased demand for water will not make more water, and even prompt the opposite.

Reduced flows of agricultural fertilizers and grain. Drought has reduced crop yields in Southern Brazil and Northern Argentina, the Horn of Africa, and California’s Central Valley. War and sanctions related to Ukraine and Russia threaten to significantly reduce availability of significant proportions of wheat, corn, and sunflowers. Remaining flows will experience– are experiencing — significant price volatility until future global flows can be better anticipated (more). If anything, demand for food is increasing.

Fewer passenger vehicles are being manufactured. Production is down from one-tenth to one-third depending on the market and vehicle category. Errors predicting demand — and ensuring related semiconductor flows — have played an important role in this shortage. So have exogenous factors such as covid-related production cut-backs and earthquakes and trade conflicts and maritime port congestion. For the United States this means that supply of new vehicles has been one-fifth to one-quarter below likely demand for much of the last year (see chart below). At some point car manufacturers will reclaim previous capacity. Then the disequilibrium of demand and supply will transition from today’s “scarce” to “sporadic” as pent-up demand is gradually fulfilled and downstream flows even out.

Differentiating scarce (rare, deficient) from sporadic (scattered, dispersed) flows is a crucial diagnostic step on the way to better balancing demand with supply. Actions based on inaccurate diagnosis almost always result in further disruption of whatever flows are available. Wealth will often pull what it wants even from scarce flows. Effectively managing demand targets and supply speed (velocity) can often mitigate human need while dealing with reduced volumes. Poverty tends to be excluded from flows, experiencing drought even when nearby there is flooding.

Because I work mostly with high-income places and people, my problems more often involve satisfying wealthy wants than existential need. But whether flows are scarce or sporadic or abundant, calibrating push (supply) with pull (demand) is fundamental.

The three examples above share a concentration characteristic. When drought is concentrated in a place with many people or high proportional production, the consequences of scarcity are amplified. When capacity — production or distribution or consumption — is highly concentrated, any disruption — even modest and/or temporary — will often have amplified wide-area consequences. The more dependent on any particular place or piece or process or person or whatever, the more vulnerable the entire network.

Increasing concentration can produce economies of scale and related competitive advantages. But at some point, concentration is always a Faustian bargain (here and here). Systemic diversification generates long-term strategic advantages.

Many late-Twentieth Century supply chains have become demand and supply networks where much more volume is moved much more accurately, quickly, and confidently than ever before. This enhanced fluidity is the result of policy, technology, and processes that reduce friction in discerning effectual demand and completing physical and financial transactions to fulfill what is discerned. More assured pull has prompted significantly more — and better — push.

Over the last thirty years concentration and consolidation have been helpful tools in reducing friction and cultivating flows. Covid, climate change, and war now suggest that too much concentration can self-generate congestion and, with just a little complication, friction-shedding, target-enhancing bottlenecks can too easily become convulsive chokepoints.

Demand persists, even insists

February retail sales were the highest on record, one-fifth above February 2020.  See first chart below.

Despite — because of? — this robust spending, American consumers continue to have significant cash reserves. The M2 money supply in February is very close to late December’s record-setting high. The USA currently has about one-third more cash on hand than pre-pandemic. See second chart below.

Mostly this is due to reduced-spending during the pandemic and “Economic Impact Payments“.  The Personal Saving Rate was much higher than usual from March 2020 until September 2021. Wage growth has also been strong, especially since May 2021. See third chart below.

As a result — regardless of supply chain “shortages” and inflation — many Americans continue to pull very hard on supply.  Inventories remain tight.  Individual products and even entire categories can mysteriously ebb and as suddenly flow again.

This level of demand — and potential demand — is unusual (perhaps not seen since the late 1940s). Current demand is motivating maximum throughput of current production and distribution capacity. But the structure of this demand and prospects for its continuity are uncertain or, at least, product or category or sector specific. Investment in additional production and distribution capacity is strong, but uneven — depending on perceived longevity of current demand.

To resume reliable flows requires reclaiming an improved equilibrium of demand and supply. There is evidence that disequilibrium is not getting worse. There is not — yet — persuasive evidence of equilibrium emerging any time soon.

The China Card

Early this week I was at a meeting where the mostly US crowd seemed mostly unaware of the rising number of covid cases in China and Europe. A few knew about BA.2 in the UK. No one who talked to me was watching China (more and more and more). There seemed to be a consensus that — at least in the United States — covid is contained, even effectively over.

This judgment is premature.

Even if US hospitalization rates can be appropriately demand-managed, the flow consequence of a covid surge in China could make 2021’s global supply chain stress seem like Guns N’ Roses opening for the Rolling Stones. Moreover, viral outbreaks in China will come with a mutation potential that shifts the decibel level (threat level) into KISS, Who, and Deep Purple territory.

In April 2021 this blog identified five strategies for effectively engaging and living fully with covid “for another year — probably two…”: 1) vaccinate, 2) test, trace, and contain, 3) support global mitigation, 4) reduce overall circulation, and 5) avoid interior crowds. This song is still worth singing. Covid continues to dance, even if we are ready to call it a night.

Demand-Supply Dialectics

This is the seventh — and perhaps final — in a series of posts examining supply chain resilience reports released by the White House on February 24.

Most of the “Sectoral Supply Chain Assessments” are grounded in recent challenges, especially pandemic-prompted problems. The energy report is an outlier with much more attention to emerging issues of climate change (more).

Each report tends to be preoccupied with upstream concerns and complications related to sourcing and production capacity.

Each report gives attention (some more, some less) to potential over-concentration of upstream flows. Significant dependence on proportionally few high-volume nodes and channels increases network vulnerability. This could be the most helpful insight identified by the reports — when accurately and meaningfully received.

None of the reports give much attention to the influence of downstream demand on upstream behaviors. Mid-stream is sometimes treated as almost detached from up or down. In my judgment, this tendency fails to reflect fundamental realities.

All of the reports are mostly examples of the public sector — really just the federal sector — talking to itself. This can be helpful, especially if this internal process is conducive to ultimately involving other sectors in well-conceived shared conversations. [Conducive: connect, bring together, collect, join, assemble]

As a collection, the assessments are culturally coherent (reflecting a generally shared understanding of problems and problem-solving-processes), but strategically inconsistent, maybe even strategically incoherent. Key connections between the five policy documents examined here (also see note below) remain obscure or simply absent. This is not uncommon (or even unexpected) from a year-long interagency process. But supply chain practitioners, network scientists, and even some public servants will be annoyed by the interstitial opportunities lost in the process.

I want to avoid damning with faint praise. I recognize earnest, expert effort expended on a very difficult problem-set during a troubled time. I know the challenges of interagency policy-making well-enough to envy no one involved therein.

I also discern in these reports an implicit, fairly consistent operating thesis that would benefit from more explicit consideration. Behind the references to resilience are concerns about scarcity or shortages or insufficiencies. Medical personnel operating without Personal Protective Equipment and car factories closing because of unavailable parts and empty shelves where meat or soup or toilet paper have usually appeared are all recent realities. But in the vast majority of such cases, supply has not been scarce (as in rare, diminished, or poor), rather supply being pushed has often increased, but demand has pulled even faster.

Demand and supply networks (worthy of the designation) organize around demand to achieve a rough equilibrium of pull and push. The give and take of demand and supply is tangibly interdependent (and mirrored in more fungible financial flows). In mature-capitalist high volume, high velocity networks, scarcity is typically more relative than real. A disequilibrium of demand and supply may well reflect a shortage of what is wanted by producers or consumers. But this need not reflect reduced supplies. In early March 2022 grocery stock-outs in the United States are most often the result of reduced capacity to load and drive delivery trucks, not reduced production. In March 2020 grocery stock-outs in the United States were the result of a doubling or more of demand in a two week period. Swift shifts in demand capacity or distribution capacity are much more frequent culprits than lost production capacity.

Disequilibrium can certainly be caused by scarcity. A drought (literal or metaphorical) may unfold into famine for those unable to relocate closer to necessary flows (or attract such flows towards them). But it seriously complicates problem-solving to treat disequilibrium caused by flooding as if it was the result of drought.

Rather than assume scarcity, we should seek to discern disequilibrium as an expression of dynamic interdependencies encompassing both demand and supply, density and distance, differentiated durations, capacity and capability, pull and push. Supply and demand interact to create flow, assimilating aspects of both supply and demand.

On Tuesday a private-public group convened in the Old Executive Office Building. Around the table were enterprises, such as Albertsons, Target, and True Value, that focus on consumer demand. Others, including Land O’Lakes, focus on supply. Several at the table concentrate on moving supply toward demand by water, air, or land. Midstream — long-distance to last mile — was especially well-represented. These organizations have agreed to start-up a “first information exchange that will support a more resilient and fluid supply chain.” The voluntary collaborative effort is branded “Freight Logistics Optimization Works” or (of course) FLOW. According to the White House, the meeting participants discussed,

… greater data transparency across the supply chain and how this would benefit not only their respective companies but also the system more broadly, cutting waste and reducing costs for consumers. Participants acknowledged the current system is underperforming and needs greater investment and more collaboration in creating ship to shelf visibility into the primarily private-sector owned supply chain. A more reliable, predictable, and accurate information exchange about goods movement is the hallmark of a globally competitive 21st century goods movement chain and is especially important for small- and medium-sized businesses who lack visibility into the current system. (More.)

This is an early step to facilitate ongoing communication across the various phases of flow, allowing collaborators to observe and engage a more comprehensive context — something close to the full watershed of flows — not just near-term consequences of near-by discharges. In this way, it is hoped, individual participants will be able to adapt earlier and more effectively — even collaboratively — to factors that could disrupt flow.

There are plenty of reasons for FLOW to fall apart before having a chance to demonstrate value. There are even more reasons to hope the initial participants are soon joined by many others. Enormous value is possible if participants can work through tough technical issues, treacherous competitive dynamics, and complicated regulatory prospects. FLOW is a co-laboratory where all the contending, pending perceptions set out in the supply chain assessments can be empirically and practically engaged — clarified, corrected, and even confirmed.

+++

Still to come is a brief note on the sixth Sectoral Supply Chain Assessment by the Department of Defense. It will appear below at some future date (maybe this weekend).

March 19, 2022 Update:

Among the February 24 Sectoral Supply Chain Assessments is DoD’s “Securing Defense Critical Supply Chains.” Of the six One-Year assessments delivered, this is arguably the most sophisticated with balanced attention to critical needs, systemic capacity, production/ distribution vulnerabilities, and aggregate demand. For those involved in the Defense-Industrial complex, this is a helpful analysis and set of recommendations. In my judgment, however, even with a $700 billion-plus budget and admittedly contentious, complex demand signals, DoD’s planned procurement supply chain is substantively differentiated from demand and supply networks organized around mostly unplanned purchasing decisions by tens-of-millions of independent consumers. For example, Americans spend more than double the Defense budget on Food At Home and another double on Food Away from Home. Supply chain thinking is relevant to military missions — as dramatically demonstrated in Ukraine. But there is a command-orientation to the Defense supply chain that is antithetical to the highly competitive demand-orientation of high-volume, high-velocity commercial ecosystems. This is why I have not given this assessment the same attention as to the other five.

BA.2: Blip or Bigger?

Scotland is experiencing a significant increase in covid cases and related hospitalizations. The BA.2 omicron sub-variant is being blamed (in Denmark as well as elsewhere). Spread to Wales and England is now being observed. For several months this conversation has tracked hospitalization data in Denmark, Israel, UK, and USA (prior example). Below are current demand patterns for hospital-based covid care. It is not yet time to confidently project the scope and scale of another surge here or there, but these shifts are worth close attention.

Information Flows

This is the sixth post in a series examining the supply chain resilience reports released by the White House on Thursday, February 24.

The Departments of Commerce and Homeland Security collaborated on an Assessment of the Critical Supply Chain Supporting the US Information and Communications Technology Industry. Particular attention is given to 1) Printed Circuit Boards (PCB), 2) Fiber Optic Cable, 3) PCB Assemblies and Electronic Assemblies, 4) Routers, Switches, and Servers, and 5) LCDs/Displays.

The report includes this explanation of strategic context:

Over the past 30 years, the ICT [Information and Communications Technology] industrial base has evolved from being vertically integrated to being one that is highly outsourced, with most major brand companies outsourcing nearly every step of and input into the manufacturing process. Beginning in the mid-1980s, original equipment manufacturers (OEMs) in the computer industry, such as IBM and Cisco, that traditionally managed end-to-production services, began outsourcing manufacturing and software development to specialized technology companies, such as Intel (microprocessor chips) and Microsoft (operating software), and to contract manufacturers. Contract manufacturers are companies that perform manufacturing services for other companies on a contractual basis. To produce a computer, these OEM companies could no longer design and manufacture their own computer chips or develop operating system software, but instead, so that their equipment was compatible with everyone else’s, outsourced these needs to companies specializing in those products, such as Intel and Microsoft. This process, called vertical specialization, led ICT OEMs to focus on design and innovation of new and improved technologies. Over time, OEMs have increasingly adopted this business model with many companies eliminating all manufacturing capabilities. These OEMs now add value primarily through research and development, product design, and marketing new technologies to their customer base. By 2006, leading computer companies, including Dell, HP Inc. (formerly Hewlett Packard), Acer, and Apple, had completely outsourced their notebook manufacturing operations. The U.S. ICT industry reflects this evolution of the OEMs. The United States is the world’s leader in technology innovation, but most hardware manufacturing takes place in other countries. (Page 15)

The authors argue that as a result of this evolution, the ICT industrial base in the United States is not an ecosystem. The United States is an important source of downstream ICT demand and upstream intellectual/financial investment in ICT. But this domestic push and pull depends almost entirely on sourcing, processing, manufacturing, and transportation capacity outside the United States. If I am accurately reading between-the-lines, the authors may even be skeptical that the global ICT network of demand and supply fits the definition of an ecosystem. ICT manufacturing capacity is, potentially, so specialized by function, consolidated by enterprise, and concentrated by geography that it is much more an engineered network than a complex adaptive system. This is a provocative possibility. The February 24 report implies much more than it claims in this regard.

Even if the ICT industrial base better reflects the physics of the factory than the ebb and flow of watersheds, it is a huge and fantastically complicated factory. The report outlines:

A large multinational organization can have hundreds of tier one suppliers from which it purchases components directly. In turn, each of those tier one suppliers relies on hundreds of tier two suppliers. The whole supplier network for a large company can include tens of thousands of companies around the world when the deepest tiers are included in the network. For many companies, especially small -and medium-sized businesses, it is very difficult, if not impossible, and costly to obtain an accurate and complete picture of an organization’s entire supplier network. Making this effort even more difficult is the fact that a company’s suppliers can change on very frequent basis. Communications Equipment companies are one of the industries that have the largest number of tier one suppliers, with 2.2 times the industry median. (Page 60)

Eight recommendations are offered to increase the supply chain resilience of the ICT industrial base. I perceive that at least five of the eight (and potentially all eight recommendations) are intended to, first, reduce the current geographic concentration of ICT production capacity and, second, re-shore significant production capacity to the United States. There is a particular concern for reshoring manufacturing of PCBs and related assemblies. I do not recognize much emphasis on reclaiming a global or domestic ecosystem featuring significant diversity and independent self-organization.

+++

This series of posts started with acknowledging my bias regarding Supply Chain Resilience. For my principal purposes, the ICT sector is fundamental to how digital transactions and inventory management — and related network pulls — are organized and communicated to reflect demand. The Departments of Commerce and Homeland Security — appropriately — are concerned about other purposes. I am concerned mostly with facilitating downstream demand. They are concerned (mostly) with ensuring upstream supply of ICT capacity for my purposes and other purposes. These are complementary, not competitive angles. But it is also worth noting the strategic expanse extending between these two priorities.

Pushing, pulling, and potential fraying

Several updates through March 17 included below.

Between late January and late February evidence accumulated of decreased congestion, friction, and stress in US and global supply chains.  The US inventory to sales ratio improved more between November and December than at any time since the deep declines of Spring 2020 (fingers crossed for the January ratio due next week). The ginormous chokepoint at the Ports of LA/Long Beach is much less congested than Autumn 2021 (more). The Global Supply Chain Pressure Index researched and published by a team at the Federal Reserve Bank of New York, suggests that current constraints are similar to those in Spring 2021 — at the start of pandemic demand surge. The Fed’s researchers write, “Overall, we note that supply chain pressures have moderated relative to the peak reached in December 2021, but these pressures have remained at historically elevated levels through February. Going forward, there is the possibility that the current heightened geopolitical tensions might lead to more elevated supply chain pressures in the near future.”

“Geopolitical tensions” is, of course, code for Russia invading Ukraine and all the treacherous turmoil unwinding therefrom. So far actual reductions in commodity flows have been modest (e.g., natural gas from Russia through Ukraine to Western Europe). But the dramatic disruption of financial flows caused by sanctions and the prospective loss of spring planting in Ukraine all point to serious reductions — or at least complications — in availability of Russia’s oil (about 11 percent of global production) and both Russian and Ukrainian wheat (about 30 percent of global production). (More ) Significant proportions of global output for nickel, palladium, aluminum and much more are caught in the cross-fire (more). Duration of and distance from hostilities will influence who is cut off how much from what. The potential parameters of both duration and distance are deeply uncertain.

Vulnerability can be measured. Threat not (yet?) so much, so risks emerging from these geopolitical tensions remain ambiguous.

Another prospective threat to global supply chains: Is Hong Kong’s weeks long surge in coronavirus hospitalizations a leading indicator for what’s next across the People’s Republic? (More and more.) Changchun has been locked-down and Shanghai is seeing more covid cases than ever before (more). There is cause for some concern that China’s considerable success in minimizing transmission of the coronavirus could, paradoxically, increase population vulnerability to more contagious recent variants (and those to come).

So far, Beijing’s approach to fighting covid has, arguably, preserved economic productivity by limiting the scope and scale of lock-downs (and transmission and disease and death). But if there are wide-spread simultaneous breakouts of disease, the current “Dynamic Clearing” process would quickly amplify network-wide constraints. If Dynamic Clearing is superseded there is also a risk of significant disease penetration of China’s workforce and reductions in flow. There are no risk-free options. Whatever is chosen (or happens), “China’s big leap may affect the rest of the world as well. Unleashing COVID-19 on a population of 1.4 billion means a lot of people “will be brewing the virus,” says Gabriel Leung, HKU’s dean of medicine. That will provide ample opportunity for new variants to emerge. “It’s not just a national problem, it’s actually a global issue,” according to a March 1 report in Science.

Likewise for a significant loss of flows to or from China. According to Reuters, “For all of 2021, total [China] exports rose 29.9%, compared to a 3.6% gain in 2020. Imports [to China] for the year gained 30.1% percent, after falling 1.1 percent in 2020.” China is the source for 17 to 18 percent of global economic activity.

+++

March 14 Updates:

Foxconn, Apple supplier, shuts China plants as covid outbreaks grows (Financial Times) “The lockdown in Shenzhen is scheduled to last for six days and could compound disruptions to global supply chains that have contributed to rising inflation in the US and Europe.”

Russia-Ukraine war threatens wheat supply (Wall Street Journal): “Wheat stockpiles were already running low and prices were the highest in years thanks to two years of poor growing weather when Russia’s attack jammed up Black Sea trading and endangered nearly a third of the world’s exports. The invasion prompted fears of food shortages in countries fed with imported grain and pushed prices to new highs.”

March 15 Updates:

Druzhba oil pipeline continues to supply Russian oil to Central Europe (Financial Times) “Russia’s state-owned Transneft, which operates Druzhba, aims to deliver roughly 914,000 b/d to Europe down the pipeline in 2022, of which 261,000 b/d will flow to Poland and 388,000 b/d to Germany, according to S&P Global. Transneft said flows via the pipeline were continuing. In total it provides a quarter of Germany’s crude oil.”

Shenzhen lock-down will impact US ports (Bloomberg) “The number of container vessels waiting to berth in the eastern city of Qingdao has climbed to 22 from 9 just a week ago… and the queue is also growing at the biggest port in Shanghai… This will affect the U.S. in the next month or so, because fewer vessels will leave for the West Coast…  And if a big surge of cargo into the Los Angeles-area ports follows once restrictions are lifted, it could seize operations already stressed by equipment dislocation, labor shortages and congestion on the docks.”

March 17 Updates:

China lock-downs cause supply chain shocks (Financial Times) “China is digging itself into a deep hole with its zero Covid policy,” said Olaf Schatteman, a supply chain expert at Bain, the consultancy. “As the restrictions are hurting suppliers and logistics operations, companies are moving beyond containing the current crisis and towards diversifying production locations, undermining China as the supply chain hub of the world.”

Crude oil capacity continues to be constrained (S&P Global) Prices are volatile. Loss of Russian flows are expected to hit hard in the next few weeks. “Supply losses of this magnitude would be more than enough to keep the market in deficit for at least the next two quarters…” The IEA expects a long-term loss of more than 1 million barrels per day of global refinery outputs. But US crude flows and inventories are strong. Global demand may be easing. US crude oil production exceeds domestic demand. US refineries have recently operated at less than 90 percent capacity. US domestic fuel supplies are in rough equilibrium with domestic demand. Global disequilibrium of demand and supply will continue to prompt domestic price increases (though potentially at a rate less sharp than anticipated last week). (More)