Month: January 2023

Transatlantic diesel dynamics

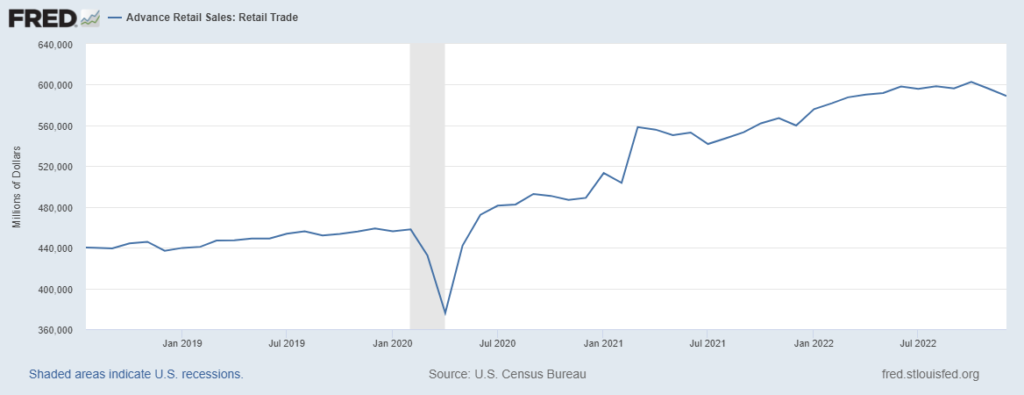
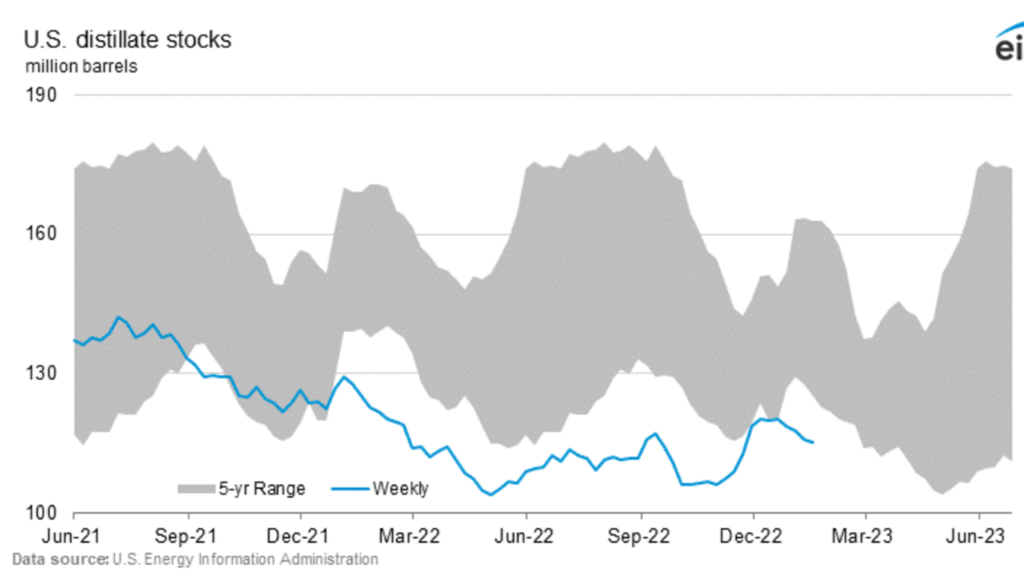
US diesel inventories are still recovering from reduced refining operations in late December. Please see chart below for levels as of January 25. (Tomorrow EIA will give us an update, but I will be airborne and offline for a few days.)

On February 5 a new set of European Union sanctions — including a ban on importing refined petroleum products from Russia — will be implemented. It was anticipated that this would prompt a spike in diesel imports from the United States. Not yet. (Fortunately for US diesel stocks and prices.)

According to S&P Global:

Counter to market expectations, Americas clean tanker freight rates have plunged ahead of the upcoming EU ban on Russian oil product deliveries to Europe, amid limitations to supply and demand of diesel. This comes as demand from Europe has yet to significantly materialize for US Gulf Coast barrels, with Russian product still traveling to Europe at significant levels and amid low US diesel export volumes. The US Gulf Coast-to-UK and Continent diesel route is showing pronounced losses. Platts, part of S&P Global Commodity Insights, assessed it at 75 worldscale — just $17.79/mt — Jan. 27, down 78% from its recent peak at 345 worldscale Dec. 2, when a strong pull for vessels from the USGC to Latin America resulted in tight tonnage on the Gulf Coast.

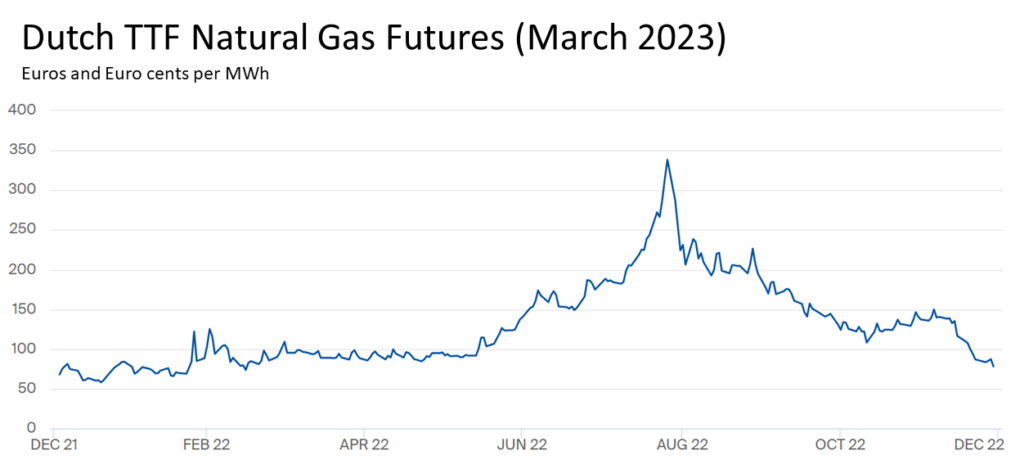
According to a mid-January report by S&P Global, Russian diesel still made up more than one quarter of Europe’s total 1.69 million b/d of imports from January 1-18. US exporters may need to wait until last-minute pulls on Russian diesel subside. Diesel flows (and prices) have also moderated as EU LNG inventories have increased (more).

+++

February 3 Update: For the week ending on January 27, the EIA reports an increase in US diesel inventories, rising from 115.3 million to 117.6 million barrels. Gulf Coast inventories increased from 38.4 million to 41.4 million. Some of this will soon be distributed up the Colonial Pipeline and by barge or ship to other regions and nations.

US consumption

Fourth quarter real US GDP was strong, better than expected… especially given the decline in real consumption expenditures in November and December.

According to the Bureau of Economic Analysis, during the fourth quarter inventories increased “led by manufacturing (mainly petroleum and coal products as well as chemicals) as well as mining, utilities, and construction industries (led by utilities).” Inventories have also been increasing in many consumer sectors according to other analysis (here and here).

GDP analysis recognizes the potential value of inventories. And… increased retail inventories — especially at Christmastime — could signal a potential slowdown in demand. Today’s abundance may be tomorrow’s surplus. And… the inventory to sales ratio is still well below typical pre-pandemic levels.

This space gives sustained attention to US spending on food (please see the inflation-adjusted pattern in the chart below). Low unemployment, stronger wage growth, and past savings (aka excess savings) continue to support robust grocery purchases (and eating out). But real grocery consumption has now been flat for six months, low unemployment does not mean high employment, and December (of all months) saw an interesting uptick in the current personal saving rate (here and here).

It seems to me that pull patterns are increasingly reforming around pre-pandemic dynamics. There is less volatility, so more predictability. Pull is settling into vectors that push can usually fulfill. Demand and supply are much closer to equilibrium — and push can flex to follow marginal shifts in pull — up or down.

US freight resilience

Last week J.B. Hunt released its 2022 fourth quarter and year end results. The Wall Street Journal reported:

Slowing shipping demand helped push fourth-quarter profit at J.B. Hunt down 17% from the same quarter the year before and revenue growth fell short of expectations as retailers pulled back on inventory restocking and consumer spending sagged during the traditional shopping season heading into the holidays. Operating revenues at the freight bellwether rose 4% in the last three months of 2022 over the year before to $3.65 billion, the company said Wednesday, but freight-related revenues excluding fuel surcharges were off about 3% from the fourth quarter of 2021.

During last week’s analyst call J.B. Hunt’s CEO said, “We have had good signals from our customers about Q2 starting up back to a more normalized or having a more normal environment…” What does normal mean in the context of the US freight market?

Below is a chart based on a a US DOT freight transportation services index that uses a 2000 baseline (this was updated yesterday through November 2022). After about twelve months of strengthening, the index has experienced sharp losses since a very good September 2022. December will probably continue down… which will bring the index back to its immediate pre-pandemic levels.

The second chart below is a more narrowly scaled index focused on freight expenditures and volumes captured by Cass Information Systems. This angle of observation combined with the longer duration perspective displayed suggests that if you carry freight, it helps to make friends with volatility. The slope of the current curve over the next three months will matter a great deal. But right now — in the context of the last thirty years — we still have strong flows. Inflation — and especially higher fuel costs — are strength-sapping. But if fuel costs are contained, overall inflation eases, and consumer demand does not crater (lots of ifs there), J.B. Hunt’s hopes for the first half may not be in vain.

The third chart below may reinforce this vanity. Spot rates (not inflation adjusted) are, at least, not falling as sharply as the index numbers might suggest (more and more). Freight is very responsive to consumer behavior. As always, pull shapes push. This morning FreightWaves is reporting, “Looking at the Outbound Tender Volume Index (OTVI), truckload demand is still anything but reliable as it follows no historical pattern entering 2023. While the situation may have looked better than expected coming out of the holidays, the market appears to still have room to fall for both contract and more so for spot freight.”

If pull begins to increase again, current freight capacity is ready. If pull stabilizes there is likely to be a gradual reduction in top-line capacity. If pull seriously slows, historically there has been a tendency for freight capacity to lag higher and then dive deeper. I don’t have any confidence regarding which way we will go this year. But as suggested by J.B. Hunt’s CEO, by the end of the second quarter we should have a much better sense of direction.

US retail sales

December retail sales extended November’s decline (see chart below). According to the US Census Bureau, “Advance estimates of U.S. retail and food services sales for December 2022, adjusted for seasonal variation and holiday and trading-day differences, but not for price changes, were $677.1 billion, down 1.1 percent (±0.5 percent) from the previous month.” But as the chart demonstrates, retail sales remain almost one-fifth higher than pre-pandemic patterns. December sales of appliances and electronics were lower than last year. Furniture, sporting goods, and automobile sales were comparatively slow. Not adjusted for inflation, grocery sales were slightly up. Year-end holiday celebrations supported continued spending on eating and drinking away from home. (More and more.) Given the historically strong — but softening — demand, the very slightly improved inventories to sales ratio suggests how supply chains are still less robust than pre-pandemic.

Rechecking vital signs

Here again is my irregular update on five subsurface indicators of supply chain fitness that may help us anticipate the next six months or so.

Southern Hemisphere Agricultural Production: Argentina’s crops are in trouble (more). But Brazil is expecting bumper crops, especially of soybeans (more). Argentina is even buying from Brazil to fulfill its domestic needs. Western Australia crop yields are pushing that nation’s wheat exports toward an all time record. (Even while Ukraine’s flows slow and US wheat exports are less price competitive.)

Global Diesel Demand, Production and Price: Reuters reports, “European traders are rushing to fill tanks with Russian diesel as the clock runs down on a Feb. 5 European ban expected to tighten supplies, redraw global shipping routes and increase price volatility.” (more and more). US diesel stocks have been slightly lower, especially as exports respond to European demand and freezing weather constrained end of year production. Global flows of refined product — including diesel — are being supported by Russian oil being processed by India and China. S&P Global reports, “With India becoming the largest buyer of Russian crude in late 2022 and China posting close to double-digit growth in Russian inflows over January-November, refiners in South Korea, Japan and Thailand are finding it easier to procure term and spot crude supplies from Middle Eastern producers…” The February benchmark price for European diesel is moderately higher, off a low early January starting position (see chart below).

Covid Hospitalizations (and mutations): While there is a “new” highly transmissible variant making the rounds, for many nations hospitalizations have fallen from a New Years peak. The situation in China is emergent. Please see here for several updates from January 5 until today. My best guess is that by this time next month (post-Lunar New Year) we will have a more confident sense of China’s health outcomes. The implications for global health — good or bad — might take a few weeks more to confirm (and mutations are ubiquitous). See January 20 Update below.

China’s Export Volumes and Value: As reported in my end-of-year update China’s exports have declined considerably in 2022. December results were almost ten percent below 2021 as valued in US dollars. Earlier today China’s National Bureau of Statistics confirmed an accelerated decline in population plus comparatively anemic 2022 GDP growth of 3 percent (more and more and more).

North American Electricity Supply and Demand: The Christmas eve crisis that impacted several US electric utilities has continued to resonate (more and more and more). There were significant financial costs to fulfill higher-than-expected demand (more). Extreme weather in California has reinforced concerns. At the end of November I wrote regarding grid continuity, “The worse this winter’s weather, the more cause for worry.” But even I was surprised to see PJM — and the Eastern Interconnect — experience such a very close call.

Food and fuel flows are doing much better than widely expected just three months ago. More evidence is needed before assessing covid trends. China’s economic performance confirms the slow-down in global goods and wealth flows. Recent experiences of the North American grid reflect our amplified risks as legacy infrastructure and transitioning from fossil fuels encounter amplified extreme weather. In terms of current Supply Chain Resilience we have robust and resilient flows with plenty of early warning signs for mitigation investments.

+++

January 20 Update: Bloomberg reports, “The sudden dismantling of China’s Covid Zero restrictions in December means hundreds of millions of people are headed home for the Lunar New Year holiday for the first time since 2019. The crush of travel risks supercharging the world’s biggest Covid outbreak, spreading it to every corner of the country… ” (More and more)

Torsten Slok talks supply chains

As regular readers (or even occasional readers) know, I am biased toward demand. In my experience contemporary high volume, high velocity supply chains reflect and serve demand. Sustained effectual demand shapes supply capacity. Where effectual demand can be communicated, effectual supply will flow — perhaps with difficulty, perhaps with stubborn delays, but push follows pull.

I have argued (here and here and here and here) that the most severe supply chain problems have been rooted in extreme or volatile or weird — and often unsustainable — demand. I perceive that since the second half of 2022, most (but not all) of this extremity, volatility and weirdity has been squeezed out of the system.

I am not alone in considering these factors. I especially appreciate the work of the Federal Reserve Bank of San Francisco on related issues. Please see a summary and recent update here.

Yesterday on Bloomberg Surveillance, Torsten Slok, Apollo’s chief economist, addressed the potentially vital implications of those weirder supply constraints still echoing within certain chords of global demand — especially pricing. It is a bravura performance. I am looking for a transcript that will support a more detailed translation and exegesis. Until then please click on the image below. This takes you to the full show, please advance to about the 1 hour 14 minute 48 second mark. The first half and final tenth of this interview is especially relevant to Supply Chain Resilience.

PJM Problems: Demand and/or Supply?

PJM is a regional transmission organization (RTO) that coordinates grid operations for Ohio, Pennsylvania, New Jersey, Delaware, Maryland, West Virginia, District of Columbia, and significant parts of Virginia, Illinois, Michigan, Kentucky and North Carolina.

About 4AM eastern on December 24 I sent several clients personalized messages that included something like:

This morning’s PJM Stage 2 emergency (more) is the result of an unprecedented (and unpredicted?) spike in demand, prompted by this bomb cyclone’s geographic scope, speed, and extraordinary rates of temperature change.  In my judgment, PJM is probably the most operationally capable of the North American reliability operators.  It also serves some of the densest demand.  Dense demand tends to be more volatile — and this bomb cyclone is causing a rate of change in power demand that will challenge system capabilities. 

Below is a screen capture of the near-real-time chart that I spent two days watching at least as carefully as any magi watched any star.

The Friday night before and early Saturday morning of Christmas Eve is not the most promising moment for an outsider to figure out what is happening (and not happening) with grid operations anywhere. But what my sparse contacts and sources were telling me was also what Bloomberg reported, “Demand soared more than 9 gigawatts above forecasts Friday evening — much faster and higher than anticipated. That’s the equivalent of about 9 million homes just popping up on the grid on a typical day.”

Yesterday PJM reported out its own After-Action (please see 32 screen PowerPoint). In the PJM report, I perceive the demand component — and especially the rate of change aspect — is confirmed. PJM also provides very helpful background on the push to fulfill pull… and several problems that constrained push.

As reported by S&P Global,

PJM said it called over 155,750 MW into the operating capacity for Dec. 23. Based on generator availability data, “we believed we had almost 29 GW of reserve capacity available to absorb load and generation contingencies and to support our neighboring systems,” the grid operator said. Since Capacity Performance was implemented, PJM has typically seen a forced outage rate of about 5% with that going up to about 10% in extreme weather but the forced outage rates observed during this event “grossly exceeded” those averages, Bryson said. Capacity Performance requires that generators must meet their commitments to deliver electricity whenever PJM determines they are needed to meet power system emergencies and generators that exceed performance commitments will be entitled to funds collected from generators that underperform. “Generation outages were unacceptably high, and they occurred at the worst possible time for system operations,” he said. On the evening of Dec. 23, generation outages reached 34.5 GW and on the morning of Dec. 24 they reached 46 GW, or 23.2% of PJM’s total capacity, the grid operator said.

A full assessment is expected by mid-April. The final report will clearly — appropriately — go beyond the demand or supply question, both demand and supply issues are involved. But for broader purposes of Supply Chain Resilience, I suggest attention to demand’s rate of change is especially important because this risk accelerant is too often discounted or neglected.

Even robust high volume, high velocity supply systems will usually lag sudden and sustained demand spikes that exceed one-fifth of credible capacity. Sudden and sustained demand spikes are almost always associated with unusual, specifically unpredictable, factors that will complicate supply capacity. (Please also see toilet paper, canned chicken soup, N95 masks, semi-conductors, gasoline, and more.) But what cannot be specifically predicted can be strategically anticipated.

Update on US Diesel Stocks

A late December deep freeze — even along the Gulf Coast’s refinery row — resulted in reduced petroleum processing. But production quickly came back strong. Earlier today Reuters reported:

The U.S. Energy Information Administration (EIA) said crude inventories jumped by 19.0 million barrels last week, the third biggest weekly gain ever and the most since stocks rose by a record 21.6 million barrels in Feb 2021. Last week’s increase came as refiners were slow to restore production after a cold freeze shut operations in late 2022.

There has been particular concern regarding diesel stocks, especially for the mid-Atlantic and New England. But even these inventories have continue to build (see chart below for the mid-Atlantic).

Managing Risk

[Updates Below] Tuesday, January 3, the World Health Organization’s Technical Advisory Group on Virus Evolution (TAG-VE) met to review new information on SARS-CoV-2 variants. Here are excerpts from the January 4 TAG-VE statement:

As of 3 January, 773 sequences from mainland China have been submitted to the GISAID EpiCoV database, with the majority (564 sequences) collected after 1 December 2022. Of those, only 95 are labeled as locally-acquired cases, 187 as imported cases and 261 do not have this information provided. Of the locally-acquired cases, 95% belong to BA.5.2 or BF.7 lineages. This is in line with genomes from travellers from China submitted to the GISAID EpiCoV database by other countries. No new variant or mutation of known significance is noted in the publicly available sequence data… WHO will continue to closely monitor the situation in the People’s Republic of China and globally and urges all countries to continue to be vigilant, to monitor and report sequences, as well as to conduct independent and comparative analyses of the different Omicron sublineages, including on the severity of disease they cause.

Surveillance capabilities in most nations range from partial to pitiful. Accordingly this blog has long focused on covid hospitalizations as the most meaningful (if lagging) indicator. Reuters reports, “China’s COVID-19 data is not giving an accurate picture of the situation there and underrepresents the number of hospitalisations and deaths from the disease, a senior official at the World Health Organization said on Wednesday.” Today, January 5, China released new hospitalization data. If anything, the results confirm widespread skepticism regarding official veracity.

A “new” variant is a source of increasing concern in the United States. Here is how XBB.15 was explained in an American Medical Association January 4 update:

Scientists are really still in the early stages of studying that XBB subvariant and that even newer version, the XBB.1.5. Preliminary studies have shown that the newer version is adept at evading existing immune response and at binding to human cells. Both XBB and XBB.1.5 are recombinants of the BA.2 variant. And according to CDC data, over 40% of COVID cases in the U.S. are now caused by the XBB.1.5 subvariant. And that’s doubled from the previous week. And if you look at the data in the Northeast, about 75% of confirmed cases are reported to be XBB.1.5. So these appear to be very contagious. I think the good news so far is there’s no indication at this point that it causes more severe illness than the other Omicron variants do. I think experts do agree that getting that bivalent booster dose to bolster your immune system against these newer subvariants is the most important thing to do and we’ll definitely continue to watch as things progress with these variants.

The Financial Times explains:

XBB.1.5 is informally called Kraken after the mythological sea monster, one of a number nicknames that scientists have applied “to help people keep track of the ever-growing variant soup”, said Ryan Gregory, an evolutionary biologist at Canada’s University of Guelph in Canada. “There are now more than 650 Omicron subvariants.” Kraken is descended from XBB or Gryphon — itself a hybrid of two Omicron BA.2 descendants. A key mutation enables XBB.1.5 to transmit rapidly between people by evading antibodies conferred by previous infection or vaccination, while at the same time binding more tightly to human cells. “While there’s still much to learn about this variant, it doesn’t have the look of a ‘scariant’,” said Eric Topol, professor of molecular medicine at Scripps Research in California, referring to the term he coined for strains that sound scary but are not really dangerous. “This one is the real deal and we’re betting on our immunity wall of infections, vaccinations, boosters and their combinations to help withstand its impact,” he added. (More)

Meanwhile California is flooding in yet another example of increasingly extreme weather, the winter war worsens, political dysfunction persists, global effectual demand declines, immediate threats of hunger and violence drive desperation, displacement, and large-scale human migration…

Risks abound. Threats proliferate. Vulnerabilities escalate. Consequences multiply. Our data is incomplete and too often unreliable.

Because this is our reality, we can benefit by being widely observant, avoiding or resisting over-reaction, while fully prepared to probe, decide, and actively care for ourselves and others as prudently, creatively, urgently, patiently, and persistently as possible.

+++

January 6 Update: Linked via “More” at the close of yesterday’s FT quote (above) is a Bloomberg piece on XBB.1.5 (Kraken). This morning that story is listed at the top of the “most read” on the Bloomberg website… encouraging evidence of decision-makers being widely observant.

January 11 Update: Based on what I can see and hear out of China, worst-case probabilities related to coronavirus mutations are easing (here and here and here and here). Today the economic horizon seems to be opening to improved demand and supply from China, with significant implications for supply chains.

But my ability to see and hear is too constrained to be confident. The viral pot could still boil over, especially in the aftermath of the current Lunar New Year holiday. From a supply chain resilience perspective, premature risk discounting could still unfold into flow disruptions, volatility, and destruction (more and more).

Writing in the Financial Times, Robert Armstrong and Ethan Wu comment:

The bear case is rather less precise, but comes down to reopening being very hard, and very hard to predict. An even bigger second wave of Omicron cases, a politically intolerable death toll that prompts lockdowns, a collapsing healthcare system, a deadlier variant — any of these could blow apart market optimism. An on-again-off-again approach to lockdowns would crush the economy and shatter markets’ newfound confidence.  

Humility is a very practical virtue, especially for 2023.

January 13 Update: In late November China began to re-open. December’s economic momentum reflected prior counter-covid constraints. (So will January and, probably, February. After that?) One of my five “vital signs” for global supply chain fitness is the volume and value of China’s exports. According to this morning’s Financial Times, “China’s exports suffered the sharpest decline in almost three years in December… Exports declined 9.9 per cent year on year in dollar terms in December, according to official data released on Friday by China’s general administration of customs, worse than November’s 8.7 per cent fall but slightly outperforming expectations of an even greater contraction. Imports slid 7.5 per cent last month, up from a 10.6 drop the month before.”

January 14 Update: Reuters reports, “Between Dec. 8 and Jan. 12, the number of COVID-related deaths in Chinese hospitals totalled 59,938, Jiao Yahui, head of the Bureau of Medical Administration under the National Health Commission (NHC), told a media briefing.” This increase reflects a change in the standard of measurement being utilized. While much higher than previously reported, this number is still treated skeptically by many who expect reopening will produce much higher fatality rates. (More and more)

January 17 Update: Bloomberg reports, “The nearly 60,000 Covid-related deaths China reported for the first five weeks of its current outbreak, the largest the world has ever seen, may underestimate the true toll by hundreds of thousands of fatalities, experts said… Using a report from the National School of Development at Peking University that found 64% of the population was infected by mid-January, he [Zuo-Feng Zhang, chair of the department of epidemiology at the Fielding School of Public Health at University of California, Los Angeles] estimated 900,000 people would have died in the previous five weeks based on a conservative 0.1% case fatality rate. That means the official hospital death count is less than 7% of the total mortality seen during the outbreak.”

January 27 Update: For the last two weeks covid reports out of China have been ambiguous. The official line is clear enough (more), but the subtext is a like a Keith Moon drum set sharing the stage with a Mozart concerto. Here’s an example from this morning’s Financial Times, “Chrysanthemum flowers, a symbol of mourning in China, are selling out in cities across the central province of Hubei, with prices rising sharply as demand surges following a wave of Covid-19 deaths.” There is a steady drum-beat of death. I am especially concerned about mutations, but over the last two weeks nothing definitive. From a global supply chain perspective, if the official line is accurate and sustainable, China’s export engine will continue to chug along and, gradually, China’s less-constrained domestic demand will play its part in simulating global economic activity, improving chances for a rising tide that will lift all boats — especially — container ships (more). But a virulent mutation would undo this quickly — and recent increased transmission rates spike the chance for a more varied range of mutations. So… several years ago I was awakened in my hotel room by thuds and screams from the room behind my bed. It was either some unusually vigorous sex or deadly violence. My heart-pumping uncertainty was finally resolved when the convulsive pounding assumed a more rolling rhythm… and I returned to sleep. What would have I done if the acid-rock drum-roll had continued?

European energy flows

[Updates Below] Europe’s second week of winter begins with Frankfurt breaking 60 degrees Fahrenheit. Autumn in Paris (and Berlin and Amsterdam) was remarkably mild. The EU has consumed one-fifth to one-quarter less energy than usual. Much higher costs have also contributed to declines in demand (more and more).

EU natural gas storage facilities are more than 80 percent full (more and more). The price of a March futures contract for natural gas is now less than one-quarter the late August price per the Dutch TTF benchmark (see chart below). (The US Henry Hub price has also fallen.) Even diesel supplies are slightly higher while the price is slightly lower compared to one month ago (more and more).

Happy New Year.

So far, President Putin’s plan to weaponize Western Europe’s winter is not going well. Farther East, today even Kyiv is feeling the upper fifties Fahrenheit. But Putin’s direct attacks on Ukraine’s grid (here and here and here) are a very present and escalating threat to millions.

In a December 28 address to Ukraine’s parliament, President Zelenskyy said, “Today we have to get through and we will definitely get through this winter. Russian missiles and, as they say, “shahed” strikes at our energy sector, at the energy supply of Ukrainians, are an obvious challenge — not only to our state, by the way. When terror strikes against the civilization of life, the world can stand up for both civilization and life.”

In the same speech Zelenskyy offers a Supply Chain Resilience, network-science-oriented vision for rebuilding his nation’s grid, “Now, when the enemy has set himself the goal of destroying us, destroying our energy sector, we set ourselves the goal of becoming a leader in the transformation of our energy sector to counter any threats, any challenges – military, political, economic or even climatic. We have to become – and we will become, as there is no other option – a leader in building modern green energy. This will allow us to create a decentralized energy system that cannot be destroyed by anything, any missile strikes. Today – everyone can see – it is dangerous when cities depend on several large thermal or power plants. A modern city needs decentralized sources of energy.”

+++

January 2 Update: Bloomberg reports, “Benchmark futures settled higher on Monday after initially falling to the lowest level since before Russia invaded Ukraine. While weather forecasts point to temperatures above seasonal norms for most of the region in the next two weeks, Europe still needs to manage its stocks carefully as it goes through the winter.”

January 5 Update: S&P provides a helpful analysis of demand and supply, concluding: “European power prices have fallen to pre-Ukraine invasion levels for winter contracts, as a combination of ample LNG supply, mild weather and a weak economy weighed on the market, while prices further out were firmly higher on the year…”