Fourth quarter real US GDP was strong, better than expected… especially given the decline in real consumption expenditures in November and December.
According to the Bureau of Economic Analysis, during the fourth quarter inventories increased “led by manufacturing (mainly petroleum and coal products as well as chemicals) as well as mining, utilities, and construction industries (led by utilities).” Inventories have also been increasing in many consumer sectors according to other analysis (here and here).
GDP analysis recognizes the potential value of inventories. And… increased retail inventories — especially at Christmastime — could signal a potential slowdown in demand. Today’s abundance may be tomorrow’s surplus. And… the inventory to sales ratio is still well below typical pre-pandemic levels.
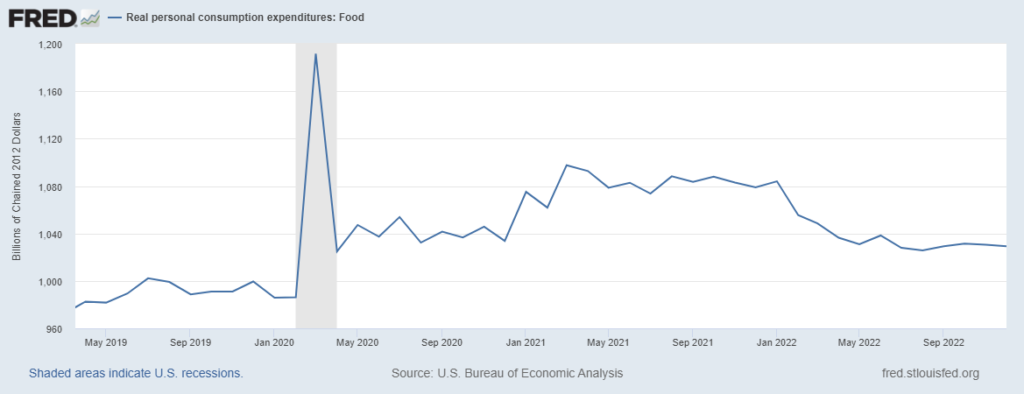
This space gives sustained attention to US spending on food (please see the inflation-adjusted pattern in the chart below). Low unemployment, stronger wage growth, and past savings (aka excess savings) continue to support robust grocery purchases (and eating out). But real grocery consumption has now been flat for six months, low unemployment does not mean high employment, and December (of all months) saw an interesting uptick in the current personal saving rate (here and here).
It seems to me that pull patterns are increasingly reforming around pre-pandemic dynamics. There is less volatility, so more predictability. Pull is settling into vectors that push can usually fulfill. Demand and supply are much closer to equilibrium — and push can flex to follow marginal shifts in pull — up or down.