Month: April 2022

Whither goest demand?

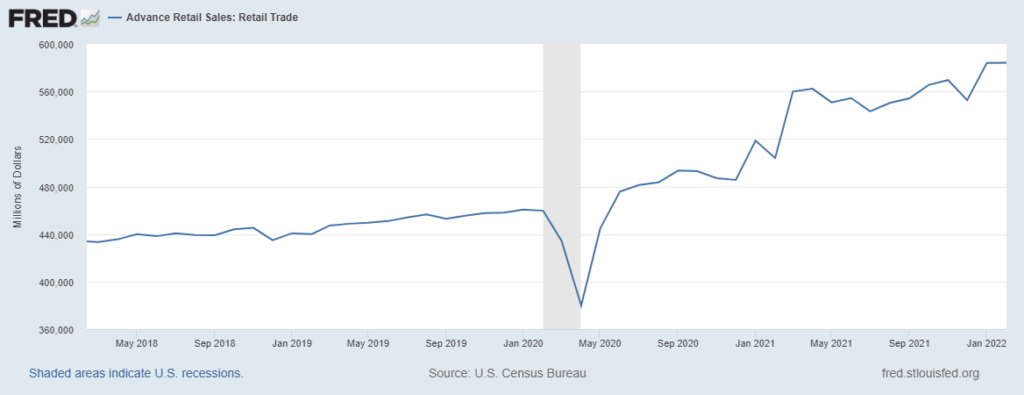
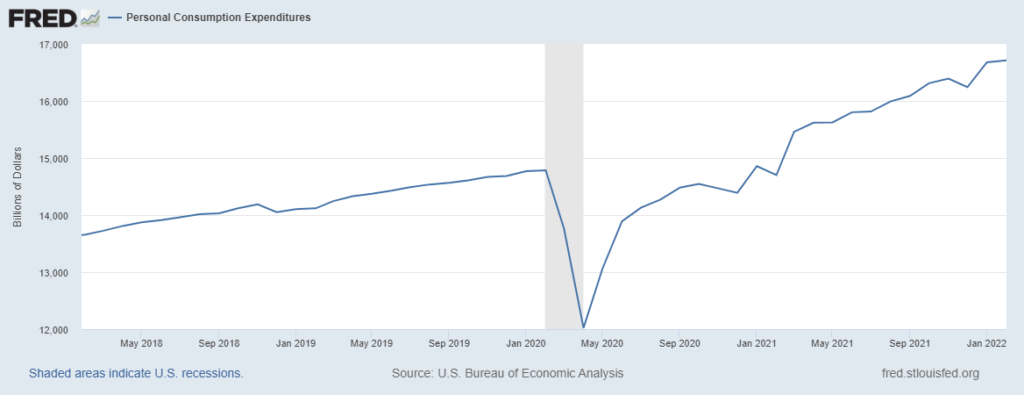
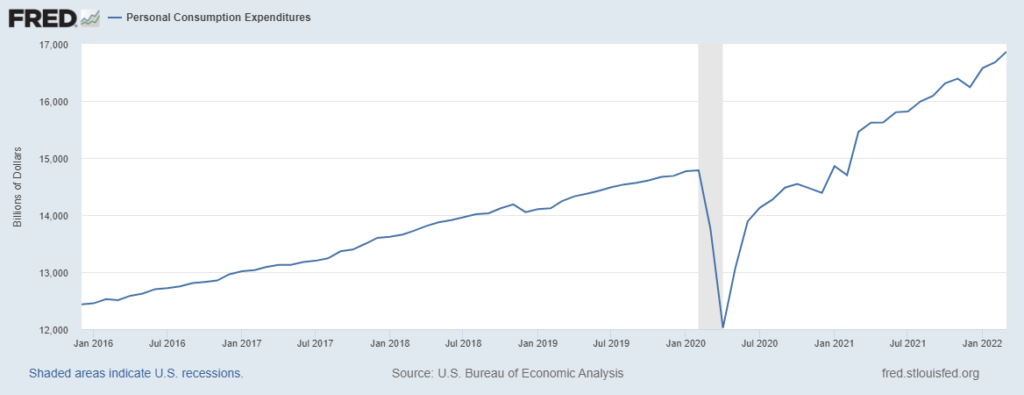
According to the Bureau of Economic Analysis, March US Personal Consumption Expenditures continued to grow (see chart below). Not adjusted for inflation, Americans are spending more than ever before. The rate of expenditure growth is a bit less torrid than one year ago. The purchase mix is also much closer to pre-pandemic patterns: services, entertainment, travel, and eating out are back. Demand for “stuff” has softened (and some stuff is still and will be hard to get, see here and here).

Strong US employment and wage growth are supporting consumption. Higher earning Americans can also draw down savings accumulated from non-spending and higher incomes in 2020 and 2021. All consumers are paying somewhat more because of price increases, especially for food and fuel. The Personal Saving Rate for current cash-flow is now about 15 percent lower than decade-long pre-pandemic averages.

Supply chain implications: The retreat from even more stuff and advance on services is reducing friction in goods movement. For example, Amazon has reported slower revenue growth for first quarter 2022 and single digit growth ahead. On Thursday Amazon’s CEO said,

Today, as we’re no longer chasing physical or staffing capacity, our teams are squarely focused on improving productivity and cost efficiencies throughout our fulfillment network. We know how to do this and have done it before. This may take some time, particularly as we work through ongoing inflationary and supply chain pressures, but we see encouraging progress on a number of customer experience dimensions, including delivery speed performance as we’re now approaching levels not seen since the months immediately preceding the pandemic in early 2020.

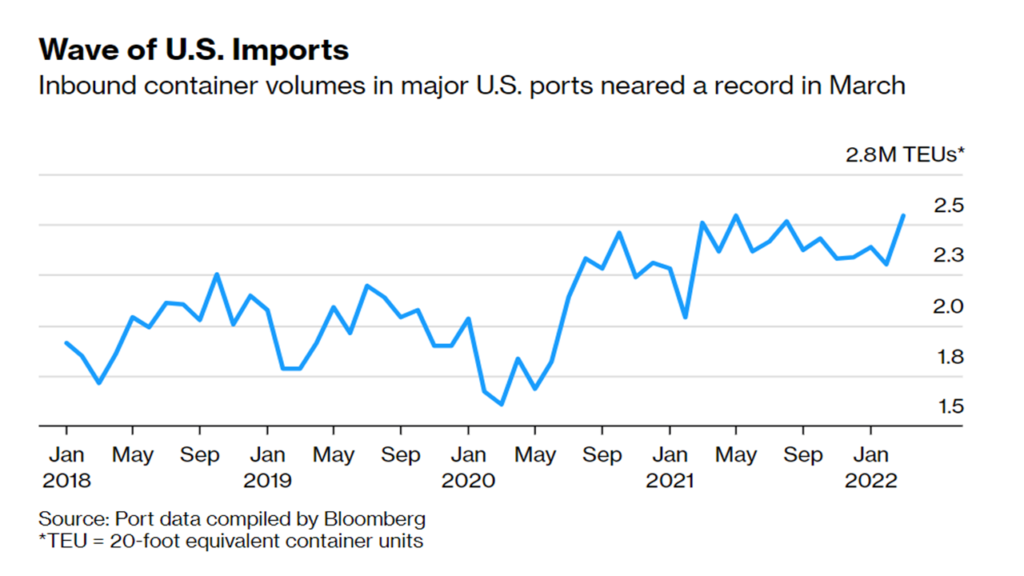
According to many March results, freight flows were (are?) evening out. North American ports are much less congested. Several indicators suggest last month’s freight volumes and expenditures were consistent with 2018 and 2019 (more). After two years of extreme volatility, 2022’s first quarter saw equilibrium gradually resurfacing in many sectors of demand and supply.

But on February 24 Russia invaded Ukraine. By mid-March various sanctions were complicating flows of Russia’s energy, food, and metals. Military measures seriously disrupted flows of Ukraine’s agricultural products. Global prices for food and fuel (and related) increased accordingly. Complications in these flows have proliferated since mid-March. US diesel prices are flirting with all-time highs.

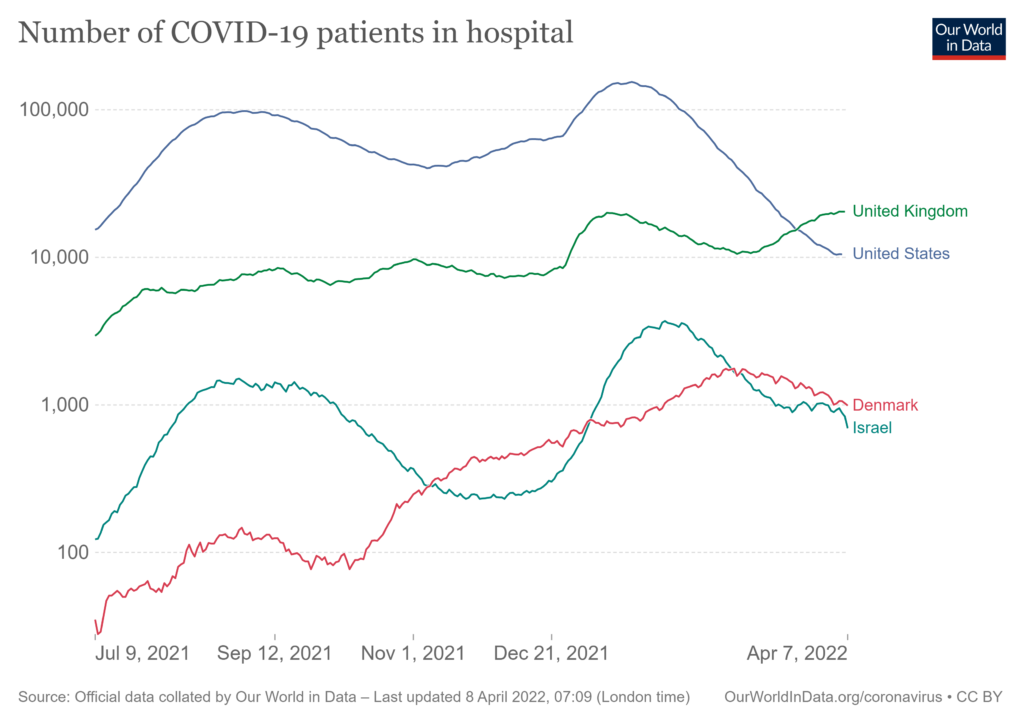
On April 1 Shanghai was locked-down. By mid-April, by one estimate, more than 40 percent of China’s economy was seriously disrupted by the attempt to contain covid. The demand shock in China is undeniable. The potential supply shock for the rest of the world is deeply worrisome. As previously noted (here and here), I am part of a distinct minority who still, tentatively, discern it is possible that China’s outbound flows — plus adaptation elsewhere — will mostly match broad-based global demand for manufactured goods.

But apparently not for many Apple products. Thursday Tim Cook, Apple’s CEO, told financial analysts:

looking ahead, we see two causes of supply constraints. One is the COVID-related disruptions, and there’s the industrywide silicon shortages that will continue. We’ve estimated the constraints to be in the range of $4 billion to $8 billion. And if you — these constraints are primarily centered around the Shanghai corridor. And the — on a positive front, almost all of the affected final assembly factories have now restarted. And so, the range, the $4 billion to $8 billion range, reflects various ramps of getting back up and running. We’re also encouraged that the COVID case count that’s been reported in Shanghai has decreased over the last few days. And so, there’s some reason for optimism there. Then answering a related question, Mr. Cook added, In this business, you don’t want to hold a ton of inventory. And so, you want to work on cycle times and so forth to do things very quickly and take strategic inventory in places where you need to buffer for interruptions and so forth. And so, we’re constantly thinking about where those places are. In today’s world, it’s not really possible for us to have buffer on silicon. And so, today, silicon rolls off the fab and it’s into a final assembly plant very, very quickly, and we try to make that as shorter time as possible.

Apple is absolutely not alone. Recently at FreightWaves Craig Fuller outlined what he perceives is not happening upstream from China’s ports:

The loss of trucking capacity in China means that raw materials and components can’t get from the ports to factories and finished goods can’t leave the factories to the ports to be put on ships for export. The temporary blip (dead cat bounce) was likely containers that were already in the queue at the port prior to the lockdowns.  Since factories can’t receive new components or raw materials, they will also stop operating once their supplies are exhausted. Supply chains involve large webs of suppliers that are interconnected and just because one supplier is online does not mean that other suppliers are. Once they shut down, it will take much longer to bring them up to full productivity.  According to SONAR’s ocean intelligence dashboard, it currently takes 27 days for a vessel to travel from a Chinese port to a U.S. port. Since the volume of containers from China to the U.S. started its drop on April 6, it will likely be May 3 before U.S. ports experience a drop in volume. 

Combine Tim Cook’s comments with Craig Fuller’s analysis and there is good cause for outbound flows from China anticipating rocky shoals ahead. How low might flow go? How fast?

Tim says Shanghai production is ramping up (so do others). So-far total outbound flows from China are more up-and-down like a roller coaster than spinning down like a water slide. Both Europe and the United States over-reacted to a much more complete stop in flows from China in February 2020. The prospect of lost flows became a self-fulfilling — and self-subverting — prophecy. Transpacific container spot rates have recently been stable (more). Some insiders even claim flows from China are about to surge. I also notice that real (inflation adjusted) US individual disposable income decreased 0.4 percent in March while our purchases of goods declined 0.5 percent and purchases of services increased 0.6 percent. Americans are still buying plenty, but don’t want as much from China now as during most of 2021.

I also watch, a bit amazed, as Russia’s oil essentially flows uphill toward persistent demand (more). I notice Ukraine’s grain using every available crack and crevice to connect with desperate demand. There are all sorts of serious problems. But again and again, I seem to see whither goest demand, so goest supply.

April 30 Update: China’s official print for the April Purchasing Managers Index (PMI) confirms the slowdown in production and domestic consumption. According to Reuters: “China’s factory activity contracted at a steeper pace in April, as widespread COVID-19 lockdowns curbed production and disrupted supply chains, an official survey showed on Saturday. The official manufacturing Purchasing Managers’ Index (PMI) fell to 47.4 in April from 49.5 in March, for a second straight month of contraction, the National Bureau of Statistics (NBS) said. The 50-point mark separates contraction from growth on a monthly basis.” Perhaps I protest too much, but it seems to me worth noting that the manufacturing element in the index remains well-above 2020’s bottom and even above current factory orders (export or not). China’s domestic demand has been decimated. Demand for China’s goods in much of the world is cooling. Even US demand, still stronger than most, has lost a couple of degrees of friction’s heat (more ).

The argument about what comes first — supply or demand? — can become (like chicken or egg) a definitional rabbit hole. Of course, both factors matter. Disrupted, congested, and delayed outbound flows from a major upstream node (even more: a dense cluster) will frustrate demand. Long-term, wide-area, extreme demand surges (or destruction) will seriously stress supply capacities. Either can cause disequilibrium. Over the last two years we have often suffered both. Today there is increasing evidence of less extreme demand. To the extent effectual demand continues to more steadily pull, this will help sources of supply to push more consistently… to the extent war, plague, and calamity allow.

Re: Shanghai – Another Contrarian

In an interview with Bloomberg the Chairman of Yang Ming Marine Transport Corporation perceives big flows are easing where most others argue there is increasing friction (including a rather apocalyptic Monday analysis at Bloomberg). Please see interview excerpts in the video below (less than 4 minutes). Before joining the Taiwan-based shipping company in 2020, Chairman Cheng has served as a respected academic and government economist. Much of his argument for easing focuses on differentiating inbound flows serving China’s domestic consumption from outbound flows serving global consumption. He was not asked about and does not address upstream production cut-backs due to covid lock-downs across China. While Mr. Cheng and I seem to see similar behavior in current flows at Shanghai, he is much more confident (and optimistic) than I am regarding the trajectory for global demand heading into 2023. Or perhaps these differing expectations reflect our immediate contexts and angles: his in East Asia and mine in North America.

Shanghai’s slower flows

Here’s one headline from a usually credible source: China’s COVID-19 lockdown is inflaming the world’s supply chain backlog, with 1 in 5 container ships stuck outside congested ports. [Please see April 26 update below.]

The same day, here’s the headline from another credible source: Shanghai lockdown is not causing global supply chain chaos (yet)

Can both be simultaneously true? Perhaps inflammation is a symptom that if effectively treated can avoid chaos?

These two angles depend on two different sources. The inflammation angle is provided largely by Windward (more). The no-chaos-yet angle is based on data from project44. These are competitors in the supply chain visualization market.

Each is looking at activity in approximately the same time and space. The activity, however, is very complex. Visual Capitalist has put together its own compelling angle on this time and space, confirming significant inflammation in an especially influential maritime node. What happens — or doesn’t happen — at Shanghai will eventually be reflected at LA/LB, Rotterdam, and elsewhere.

What is heading downstream from Shanghai? When? At what velocity? Encountering what receiving capacity?

According to Fortune, “As of April 19, Windward recorded 506 vessels awaiting berthing space at Chinese docks, up 195% from the 260 halted offshore in February… Before the lockdowns started, congestion at China’s ports accounted for only 14.8% of the global container backlog, versus roughly one-third now.” (more)

According to FreightWaves, “Waiting time for export containers, including those headed for the U.S., has actually decreased during the lockdown period: from 3.1 days on March 28 to 2.1 days on Monday. ‘This improvement is because fewer containers are getting to the port in the first place, while simultaneously, sufficient vessel capacity is available to handle those export containers,’ said project44.”

The FreightWaves report also compares the current situation to the June 2021 shutdown of China’s Yantian port. Many of us perceive that this was a principal cause of the extraordinary downstream port congestion experienced during the second half of last year. The language quoted by FreightWaves is sufficiently nuanced that you should read the original. But what I hear is that while the Yantian lockdown essentially caused flows to stop for an extended period, current flows in and out of Shanghai have slowed, but not stopped.

Everyone agrees there is more congestion at Shanghai (and nearby Ningbo) than at any pre-pandemic period and is much worse than last month. Too much dock density is complicating shoreside operations. Too few trucks with truckers are extracting import containers. This has reduced velocity of outbound flows from Shanghai. (Much More.) But — in contrast with June 2021 — flow is still happening.

Will Shanghai processing and production resume sufficient to maintain outbound flows of goods (and inbound flows of payments)? (More.) Will US demand for imports from China continue to decline or not (see chart below)? Will US West Coast ports avoid a Longshoreman’s strike? Will San Pedro Bay ever again see less than ten container ships at anchor (here and here and here)? There are plenty more such questions.

The map is never the territory. All models are wrong, but some are useful. Human discernment requires choice. Choices usually exclude. Depending on what is included, equally valid analyses can offer different outcomes. Over time and space these differences can be amplified.

Flow has slowed. So has demand. If upstream sources dry up, there’s a fundamental problem. If downstream discharge cannot happen, there may be an existential problem. While flow persists we can mitigate and solve problems.

+++

Related note: Above I am mostly looking at trade flows between Shanghai and the outside world, especially the United States. This angle does not give attention to the impact of diminished food flows on the residents of Shanghai and well beyond Shanghai. Evidence continues to accumulate that the effort to replace demandoriented watersheds with a supply-oriented pipelines is failing many (more and more and more and more).

April 25 Update: Increasing covid case counts in Beijing and other provinces suggests that several other watersheds are now under threat. [And the threat of new mutation threatens all of us.]

April 26 Update: Bloomberg has posted a long-read mostly organized around this premise: “China accounts for about 12% of global trade and Covid restrictions have idled factories and warehouses, slowed truck deliveries and exacerbated container logjams. U.S. and European ports are already swamped, leaving them vulnerable to additional shocks.” The US will, as a result it is argued, see a recurrence of 2021 port congestion and related… and there are longer-term implications as set out by the Bloomberg piece. For me, the most persuasive evidence for this argument is increased flow of containers into US ports (please see chart below). If this increased flow persists and grows — especially in uneven spurts arriving at too few nodes — then more congestion and all its discontents will recur. But as regular readers know, I do not perceive that recent levels of US demand will persist. As set out in my original post above there is also evidence that outbound flow from China is — so far — more consistent than inbound. Even the Bloomberg piece notes that much of the current congestion at Shanghai and nearby is the result of inbound goods unable to be offloaded. Outbound flow from China has slowed, but continues (more). I am not (yet) predicting anything. I am arguing that evidence is ambiguous, even contradictory and given changing conditions in China and elsewhere we should not immediately assume the pig-in-the-python at China’s ports must turn our way. We should continue to do what we can to reduce friction and improve flow at US ports and we should watch carefully the character of outbound flows from China.

Food flow milestones

[Updates below] Russia’s invasion of Ukraine has substantially increased friction in physical movement of key commodities (such as wheat and sunflower oil) out of the war zone. Sanctions on Russia have also increased friction involved in buying Russian products, especially fossil fuels and fertilizer. In each case demand remains high.

At least right now, I perceive Russia’s energy flow is being complicated, delayed, and redirected by financial sanctions (more), but flow is continuing to find its way from Russian suppliers to those with demand.

If anything, global demand for Ukraine’s food flows is even greater than that for Russian oil. But physical constraints caused by war — especially the blockade of Black Sea ports — are much tougher to overcome than paperwork problems in conducting foreign exchange transactions.

Both food and energy are more expensive than before the invasion. This is motivating the energy market to reduce friction, optimize flows, and maximize its financial returns. There is less evidence — so far — that global food flows will be able to effectively adapt to fulfill demand. Extracting primeval deposits below ground can be tough, successfully harvesting perishable crops above ground involves even more uncontrollable risk.

McKinsey has produced a podcast (with transcript) that helpfully highlights the stepwise character of the emerging food crisis. Here’s an excerpt:

Lucia Rahilly: We seem to be talking about a convergence of relatively substantive disruptions. The media has been reporting on the potential for a global food emergency and an increase in global hunger. How concerned should we be?

Nicolas Denis: We should definitely be concerned. But the extent of that concern should be assessed in the coming weeks and months. What really matters is which of these milestones in the different breadbaskets—from preparing the fields to planting to harvesting—will be hit and which ones will be missed. We should also turn our attention not just to what is under the spotlight of the media today but to some of the secondary impact we could see.

Now is planting season in Ukraine, a critical source of wheat (and more) for the Middle East and North Africa. Brazil and Argentina depend on Russian fertilizer flows. The South American planting season begins in July-August, fertilizer is often applied first. Drought in US plains states have depressed yields. This morning wheat and corn futures are near record highs. There have already been food-related protests in Peru, Pakistan, and Sri Lanka. Concern and grumbling is much more widespread. Each milestone is worth marking. Effective adaptation to these evolving conditions will require creativity, collaboration, and considerable courage.

+++

April 23 Updates: Major British grocers are limiting consumer purchases of cooking oil. According to the BBC, “Tesco is allowing three items per customer. Waitrose and Morrisons have limited shoppers to two items each. The majority of the UK’s sunflower oil comes from Ukraine and disruption to exports has led to some shortages and an increased demand for alternatives.” According to Bloomberg: “Two months after Russia’s invasion of Ukraine upended global agricultural trade, Indonesia is set to ban exports of cooking oil in the wake of a local shortage and soaring prices, adding to a raft of crop protectionism around the world. The country accounts for more than a third of global vegetable-oil exports, with China and India, the two most populous countries, among its top buyers.”

May Day Update: Bloomberg reports, “For the first time ever, farmers the world over — all at the same time — are testing the limits of how little chemical fertilizer they can apply without devastating their yields come harvest time. Early predictions are bleak…”

May 14 Update: Bloomberg offers a round-up of stories on wheat supplies and related prices, including, “Bread and noodle prices are already being pushed up as war cripples Ukraine’s wheat exports, and now droughts, floods and heatwaves threaten crops in most major producers. Warm and dry weather is becoming a worry in Europe, while US fields are parched. Ground that’s either too wet or too dry is thwarting Canadian plantings and China has contended with unusual autumn floods.”

Q&A

Fairly late on Friday evening a colleague sent me an email with earnest, even urgent questions regarding likely supply chain outcomes over the next three to nine months. She is concerned about the same issues which I am closely watching. Probably you too.

As due diligence, I reviewed the usual rate-limiting parameters: Russian aggression (including lost food flows); sanctions on Russia (including more friction in global fuel flows); collateral damage from China’s Zero Covid strategy (including reduced aluminum flows); significant swerves in demand caused by inflation, possible recession, or other macro-economic behaviors; over-concentration and recurring congestion of supply networks; labor churn and lost productivity… You know the drill.

But my answer consisted mostly of questions. Here is a rough line of inquiry abstracted away from any specific product categories:

What are your current service levels on average? Are you tiering customer service? If you are tiering, what is the service level difference between top tier and bottom tier? Any near-term way to narrow this gap?

Compared to recent demand for your products/services, is upstream capacity on which you currently depend adequate? If not, proportionally how inadequate?

How concentrated is your upstream capacity? Given that concentration, how vulnerable are you? How concentrated is downstream demand?

What are the time and capital requirements for increasing your current capacity by 20 percent? How about 40 percent? Ask the same questions for upstream capacity.

What is the risk of essential inputs (either material or functional) being threatened by loss of upstream capacity?

Under what circumstances might current demand experience a substantial reversal? Is there a reason to perceive stubborn demand for your products? Why or why not?

If there is cause to perceive stubborn demand for your products/services, what scope and scale — especially duration — of demand destruction is survivable? How can this survivable “space” be extended?

What proportion of flow from upstream sourcing to far downstream consumption moves through dedicated modes and channels? How much depends on spot market tenders being accepted? How elastic is this capacity? Are there geographic or modal or functional work-arounds or supplements?

Frankly, I assumed my friend would find this line of inquiry unhelpful. I cannot, however, pretend to predict how myriad supply chain complexities (and even contradictions) will play out given the current context. But while external threats must mostly be imagined, internal vulnerabilities can often be measured.

Earlier today my friend forwarded a note from her CEO, apparently the questions were meaningful to him. So, I have decided to share with you too.

In profoundly uncertain contexts, self-critical questions are usually more constructive than trying to guess the intention or future action of others.

A mentor (now dead) said, “Even the best answers are ephemeral. Our best questions are eternal.”

Command and Control Constrains

Twenty-six million residents of metropolitan Shanghai have been “locked down” since about March 28. While officially denied until the last minute, the lockdown had been widely anticipated for at least two weeks prior.

The challenges involved in supplying locked down large cities have been well-known since Wuhan. Recent lockdowns in Hong Kong and Shenzhen reconfirmed that with more consumer demand, any loss of supply capacity is amplified. Accurate pull facilitates better push. Without pull targeting where and when, push can quickly accelerate deficits. In other words, what begins bad quickly gets worse.

Two years ago China’s lockdowns were less well organized, preexisting sources and channels of supply found cracks where pull could still shape flow. Even during lockdown residents were allowed to stimulate these flows of food. Access to food stores and markets was time-and-space limited, but continued. Control is now much more complete. Preexisting pull-oriented supply chains that supplied Shanghai have been increasingly replaced by push-oriented logistics.

Well, more accurately: push-oriented logistics has been imposed in an unsuccessful effort to replace pull-oriented supply chains. (See here and here and here.) Below is a photograph of supply being pushed to quarantined demand. It does not require extensive supply chain experience to discern slack velocity. The gap between Shanghai’s supply velocity and demand velocity has rapidly widened, especially over the last week as preexisting consumer stockpiles have been eaten up (more photographs, WSJ 5:31 video on Shanghai food shortages).

It is worth noting: the electric grid is fully operating, telecoms are fine, roads and bridges are unusually friction-free without the usual traffic. (Water for human hydration can be a problem.) The government and Chinese Communist Party have extensive whole-of-nation resources committed to this task. Feeding the people of Shanghai is a top priority. But mostly as a matter of physics, it is not possible to replace high volume, high velocity demand-oriented networks with a supply-oriented command-directed pipeline at large scale with the flip of a switch.

We regularly underestimate the power of complex adaptive systems. We regularly overestimate our capacity for control.

Is There a Stock Market Upside to China's Covid Lockdowns? - Bloomberg

Photographer: Liu Jin, AFP via Bloomberg

April 15 Updates: A headline in this morning’s South China Morning Post (Hong Kong): Shanghai’s forgotten elderly trapped without food, essential medicine. Another SCMP story is as fascinating for what it tells us, “between the lines,” as what it explicitly says. While Shanghai remains the covid epicenter, the Wall Street Journal reports that, “Forty-five Chinese cities with a combined 373 million people had implemented either full or partial lockdowns as of Monday, a sharp increase from 23 cities and 193 million people a week earlier, according to a survey by Nomura. The 45 cities account for more than one-quarter of China’s population and roughly 40% of the country’s total economic output.” Reuters provides a quick overview of supply chain implications. Earlier this week the International Energy Agency’s April Oil Market Report included, “Severe new lockdown measures amid surging Covid cases in China have led to a downward revision in our expectations for global oil demand in 2Q22 and for the year as a whole. Weaker-than-expected demand in OECD countries at the start of the year added to the decline. As a result, our estimate for global oil demand has been lowered by 260 kb/d for the year versus last month’s Report, and demand is now expected to average 99.4 mb/d in 2022, up by 1.9 mb/d from 2021.” Next Monday, April 18, China will release first quarter economic outcomes, disrupted consumption, production, and more are predicted to slow domestic and global flows.

Contemporary supply organizes around effectual demand.

April 30 Update: Very helpful retrospective on Shanghai food chain challenges from the South China Morning Post.

Demand: Destruction or Deceleration?

Updated below with take-aways from the April 14 Retail Sales Report.

On April 11 World Trade Organization economists predicted that 2022 global GDP will grow about one-third less than previously predicted because of, “1) the direct impact of the war in Ukraine, including destruction of infrastructure and increased trade costs; (2) the impact of sanctions on Russia, including the blocking of Russian banks from the SWIFT settlement system; and (3) reduced aggregate demand in the rest of the world due to falling business/consumer confidence and rising uncertainty.”

Domestic consumption in China is currently disrupted by anti-covid measures. Economic activity in Japan is slowing. In March Eurozone consumer confidence collapsed in response to Russia’s invasion of Ukraine. India’s consumer sentiment also suggests reduced consumption ahead. For millions of consumers worldwide sharp increases in food and fuel prices will leave much less disposable income available for anything else.

In contrast, US retail sales in January and February were the highest ever recorded (see chart below, through February), but the February sales increase did not make up for retail price-increases. Some continued softening in real net spending is likely, but nothing precipitous is — so far — being signaled for March to current (more).

According to the March US Consumer Price Index (released this morning) gasoline prices are up 48 percent compared to twelve months ago, food-at-home is up ten percent, and food-away-from-home is up almost seven percent. Other price movements are mixed, including several recent price declines for many types of apparel and even used cars. But, for example, used car prices still average a whopping one-third above prices one year ago.

Employment is strong. Wages are increasing, even if not always matching inflation. Low earning Americans are likely to spend what they must for food and fuel. What will higher earners decide to do? Many still have much higher savings than usual. Many have just recently begun to spend again on services. Prospects and prognostications are mixed (see here and here).

For most of 2021 US demand and supply was out of whack. There was much more demand for “stuff” than timely capacity to make and ship at volumes and velocities demanded (my wife and I still cannot purchase two long out-of-stock chairs). Demand for stuff (other than new cars and electronic gear?) is diminishing. US spending on experiences — eating out, entertainment, recreation including travel — is increasing. Demand capacity is getting much better calibrated with supply capacity.

Many prices are increasing too, which tends to clarify the distinction between “effectual” and “absolute” demand. But — so far — prices on a wide range of durable goods seem to be stabilizing and (at least until recent China lockdowns) both inventories and flows have displayed less friction. Reviewing these and other market shifts, Craig Fuller at FreightWaves recently wrote, “This is all good for consumers – prices for freight will come down. Supply chain bottlenecks will ease. What were recently inventory shortages are now gluts, and will likely result in price discounts, not increases. This is a late-stage supply chain correction.” Craig is not as affirmative on implications for freight markets.

If the goal is rough equilibrium of supply and demand — with strong employment and positive financial prospects — then less demand for imported stuff and more demand for domestic services is helpful. And… we still have reasonably high demand across a wide range of product categories. Can we keep it? The second chart below is Personal Consumption Expenditures. This suggests we are currently consuming about $700 billion more per month than would have been the case without various pandemic factors at play. We don’t need further increases in demand. A slow, modest deceleration of demand, consistent with “full” employment and an inflation rate closer to four than today’s 8.5 percent would be a tonic… If all the Chicken Little’s could somehow be reassured.

Reduced demand for energy outside the United States — especially by China — increases the possibility of somewhat lower USA pump prices. An early ceasefire in Ukraine could have a similar impact on global food inflation. The combination of lower fuel costs and a less anxious global food market will at least soften US food price increases. (My guess is that we are in the midst of a systemic structural shift in US food prices.) But with or without this help, a great deal depends on how Americans spend their money. If we suddenly reduce spending (demand destruction), everyone is in trouble. If we persist with personal consumption expenditures no higher than February and at or above $16,000 billon per month for the next three to six months (demand deceleration), we should be able to pull US supply chains — and the US economy — through this particular storm without losing our way.

Next storm? Ask me when landfall is predictable. But, as usual, it will depend on demand.

April 13 Update: What’s above is much more open to positive possibilities than most current analyses. So, I am glad to see DHL’s Jim Monkmeyer’s comments at Bloomberg: “We have backlogs for cars, for RVs, for raw materials that are going to drive and spread that demand over a longer period of time — and I think that’s a positive… My hope is that we’re heading to maybe a slight slowdown that isn’t going to be the recession doom and gloom — I’m not in that camp… It’s funny how last year we all hoped for a slight slowdown. Now we’ve got it, and everybody’s worried of course that we’re going to swing the other way.”

April 14 Update: The US Census March Retail Sales Report confirms that US consumers continued to spend with considerable gusto. Total dollars spent increased from $587,808 million in February to $590,365 million in March. Because of inflation, we are buying slightly less with each dollar than the prior month. So, let’s describe March retail sales as flat. But flat is a very relative measure: in February 2020, mostly pre-pandemic, US retail sales were $459,610 million. March 2022 spending is differentiated from one year ago (at the start of sustained supply chain disequilibria). We are spending 37 percent more at gas stations and 9.5 percent more at grocery stores (mostly reflecting increased prices). We are spending 9.7 percent less on electronics and appliances and almost one-fifth more at restaurants and bars (reflecting considerably stronger consumer demand). In terms of the deceleration prescription outlined above: so far, so good.

April demand curves

It’s been about a month since the UK’s covid hospitalization rate began to bend up again (see chart below). Over the last several months the US has typically lagged UK by four to six weeks. Hospitalization rates have been especially troublesome (e.g., delta or omicron) when similar demand curves coincided for the UK, Denmark, Israel, and the United States. Right now the UK’s demand curve may have plateaued. Israel and Denmark have continued to show declining demand for hospitalization (the difference seems to be mostly a matter of proportional vaccination rates and, especially, booster rates). It is likely that US covid hospitalizations will increase during April and probably into early May. Meanwhile another new variant (well, more than one) seems to be emerging, with potential demand implications for late Spring and early Summer.

Accumulating friction, persisting flow

Flows are shaped by friction. Newton’s First Law of Motion can also be applied to demand and supply.

“Every body perseveres in its state of rest, or of uniform motion in a right line, unless it is compelled to change that state by forces impressed thereon.” [Corpus omne perseverare in statu suo quiescendi vel movendi uniformiter in directum, nisi quatenus a viribus impressis cogitur statum illum mutare.]

Most of Ukraine’s grain is not moving. Many are actively working to slow or stop Russian fossil fuels (more). Docks at Shanghai and Yantian are tightly constrained by excessive density and insufficient domestic discharge (more). Slowdown in any part of a network tends to produce pockets of congestion (and more disruption) in related places. Friction is promiscuous.

And… the TSO pipeline continues to deliver Russian natural gas west across Ukraine. This week in 2021 the rate of flow was just under 201,000 million cubic meters. The flow continues at above 183,000 million cubic meters. War or a warmer spring or price-induced lower demand? I don’t know. Russia’s oil is also finding some (wide) cracks in sanctions.

And… two weeks ago Ukraine’s government reversed earlier bans on sale of barley, corn, and sunflower oil. Last year’s crop production was good and stocks remain strong. Flows continue to be seriously constrained by war-related shut-downs at Black Sea ports , but creative alternatives are struggling to emerge (more). Spring planting is, so far, reportedly ahead of last year.

And… while there is a real slowdown in China exports, capacity levels have not diminished, outbound operations persist, Pacific freight rates are off their highs, and other than Shanghai, China ports are seeing increased volume. (Newton’s Second Law at work?) US inbound flows are “pretty good.”

Friction fluctuates, so do flows. Momentum — mass with velocity — is stubborn. Sometimes for good, sometimes not so much.

+++

April 8 Update: Bloomberg surveys how grain flows are shifting in response to Black Sea (and nearby) friction. “Soaring freight costs, port closures and supply-chain constraints have slammed exports from the Black Sea. With the war threatening more than a quarter of the world’s wheat shipments and about a fifth of corn, the world is at risk of more severe food shortages and worsening hunger. Buyers are on the hunt for alternatives, and sellers are finding ways to fill the void.” Russian diesel is also being pulled through unusual places using unusual methods.

April 9 Update: Despite reduced flows of Ukraine’s grain, on April 8 the USDA projected, “The global wheat outlook for 2021/22 is for slightly higher supplies, increased consumption, lower trade, and reduced ending stocks. Supplies are increased by 0.7 million tons to 1,069.5 million on a combination of higher beginning stocks for Pakistan, Brazil, and Saudi Arabia and higher production for Pakistan and Argentina more than offsetting lower EU production. Projected 2021/22 world consumption is raised 3.8 million tons to 791.1 million primarily on higher food, seed, and industrial (FSI) use for India. Based on greater offtake from government stocks to food distribution programs, India’s FSI is raised 4.4 million tons to a record 100.9 million.” The next day Bloomberg offered a decidedly less positive assessment.

Three Legged Stools (4th leg needed?)

Goldman Sachs has conducted a textual analysis of earnings call transcripts since 2010 for Russell 3000 companies. This focused on supply chain references overtime. The researchers found that these companies have recently focused on three strategic options: “Reshoring appears to be limited so far, as construction of new manufacturing facilities has mostly gone sideways and imports are still growing faster than domestic manufacturing output. Diversification of supply chains appears to be further along, and inventory overstocking is the strategy that’s most clearly underway.”

Many want to conceive and craft more resilient supply chains. Rana Foroohar calls out the choices — and balances? — between localization, decentralization, and redundancy.  Gillian Tett focuses on mapping concentrations to work through potential disruption scenarios and/or stockpiling, and/or lateralization (diversification of sources and operational functions). Geoffrey Gertz suggests mapping, stress testing, and diversification.  

It says more about how human cognition works than the essential structures of demand and supply networks, but some form of three dimensional analysis often recurs. Usual suspects include:

1. How Much Stuff: Also-Known-As overstocking, buffering, safety stock, just-in-case capacity… Perhaps mass?

2. From How Far Away: AKA reshoring, back-shoring, near-shearing, localization, close-to-customer… Perhaps distance? If distance, then potential velocity must be part of the resilience package.

3. From How Many Sources: AKA de-concentration, decentralization, diversification, redundancy… Perhaps centrality? (More below)

Is “de-globalization” an issue of how far away or how many sources?  Some of each, it seems to me, depending on demand for what is needed (or wanted) where.

Mass, distance, and velocity are familiar topics; centrality less so. I suspect that centrality is often the key resilience multiplier (or divider) for demand and supply networks. In a network of many nodes, some nodes and connected channels have the capacity for much more flow. Some nodes feature many short paths to other nodes, many nodes have only a few paths. The more central nodes and channels can facilitate high volume, high velocity flows. Loss of these more central nodes can seriously constrain flow capacity. Below is a less than six-minute video with further explanation.

More mass moving faster over less distance from more places is usually less vulnerable to disruption and more likely to prove resilient in case of serious disruption — unless sources are placed so close as to subvert the benefits of more places [supply chain “clusters” are a thing]. Distance of source capacity from disruption can be helpful, if sufficient channels remain open or can be reopened. High proportion dependence on concentrated sources very close by will increase risk of catastrophic failure. So, perhaps: More mass moving more-even proportions at a comparatively constant speed from more disparate places far and near toward well-defined demand targets, better ensures demand fulfillment. Distributing capacity far and wide minimizes the risk of losing network capacity.

Demand is often implied in these trinitarian approaches, but treated as an independent, even non-constant variable. Yet supply chain professionals and processes depend on demand mostly remaining within a predictable range. Supply capacity organizes around demand capacity. Highly concentrated demand can create vulnerabilities as extreme as concentrated sources or channels or modes. Excess demand, demand destruction, or extreme demand volatility will quickly increase various frictions in flow. To achieve enhanced supply chain resilience, we need to more fully engage how pull shapes push to create flow… another example of the rule of three.

+++