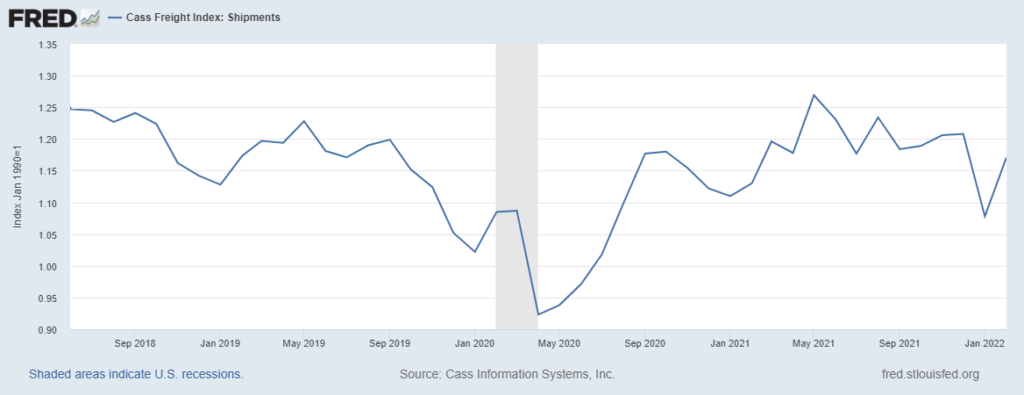
On April Fool’s Day I looked at some Federal Reserve and Bureau of Economic Analysis outputs for February and offered a big picture flow assessment for the United States. I felt a bit exposed offering, “The demand patterns in yesterday’s report reinforce this sense of improving equilibrium between pull and push.” This afternoon I am feeling less exposed. This morning’s Logistics Managers Index (LMI) Report for March (a much more rigorous blending of many more data indictors) offers, “… we are finally seeing a move away from the unsustainable supply/demand mismatch we have seen over the past 18 months and moving back towards a more viable market equilibrium.”
Reading the complete LMI will provide important details and a much more comprehensive view. The authors also reinforce a “sense” that I was picking up from chatter and observations, but for which I had no credible data. The LMI has data that suggest:
In March 2022 we detected significant differences between Upstream and Downstream predictions for two of the eight components of the LMI, as well as for the overall index. Similar to the current day comparisons, Downstream firms are more bearish on available Transportation Capacity, likely reflecting the demands placed upon them by the growth of ecommerce. Conversely, Upstream firms are predicting significantly higher (+14.2) Warehousing Prices Growth as they struggle to hold the growing levels of inventory that firms across all levels of the supply chain are predicting in 2022. While both Upstream and Downstream respondents predict growth this year, it is interesting to note that the rate of growth predicted is significantly higher for Upstream firms than for their Downstream counterparts.
What is upstream eventually flows downstream.
