Month: May 2023

Typhoon Mawar

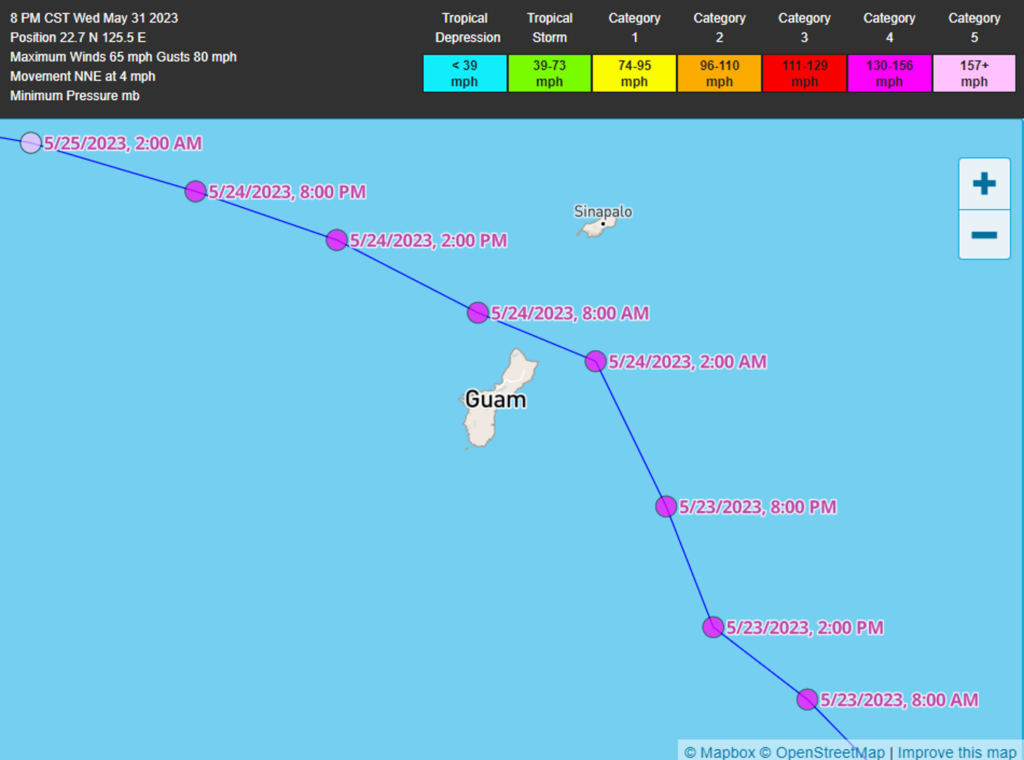
Last week a very high-end typhoon — similar to a CAT4 to 5 hurricane — impacted Guam, a US territory in the Western Pacific. Guam is roughly 30 miles long.  It is one mile to almost nine miles wide (roughly the same total area as Columbus, Ohio).  About 170,000 people reside on the island. Guam is located almost 4000 miles west of Hawaii, over 6000 miles west of Los Angeles, and 1600 miles south of Tokyo and east of Manila.

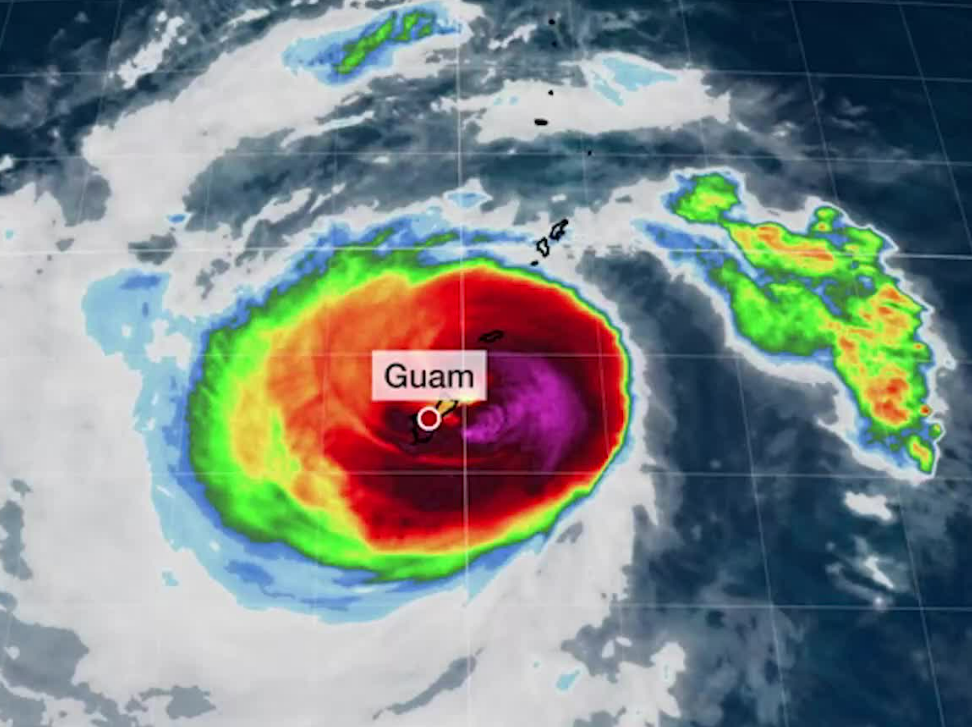
Typhoon Mawar approached Guam from the southeast with sustained winds of about 150 mph (see maps below).  Matson’s container ship,  Maunawili (departed Long Beach on May 11) was scheduled to dock on Tuesday but maintained a safe distance until the typhoon passed. (Matson service to Guam from Long Beach generally takes 13 to 14 days.)  As the typhoon approached, three US flag cargo vessels were scheduled to arrive at Guam before the end of the month:

Maunawili (Matson, US Flag) scheduled GUAM ETA 2023-05-23 15:00 LT (UTC +11)  DELAYED

Herodote (CMA CGM, US Flag) scheduled GUAM ETA 2023-05-26 12:30 LT (UTC +11)

Manoa (Matson, US flag ) scheduled GUAM ETA  2023-05-30 17:00 LT (UTC +11)

There were also two non-US flag fuel tankers scheduled to arrive Guam:  LPG Tanker Epic St. Kitts (ETA 5/26) and Oil Products Tanker Topaz Express (ETA: 5/29).

This line-up suggests ordinary flow (volume and velocity) providing food and other crucial freight to residents.

On Wednesday, May 24 Mawar’s large eye skirted Guam’s northern tip basically battering the island — especially the northside — for over 24 hours.  The Guam Daily Post reported the gradual loss of grid power and public water services over the day and into the night.  By Wednesday afternoon all but 1000 customers had lost power.  Boil Water Advisories were released. 

Strong winds and heavy rain continued on Thursday morning impeding response and recovery actions (more). By Thursday afternoon winds had receded enough that some grocery and fuel outlets reopened, all reported doing cash-only transactions because of the loss of grid power, telecommunications, and point-of-sale (POS) technology.  Travel was complicated by debris, but most roads were passable. 

Thursday afternoon saw the start of sustained grid and water system restoration.  Guam Power Authority (GPA) “critical restoration priorities include hospitals, critical water well and wastewater facilities, critical infrastructure facilities, schools/designated shelters, public safety/health facilities, and ports of entry.”  With the grid down, use of  private generators increased demand for fuel, but many fuel retail stations remained closed because of lack of grid power, lack of staff, and inability to operate digital POS transaction devices.  Telecommunications restoration started.  The airport was capable of handling limited emergency cargo flights.

By Friday, May 26 the Joint Information Center reported less than five percent of grid customers were reconnected.  About 40 percent of electrical substations had been reenergized.  The Guam Water Authority reported that the water system was operating “normally” but at 50 percent capacity. Boil Water Notices continued. According to the JIC, “The Port Authority of Guam (PAG) has received clearance from the U.S. Coast Guard (USCG) to begin major recovery efforts dockside. PAG weathered Typhoon Mawar with visible damage to Piers F3, F4, F5 and F6, particularly the Bull Rail. Portions of the Fender System also are damaged or broken off. The storm also caused damage to the Agat and Agana Marinas. PAG continues assessments on their wharves, docks, cranes, and facilities…”

On Friday and Saturday long lines were reported at the comparatively few operating retail fuel stations and strong demand exceeded tanker truck refilling capacity (more and more).  There was plenty of fuel at the terminal/racks, but tankers available to distribute the fuel could not keep up with demand. [Please see June 4 update below maps.] Repairs continued at the port where damaged cranes were a particular problem.

On Sunday, May 28 according to the Joint Information Center, water authority crews worked to restore non-operating wells.  More than 30 percent of wells needed power or minor repairs. Almost one-fifth of wells required pump motor replacements. The JIC also reported that by Sunday afternoon:

  • 16.2% of the System Load (Customer Demand) has been restored.
  • 65.4% of GPA’s Substation Energization has been restored.
  • 27.0% of GPA’s feeders/ circuits have been energized/restored.  

The Guam Daily Post reported continued strong demand — and mile long lines — for fuel. Velocity of demand, especially as a result of FOMO and increased demand to fill private generators remained significantly beyond the velocity of existing distribution capacity.  Actual on-island supplies of fuel products remained adequate to fulfill demand.

The port reopened on Sunday and the Maunawili was unloaded. Over 450 containers were discharged.  CMA-CGN Herodote also discharged cargo.  The Yasa Albatross oil tanker docked.  The Topaz Express arrived. Ships scheduled to arrive by May 31 include Matson’s Manoa, the LPG tanker Epic St. KittsCMA-CGN Dakar, and the container ship Kota-Ratu. (More.)

The airport reopened for regular flight operations on Monday afternoon.

Ongoing updates are available from the Joint Information Center and ReliefWeb and The Guam Daily Post.

The quick recovery of maritime port operations has been fundamental. Especially with the grid gone and disrupted public water, it has been crucial that food and bottled water flows persist. I am inclined to treat the Maunawili as a leading indicator. The typhoon delayed unloading for 48-plus hours. Recovering port operations required another 48-plus hours. With the port reopened food, fuel, and other flows could resume and catch-up with ordinary volumes and velocity. If anything had caused the port to be unable to resume operations, the population would have become more vulnerable with each passing day.

This is consistent with most contemporary supply chains: when concentrated capacity (the planned bottleneck) survives, supply chains may be delayed and constrained (such as by fuel distribution cycle times) but surviving bottlenecks can support creative and resilient flows. When bottlenecks become time-extended chokepoints, a realistic and well-exercised Plan B better be competently deployed sooner instead of later.

+++

June 4 Update: It is now confirmed by credible folks who should know that some of the fuel racks at the port were inoperable in the days after Mawar’s May 24 transit. I don’t know if these shut-downs were related to loss-of-grid, flooding, mechanical failure or whatever. I have seen only one especially vague written report. We will eventually find out. Disrupted supply plus surging demand equals manifest frustration (and worse). This, too, is a recurring classic of hardest hitting force-on-target events. I visited my first fuel rack the second morning after Superstorm Sandy’s 2012 visit to NYC and nearby. In that case with the grid gone, pumps to fill tanker trucks would not work. There were millions of gallons of refined products still sitting a few feet away, but nary a drop for tanker trucks nor, therefore, for cars or generators. Back then fuel racks (like food distribution nodes) never appeared on priority restoration lists. This remains unusual today. I can, however, report that every fuel rack I have visited along the US Gulf Coast now has an emergency generator to keep the pumps pushing.

Oil, gasoline, diesel: down and up

EIA and S&P report, “US crude inventories fell 12.5 million barrels the week ended May 19 as refiners continued to boost runs while export demand remained strong.” See first chart below (more). This includes the US recently increasing its flow of diesel to Europe. According to Bloomberg, “cargoes from the US are set to be the highest since August 2020.” Steady demand for fuel plus reduced inventories pushed WTI and related crude oil prices slightly higher this week, despite global demand still being in the doldrums and plenty of arguments for demand to continue to be constrained. Downstream product prices as usual are tracking upstream behavior. See second chart below and much more from EIA.

Maritime flows slow

According to Loadstar, “US west coast ports saw a 22% decline in container imports in April, compared to the record volumes of the previous year, to 812,611 teu… the top US east coast ports saw a 20% dip in container imports to 887,950 teu, to take the total of import containers handled by the Top 10 US ports to 1.7m teu in April representing a 21% fall on the same month of the previous year.” See chart below for Port of NY/NJ.

In its May 4 retrospective on first quarter 2023, AP Møller-Maersk reported, “… the trends observed in Q4 2022 continued in Q1 2023, with normalisation in Ocean and Air being accentuated by a strong destocking affecting volumes across all segments. Results continued to come off their Q3 2022 peak with a decrease in revenue year-over-year of 26% to USD 14.2bn (USD 19.3bn). ” Maersk loaded nearly one-tenth fewer containers in the first quarter this year than in 2022 (more).

Maersk expects that January-March will be its best quarter of 2023 with volume declines bottoming by the end of June.

According to the Financial Times the global collapse in container volumes (admittedly from a high peak) is hitting container manufacturers very hard, “production of 20-foot equivalent units — the industry’s standard size for a container— fell by 71 per cent from 1.06mn to 306,000 between the first quarter of 2022 and the same period this year.” Over 90 percent of shipping containers are manufactured in China. (More and more.)

Reduced demand is the principal cause of reduced volume of container flows. Velocity has also been slowed and a bit scattered by curtailed sailings, reduced speeds, and — even — drought impacting Panama Canal throughput (more).

G7: Six principles of Supply Chain Resilience

Supply Chain Resilience is not prominent in the Group of Seven’s headline Joint Communique. But in the G7 Leaders Statement on Economic Resilience and Economic Security the language is stronger than that emerging from the Finance Minister’s meeting in Niigata. Here’s the principal paragraph:

The COVID-19 pandemic and Russia’s war of aggression against Ukraine has laid bare vulnerabilities in supply chains in countries around the world. Supply chain disruptions have had devastating impact for developing, emerging, and advanced economies alike. We recognize that transparency, diversification, security, sustainability, and trustworthiness and reliability are essential principles on which to build and strengthen resilient supply-chain networks among trusted partner countries both within and outside the G7. We encourage all nations to support these principles on resilient and reliable supply chains. We reaffirm our strong will to support the wider international community, particularly developing countries, in building their resilience, including through implementing the Partnership for Global Infrastructure and Investment. Our partnerships honor international law, are free and fair, and foster mutually beneficial economic and trade relationships. Drawing lessons from recent incidents of weaponizing energy and other economic dependencies, we stand firmly against such behavior. We will enhance resilient supply chains through partnerships around the world, especially for critical goods such as critical minerals, semiconductors and batteries. We will step up our efforts to strengthen channels of communication to address supply disruptions and share insights and best practices, including from respective scenario-based stress testing.

Hardly ground-breaking, but reasonable and actionable with sustained, constructive effort. These are principles that can and should guide the next generation of local to global supply chains.

In my reading, the strongest language related to Supply Chain Resilience in the Joint Communique is in a specific reference to China:

Our policy approaches are not designed to harm China nor do we seek to thwart China’s economic progress and development. A growing China that plays by international rules would be of global interest. We are not decoupling or turning inwards. At the same time, we recognize that economic resilience requires de-risking and diversifying. We will take steps, individually and collectively, to invest in our own economic vibrancy. We will reduce excessive dependencies in our critical supply chains.

It is worth noting that “excessive dependencies” are not only related to what is sourced from China. Over-concentration of capacity is a recurring — even innate — feature of high volume, high velocity demand and supply networks. Reducing the risk of excess concentration requires ongoing vigilance, creative action, and meaningful investment.

Stefan Rousseau/Pool/AP

+++

May 24 Update: If you can, please read Martin Wolf’s May 23 commentary in the Financial Times: The G7 must accept it cannot run the world.

Probabilistically OK

Yesterday NERC released its 2023 Summer Reliability Assessment (more). The risk map for this summer has lots of orange but no red. This suggests some improvement from the recent Winter Assessment’s prominent bands of scarlet. (Please see map below.)

Fundamental to all of these assessments is careful consideration of generation capacity, transmission capacity, demand projections, and reserve margins. Appropriately — almost inevitably — this depends on probabilistic judgments. The Summer Reliability Assessment explains:

Regional Entities and assessment areas provided a resource adequacy risk assessment that was probability-based for the summer season… The risk assessments account for the hour(s) of greatest risk of resource shortfall. For most areas, the hour(s) of risk coincide with the time of forecasted peak demand; however, some areas incur the greatest risk at other times based on the varying demand and resource profiles.

Generation and transmission factors can experience operational variance, but will not exceed known physical constraints. So, push capacity may be less, but it will not be more than these upper limits. Demand for electricity typically tracks recurring patterns, but can demonstrate extreme volatility when experiencing extreme heat or cold. And… extreme weather often stresses and disrupts generation and transmission equipment. The upper reaches of pull can easily exceed the upper limits of push. This is almost always (or just always?) true in demand and supply networks. Below is a chart forecasting probable demand shifts for 2023 compared to 2022.

All this is very reasonable… as long as we recall that probabilities and actualities are often different.

More or less…

US retail sales increased slightly (0.4 percent) in April, according to the US Census Bureau… not adjusted for inflation.

Reuters headlined “solid spending.” CNBC emphasized the increase was “less than expected.” Bloomberg called it “steady.” (Solid and steady appeared in several summaries.) The Associated Press headlined an explanation for the growth: “buoyed by solid job market and declining prices in some areas.”

Writing in today’s Financial Times, Robert Armstrong highlights ambivalence, “The government’s retail sales report will not do much to clarify things… The April numbers came out yesterday and, compared with March, the numbers were better than expected — up 0.4 per cent, or 0.7 per cent without cars, car parts and gas. But the monthly numbers are volatile. The strong April follows a weak February and March, and an amazingly strong January.”

Related stories reference increased credit card debt (more), ballooning and looming student loan payments, and a still strong, but softening job market as good cause for skepticism regarding the future of “steady spending.” (And to reinforce ambivalence, here’s an alternate angle.)

This blog is especially interested in food consumption patterns. The first chart below is the Food-At-Home retail sales slope. In nominal dollars, US consumers are spending about one-fifth more on groceries than April 2019. But we have finally stopped spending more each month. (PCE food-at-home does a better job of giving us real slopes.) The second chart below, developed by Armstrong and others at the FT, shows us how the rate-of-change in late-pandemic retail sales has been highly dependent on spending at food service places (or Food-Away-From-Home).

Early 20th Century psychologists (usually starting with German vocabulary) gave us an understanding of ambivalence as “simultaneous conflicting feelings.” This is more or less a pejorative term with implications for uncertainty, indecisiveness, almost becoming a synonym for ambiguous. I prefer a more literal Latin derivation: both are strong, all around is vigorous. There are contending strengths.

Which strength will prevail or how will multiple strengths be conjoined? I agree it is not yet clear. Threats are certainly percolating. But these contending strengths offer opportunities. While demand growth is slowing, effectual demand for many flows remains quite high. Fulfilling such significant demand — with less volatility, up or down — can be a very constructive context for efficient, effective — even resilient — supply chains.

RISE (and shine?)

This week there will be a Group of Seven summit in Hiroshima, Japan (more and more). Last week the finance ministers and central bank governors of Canada, France, Germany, Italy, Japan, United Kingdom, and United States (and EU too) completed their related pre-meeting. In Saturday’s joint communique, the Niigata group teed-up attention to supply chain resilience (more and more). Here’s the paragraph:

We commit to further strengthening collaboration among G7 members and beyond to enhance supply chain resilience. Our “High-level Policy Guidance for Public Finance Tools to Build Resilient Supply Chains in the Era of Decarbonization” published in April, recognizes the urgent need to address existing vulnerabilities within the highly concentrated supply chains of important products for clean energy. Diversification of supply chains can contribute to safeguarding energy security and help us to maintain macroeconomic stability. To turn the guidance into specific actions, we are currently developing “Partnership for RISE (Resilient and Inclusive Supply-chain Enhancement)” with interested countries in collaboration with the WBG and relevant international organizations with the aim of its launch by the end of this year at the latest. Through mutually beneficial cooperation by combining finance, knowledge and partnerships, RISE aims to support low- and middle-income countries in playing bigger roles in the midstream and downstream in supply chains of clean energy products.

This is an example of how diplomatic prose often makes less of more. I imagine a delegation or two originally offering something like: “We commit to further strengthening collaboration among G7 members to enhance supply chain resilience. Diversification of supply chains can contribute to safeguarding security and help us maintain macroeconomic stability. We are developing Partnership for RISE (Resilient and Inclusive Supply-chain Enhancement) for launch before the end of this year.

Certainly vague, but enough to justify further discussion and processing for the next G7, G20, and other future consultations (including specific projects such as that noted). De-risking through friend-shoring, friend-making, and network diversification stays on the agenda. Another delegation or two, however, worries too much might be implied by this aspirational vagary. So, the implicit potential is explicitly narrowed to help low- and middle-income countries play bigger roles in midstream and downstream supply chains for decarbonization. Small steps? Perhaps, but the wrong sort of specificity can also become a strategic distraction.

Diversification of supply chains is — incrementally — moving forward because of fundamental risks (and opportunities) rather than waiting for diplomatic wordsmithing. See here and here and here and here and here and here (and much more). Substantive progress at this scope and scale can be slow, but is seldom as sluggish as too many diplomatic negotiations.

+++

One example of capacity concentrations in need of diversification are several so-called rare earths. Last year the Wilson Center brought together a set of related maps. One set is shown below. And… evidence of change in recent months is also available, for example, here, here, here, and here, but also here and here.

Mid-May Vital Signs

Since November this blog has looked at five vital signs (recently amended).

North American Agricultural Production: USDA is reporting a strong start to the US planting season. By May 7 farmers had planted half of the nation’s corn crop, more than a quarter ahead of May 2021-22. Around 35 percent of the nation’s soybean acreage was planted by May 7, also roughly a quarter ahead of last year. Flooding in California (and elsewhere) has delayed and complicated some fresh vegetable production. The prospect of improved irrigation levels is, however, much better news than the drought of recent years.. More and more and more and more. (In its April update the European Commission forecast that EU cereal production in May 2023-24 would be 287.1 million metric tons, against 267.9 million mt last year. Flows of grain from Ukraine remain constrained, both through the Black Sea and west into the EU.)

Global Natural Gas Demand and Supply: Fossil fuel energy markets have been soft and softer coming out of the Northern Hemisphere’s heating season and a slow (incremental? gradual? discouraging?) recovery in China combined with prospects for a US economic slowdown. US inventories of natural gas are about one-fifth above five year averages and almost one-third higher than last May. US Prices (Henry Hub) are back at late 2019/early 2020 lows. Both European prices (Dutch TTF) and Asian prices (Japan-Korea Marker) have reclaimed pre-war market levels. More and more and more and more.

China Export Volumes and Value: On May 9 Reuters reported, “China’s imports contracted sharply in April, while exports rose at a slower pace, reinforcing signs of feeble domestic demand despite the lifting of COVID curbs and heaping pressure on an economy already struggling in the face of cooling global growth.” Global pull is muted, so China’s push is a bit less vigorous (the manufacturing PMI has actually contracted). China’s domestic demand has not roared back as some had hoped (more and more and more). China’s exports to the US are down by over six percent. China’s imports from the US are down more than three percent (including reduced imports of corn as China shifts to less expensive Brazilian suppliers). But… April’s outcomes should be viewed in the context of HUGE outbound flows from China far exceeding pre-pandemic patterns. Please see second chart below, showing exports through the end of March.

North American Grid Capacity: On May 11 there was a meeting of the Board of Trustees of the North America Electric Reliability Corporation (NERC). Several capacity challenges were discussed. According to meeting minutes early in the session NERC President and CEO James B. Robb noted, “the continuing challenges of preparing the grid to operate reliably during extreme weather events. He also stressed the need to shift how industry plans for energy sufficiency and essential reliability services, recognizing that one no longer brings the other in light of the changing resource mix” (my italics added). Next week (May 17) NERC will release its summer reliability assessment. According to Reuters, a board meeting preview indicated, “if summer temperatures spike and become more widespread, the U.S. West, Midwest, Texas and Southeast, New England and Ontario (in Canada) may experience resource shortfalls.” Not surprising. But as we have seen, surprises are still possible.

US Personal Consumption Expenditures: This blog gave specific attention to the most recent PCE results (here and here). Nominal PCE is flat, real PCE is slightly lower (see chart below). Last week’s Consumer Price Index for April suggests recent trends are persisting (here and here). Adjusted for inflation, US consumption expenditures are now broadly consistent with pre-pandemic trend patterns. Current wage patterns should support something close to this trend continuing. Constrained credit-markets and related purposeful demand destruction should restrain upward movement. Pull and push are close to equilibrium… for now.

Late last month I had some troublesome chest-pain. I had no preexisting conditions. At my primary care physician’s office they checked my vital signs: all superb. My anxiety (and theirs) immediately subsided. It took awhile but an odd, entirely ephemeral cause was finally diagnosed. A couple of modest interventions and two weeks later the pain is mostly gone. What I see above is also a strong set of vital signs. Unfortunately, sources of anxiety for global supply chains do not strike me as quite so transient.

US food prices

The April Consumer Price Index shows another month of stable to lower food-at-home prices (see chart below). According to the Bureau of Labor Statistics:

The food index was unchanged in April. The food at home index fell 0.2 percent over the month, following a 0.3-percent decrease in March. Four of the six major grocery store food group indexes decreased over the month. The index for fruits and vegetables decreased 0.5 percent in April, and the index for meats, poultry, fish, and eggs declined 0.3 percent over the month. The dairy and related products index decreased 0.7 percent in April as the milk index fell 2.0 percent, the largest decline in that index since February 2015. The nonalcoholic beverages index declined 0.1 percent over the month. In contrast, the index for other food at home rose 0.2 percent in April, following a 0.4-percent increase the previous month. The cereals and bakery products index increased 0.2 percent over the month, after advancing 0.6 percent in March… The food at home index rose 7.1 percent over the last 12 months. The index for cereals and bakery products rose 12.4 percent over the 12 months ending in April. The remaining major grocery store food groups posted increases ranging from 2.0 percent (fruits and vegetables) to 10.4 percent (other food at home).

This is further evidence of general equilibrium of demand and supply in the grocery sector. There are always some stock-outs. There may be somewhat more now as supply adapts to late-pandemic and post-pandemic demand patterns. But for the vast majority of SKUs in the vast majority of places, where there is effectual demand there is also supply.