Month: April 2023

US consumption slows

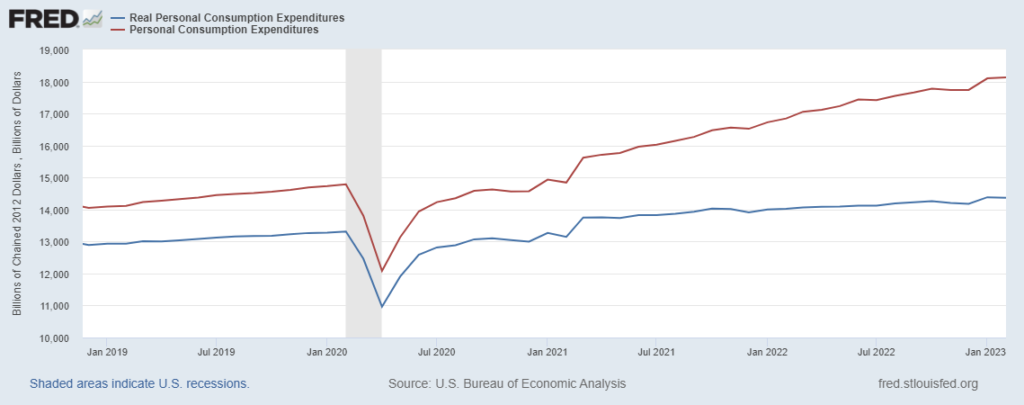
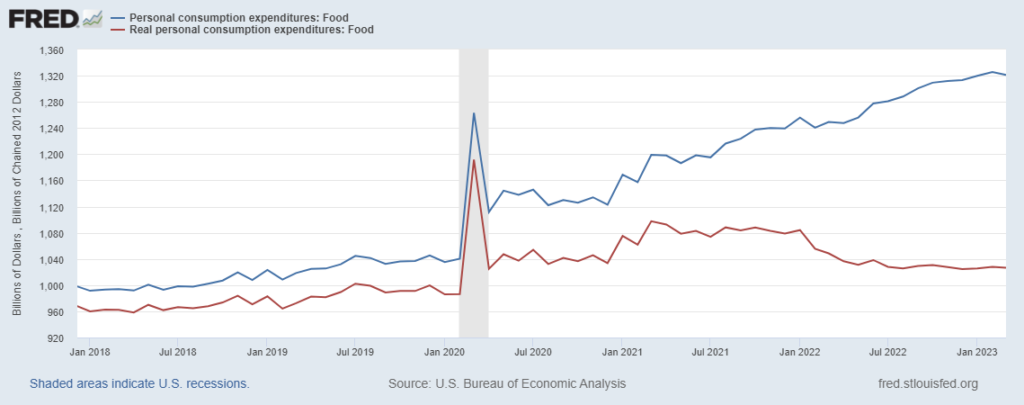
March Personal Consumption Expenditures suggest an essentially flat first quarter for pull. Please see first chart below.

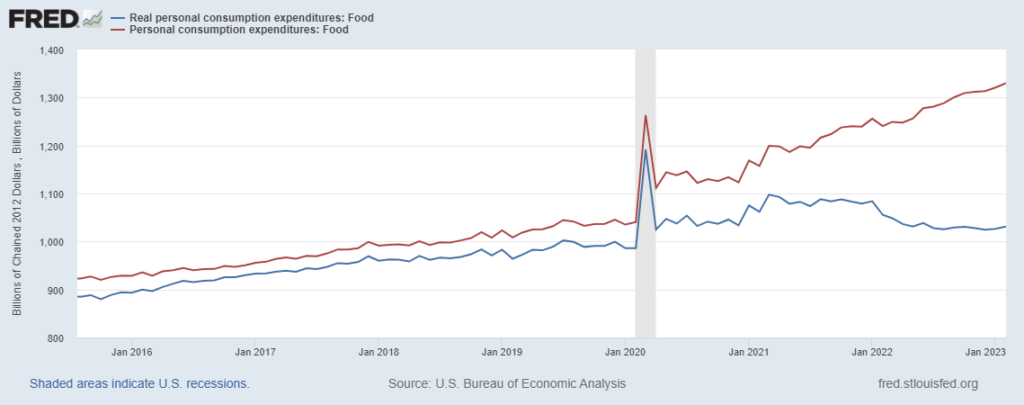
For the first time since April 2022 nominal food consumption was slightly softer (real expenditures as well, red line in second chart). Reduced SNAP benefits almost certainly played a part.

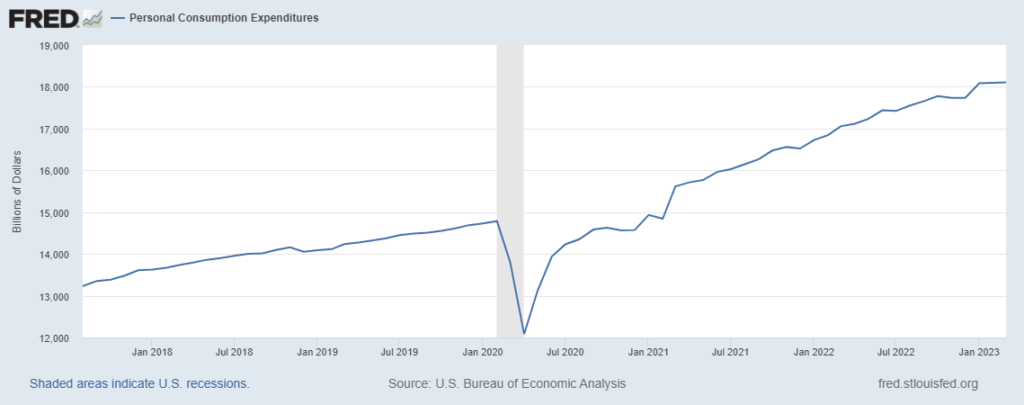
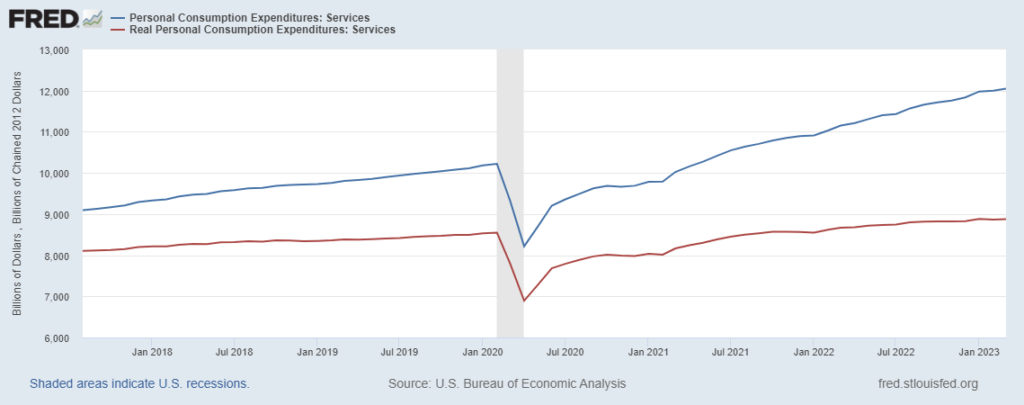
Even services seem to have been slightly less enticing in March (please see third chart below).

Most media and market analysts look at PCE results to reckon inflation’s trajectory and possible credit tightening (here and here). The implications for supply chains are, perhaps, more encouraging. “Real” consumption remains robust. Given the comparatively high level of consumption expenditures, flat growth is sustainable, potentially profitable, and better than the reverse.

Consumption has been soft in the Eurozone (more). China’s current demand dynamics remain uncertain. Tomorrow is the start of a five day holiday in China. Spending over the next few days may deliver some insights regarding the prospect for more or less pull over the next few months.

[To which a reader promptly provided this rebuttal regarding China’s potential holiday spending surge. The Bloomberg report includes: “People are still not confident in the strength of the recovery. CPI remains muted and the jobless rate stays elevated,” said Wang Huan, fund manager at Shanghai Zige Investment Management Co., adding that an increase in tourists may not necessarily translate into revenue growth.” Then shortly before midnight on Saturday, I received another Bloomberg blurb suggesting something less than strong pull from China any time soon according to the April Purchasing Managers Index.]

+++

May 2 Update: Early reports on consumer spending during China’s Golden Week are reminiscent of “revenge spending” seen in other economies as each emerged from pandemic restrictions. See here and here.

May 4 Update: The Financial Times reports that China’s holiday spending has recovered pre-pandemic levels. “China recorded 274mn domestic trips over the five days to Wednesday, according to the Ministry of Culture and Tourism, 71 per cent higher year on year and 19 per cent higher than in 2019.”

May 8 Update: The Financial Times reports that regardless of May Day holiday spending, the pace of China’s recovery is slower than some expected. Included in the FT report: Tim Ryan, US chair of PwC, noted in an interview that US companies’ awareness of “concentration risks” in China had grown from the tariff battles early in Donald Trump’s administration to the supply chain disruptions caused by the pandemic. “To be clear, I’m not seeing a decoupling” between the US and China, he said. “What I am seeing is more attention to how do you manage risks. What’s happened in the past couple of weeks is more validation that they need to continue to manage risks.”

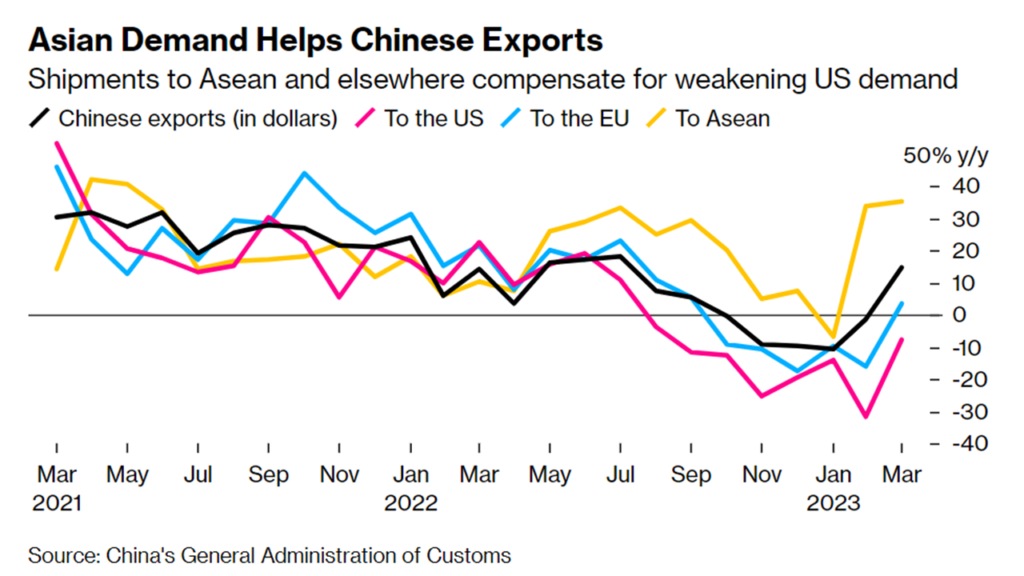
May 9 Update: Bloomberg reports, “Overseas shipments expanded 8.5% from a year earlier to $295 billion, the customs administration said Tuesday in Beijing — slowing from the double-digit gain in March. Imports, though, dropped 7.9% to $205 billion, much worse than the median projection of a 0.2% decline.” The year-over-year volatility should not obscure that exports remain almost one-sixth above pre-pandemic and imports are about 12 percent higher than April 2019.

Christmas eve surprise reprised

In November 2022 the North America Electric Reliability Corporation (NERC) released its Winter Reliability Assessment. This report warned, “A large portion of the North American BPS [Bulk Power System] is at risk of insufficient electricity supplies during peak winter conditions.” NERC also highlighted the challenges associated with transmission system limitations during “large power transfers during stressed conditions.”

Of twenty regional transmission organization’s (RTOs), PJM was assessed as being more robust and resilient than most. NERC reported, “PJM expects no resource problems over the entire 2022–2023 winter peak season because installed capacity is almost three times the reserve requirement.” PJM coordinates movement of wholesale electricity in all or parts of Delaware, Illinois, Indiana, Kentucky, Maryland, Michigan, New Jersey, North Carolina, Ohio, Pennsylvania, Tennessee, Virginia, West Virginia, and the District of Columbia. PJM serves more than 65 million customers and covers almost 370,000 square miles. (This is larger than France, United Kingdom, Belgium, and Netherlands combined.)

On December 20, 2022 PJM issued a Cold Weather Advisory for what some would call Winter Storm Elliott. On December 21 the warning was upgraded to a Cold Weather Alert. Over the next three days additional warnings and alerts were released, all focused on maximizing generating capacity for expected high demand. Millions of Americans traveling for the year-end holidays were also quite aware of impending extreme weather. My wife and I almost decided to stay home, then adjusted our travel times and routes to better ensure we were in a safe place before the worst would arrive.

On the morning of December 23 PJM declared a Synchronized Reserve Event. The SRE instructs all generation resources to manually increase output to full. At 5:30 in the evening that same day PJM released an emergency instruction for operator-specific load-reductions and a separate order to deliver maximum generation to the network. Still, over the next 24 hours PJM struggled to avoid wide-spread blackouts. Other RTOs and individual electric providers were forced to initiate rolling blackouts (here and here).

There was a sharp increase in demand that supply just barely matched (please see the first chart below), despite all the warnings and efforts to increase supply, despite having installed capacity 3X reserve requirements. On December 24, shedding non-residential demand was probably as important to maintaining flow as increased generation.

On Christmas Eve PJM and the rest of us were rudely reminded that installed capacity is not necessarily operating capacity. According to immediate after-action assessments,  over one-fifth (almost one-quarter) of PJM’s generating fleet was offline on Christmas Eve because of plant equipment problems and fuel supply failures. As highlighted in the second chart below, gas-fired (non) generation accounted for 70 percent of unplanned outages at PJM.

Consistent with prior agreements, over $2 billion in penalties have been assessed for failure to comply with PJM’s maximum generation orders. At least one utility is in the process of bankruptcy reorganization as a result of these penalties. Various efforts are underway to mitigate potentially counter-productive consequences of such penalties (here and here).

PJM’s internal analysis of causes and consequences related to Winter Storm Elliott is still underway. There will, no doubt, be a host of functional, financial, and technological reforms to consider. But from a Supply Chain Resilience perspective it is valuable to recognize the fundamental risk dynamics at play when fixed production/distribution capacity interacts with highly volatile demand and exogenous shocks. A reserve capacity thought to be three-times necessary in November was just barely enough one month later… not because the capacity per se was reduced, but because upstream channels delivering resources to the electric generation and distribution systems literally froze. Figurative freezing is an even more frequent risk.

Ukraine spring planting update

Before the war Ukraine was one of the world’s top five grain exporters. According to Deutsche Weld, in 2021 Ukraine accounted for 10 percent of the world wheat market, 13 percent of the barley market, 15 percent of the corn market, and more than half of global trade in sunflower oil.

Since the February 2022 invasion, grain exports from Ukraine have been at least one-third less than 2021. It might have been much worse except for a deal brokered by the United Nations and Turkey to facilitate Black Sea flows.

According to the EU, as of March 2023, “over 23 million tonnes of grain and other foodstuffs have been exported via the Black Sea Grain Initiative. Almost 49% of the cargo was maize, the grain most affected by blockages in Ukrainian granaries at the beginning of the war (75% of the 20 million tonnes of grain stored). It had to be moved quickly to make space for wheat from the summer harvest.”

The 2022 summer harvest was disrupted by the war. According to government sources, as of January 2023, “Ukrainian farms have harvested 49.5 million tonnes of grain from 10.7 million hectares of crops, with the grain yield averaging 4.64 tonnes per hectare.” Final results from the harvest are expected at 51 million tonnes of grain for 2022, down from a record 86 million tonnes in 2021, because of land occupied by Russian forces and lower yields (more).

Of course the war continues — Spring offensives and counter-offensives are pending. Further reductions in planting and harvesting are anticipated (more and more). In April Russia limited extension of the Black Sea flow to thirty days (more and more). Many do not expect the initiative to survive mid-May. Exports by river and rail heading toward Western European markets and ports have also been logistically and politically complicated (more and more and more). Some credible sources suggest that this year Ukraine’s harvest will fall another 37 percent year-over-year to 34 million tonnes. Export channels will continue to be troubled, especially if Black Sea routes are lost.

It is very early in the Northern Hemisphere’s planting season. Harvests cannot yet be confidently predicted. Still, the USDA offers, “The global wheat outlook for 2022/23 is for increased supplies, higher consumption, and reduced trade and stocks. Supplies are raised 0.7 million tons to 1,061.1 million, primarily on higher beginning stocks for Syria and increased production for Ethiopia.” Hence the price action displayed below. USDA is not as optimistic regarding corn and rice.

+++

April 28 Update: Javier Blas considers the mismatch of supply and demand for Ukraine’s grain, “Ukrainian grain is badly needed in Europe – just not where is accumulating [e.g., Poland, Romania and Hungary]. Instead, it’s sought after in Spain and Italy, already suffering from a drought, and in the Netherlands, home of a very large livestock industry. But moving it there is difficult.” Blas very helpfully outlines logistical and supply chain difficulties that policy-makers have not — yet — engaged.

Current conditions in Spain and June forecasts for Spain, France, and other parts of Western Europe suggest another hot, dry summer.

Unusually cold weather in Northern China is likely to seriously reduce this year’s harvest of apples and other fruit.

Sudden snowmelt in California threatens planting and harvesting of a variety of crops.

April 29 Update: Nice summary from Bloomberg Green: “Dry conditions are occurring across much of Spain, through southern France and into northern Italy. The eastern and southern Black Sea areas are also stressed, according to the European Drought Observatory. In addition to southern Europe, large parts of Norway, Sweden and Finland are lacking soil moisture. New figures show the US is facing similar trouble. The latest from the US Drought Monitor shows 25.55% of the contiguous US (the 48 states) is in drought. Most of that is in central and lower Great Plains: 81.92% of Kansas and more than half of Texas is in drought.”

Natural Gas: Been to the mountain and back?

Below is a two year view of a benchmark futures contract for natural gas in Europe. This nicely scopes and scales nervous demand for replacing Russian flows with alternate flows for the winter now behind us.

It went much better than I was expecting last May-June.

In August 2022 more than 300 Euros were required to purchase what was available yesterday for a shade over 40 Euros. That’s an eighty-seven percent drop.

The second chart below is the spot price for natural gas at the Henry Hub (on the US Gulf Coast). The same-volume could be promptly purchased for less in New York or Chicago (Henry Hub pricing is much more export oriented). Seems to me this is the same mountain range as Dutch TTF was traveling, just a slightly different path. Since August we have descended from a high of almost 10 dollars to last Wednesday’s spot price of $2.20. That’s a seventy-eight percent drop.

Last summer might a buyer in Rotterdam be nine percent more nervous than a buyer in Lake Charles? Amsterdam-Rotterdam-Antwerp (ARA) traders have a well-deserved reputation for self-composed discipline. For example, yesterday you could a buy a Dutch TTF February 2024 contract for 55.5 Euros/MW.

I expect European natural gas stockpiles to be re-filled in time for next winter. But I am not willing to bet on next winter being quite so mild… and I expect the war in Ukraine to get very hot (here and here and here). There are plenty of other externalities that I am not as inclined to discount as deeply as my Dutch cousins and Flemish friends.

More (concentrated) capacity

The expansion of ExxonMobil’s Beaumont Refinery is significant (more and more). After three years of declining US refining capacity, adding a quarter-million barrels per day is helpful.

US domestic demand for refined products is experiencing long-term decline. But ready production capacity needs to be larger than realistic demand capacity — and this ratio has been closing fast, probably too fast. Beaumont’s expansion — and new refineries outside the United States — offer much needed adaptive capacity, constructive for resilient volumes and pricing.

Since the turn of the century, US refining capacity has increased from about 16.3 million barrels per day to just a bit more than 18 million barrels per day (even as real GDP has increased from about $1300 billion to more than $2000 billion). This increased capacity has been achieved despite thirty-three US refineries closing since 2000. There are now 128-to-131 US refineries poised to operate, depending on maintenance schedules.

The top-ten percent of the US refinery fleet by capacity can produce close to one-third of total flows. The top twenty percent can generate more than half of total flows. Seven of the largest capacity refineries (plus others) are shown on the first map below. These seven refineries alone represent one-fifth of total US refining capacity… all well-within the well-worn paths of hurricane alley.

On the Pacific capacity concentrations reflect even higher proportions of each region’s flows. Please see the second map below. Four refineries north of Seattle produce most of the fuel on which Western Washington and Oregon depend. The refineries along the edges of San Francisco Bay are as crucial for northern and central California. Refineries in the Los Angeles basin serve Las Vegas, San Diego, and Phoenix too. All these refineries and their related pipelines are susceptible to potentially serious seismic consequences.

The Threats (T) are very real, so are the concentrated Vulnerabilities (V). Given these capacity clusters and population dependence, the Consequences (C) will be terrible when a high-impact threat scores a direct hit on any of these core vulnerabilities (that are usually strengths).

LEGEND: barrels are refineries, dark brown are crude pipelines, light-brown are refined pipelines, blue flames are natural gas processing facilities.

+++

April 28 Update: Valero’s quarterly results provide a helpful window into tight capacity serving robust demand.

Revised Vital Signs

Since November we have monitored five indicators of Supply Chain Resilience. These have been intended to supplement more comprehensive measures such as the Global Supply Chain Pressure Index (GSCPI) and the CSCMP Logistics Manager’s Index. These and similar indices remain important. (Here are the vital sign updates for December, January, February, and March.)

It is now time for some seasonal updates.

Since Thanksgiving I have focused on southern hemisphere agricultural production; starting now I will shift to northern hemisphere agricultural production. Instead of diesel demand and production, I will shift to flows and prices of natural gas. I will continue to focus on China’s export volumes and prices. I will continue to look at what is happening with North American capacity to produce and transport electricity. I will replace covid consumption of hospitalization with US Personal Consumption Expenditures (despite the increasing risk of pandemics).

As usual, I will try to discern the dynamics of pull and push, especially of any friction emerging between pull and push. There is a bias toward fulfilling US demand. There is particular concern for food and energy flows.

North American Agricultural Production: US winter wheat has been seriously stressed by drought. Planting corn is being delayed by snow and wet weather. Soybean planting is just barely getting underway in the core US soybean producing regions. (More and more) Winter still reigns over most of Canada. USDA projects that US acres-under-cultivation will increase in 2023 (more). We will see what El Nino may mean for the growing season and yields.

Global Natural Gas Demand and Supply: The northern hemisphere’s “heating season” concluded on March 31. This season featured low demand due to a comparatively mild winter. According to the Energy Information Administration, “Net withdrawals of natural gas from underground storage facilities totaled 1,707 billion cubic feet (Bcf) during the 2022–23 heating season (November–March)—the lowest on record since the 2015–16 heating season. Working natural gas in underground storage facilities in the Lower 48 states totaled 1,830 Bcf as of March 31, 2023, according to the Weekly Natural Gas Storage Report (WNGSR), exceeding the five-year average (2018–22) by 294 Bcf (19%), after entering the heating season at a 110 Bcf (3%) deficit to the five-year average.” (More) Due to both mild weather and aggressive purchases, EU natural gas inventory levels are now more than double (56 percent) of end of March 2022 stocks-available (26 percent) (more). Natural gas prices have trended sharply lower since mid-2022 (here and here).

China Export Volumes and Value: Earlier this week Reuters reported, “China’s exports unexpectedly surged in March, with officials flagging rising demand for electric vehicles, but analysts cautioned the improvement partly reflects suppliers catching up with unfulfilled orders after last year’s COVID-19 disruptions.” (More) For the six months before March exports have consistently fallen from very high levels through most of 2022. Bloomberg highlights that this increased (temporary?) push reflects much more pull from East Asia than from the US or EU. Please see chart below.

North American Grid Capacity: Increasing demand for electricity is prompting construction of additional generating capacity. According to the Energy Information Administration, renewables will provide the highest proportion of new capacity. Current capacity (see second chart below) remains mostly dependent on fossil fuels. Capacity to generate does not necessarily translate into capacity to deliver. According to UtilityDive, “Since the last wave of major U.S. transmission development about 10 years ago, the transmission system is running out of spare capacity… The growing queues of generators seeking to connect to the grid are a symptom of the maxed out transmission system… Major power system failures and instances of congestion are likely to increase without transmission expansion.” (More and more)

US Personal Consumption Expenditures: US consumers have continued to spend. Friday’s retail sales report found a slight decline in spending between February and March, but year-over-year figures remain robust. For example, retail sales of Food-At-Home were eight percent higher than February (not inflation-adjusted). First quarter sales at food and drinking places (Food-Away-From-Home) were 17.3 percent above first quarter 2022. There is still cause to anticipate some softening of March Personal Consumption Expenditures (please see third chart below). SNAP benefits have been cut and wage growth has slowed, plus some speculate the mid-March banking crisis might have suppressed expenditures. It will be another two weeks before we see the March PCE.

Healthy pull is, so far, prompting improved push. There is not much excess capacity. But pull is mostly being fulfilled. The problems emerge where there is real need, but insufficient pull (more and more and more). There is also reason to wonder if supply capacity can keep up with the increasing rate of demand capacity growth.

Real consumption of food

February expenditures on Food-At-Home — adjusted for inflation — have once again increased. An updated January real PCE for food has also been adjusted upward (see chart below).

In February 2019 real Personal Consumption Expenditure (PCE) for food was $964.1 billion. In February 2020, just as the pandemic began to emerge, inflation adjusted expenditure on food was $986 billion. Then demand went crazy.

By February 2022 real PCE for food had fallen from unsustainable heights to $1055 billion. This February US consumers spent about $1031 billion on Food-At-Home. You can do the math. US consumers have apparently lifted their floor for grocery purchases… despite significant food inflation and plenty of competition for their spending. It will be interesting to see how the cut in SNAP benefits may shape the slope of the March PCE for food (released in late April).

During February spending for Food-Away-From-Home may have slightly declined (here and here). But strong employment (and demand for employees) and wage growth continue to support above “normal” (whatever that may mean anymore) grocery purchases. Food production, processing, and transportation have increased capacity to support this demand. The personal saving rate has moved up since a mid-2022 trough. Looks like food flows are likely to remain close to these elevated levels as long as employment and wages will allow.