Month: October 2022

Bottlenecks persist, chokepoints shift

Concentrated capacity is a key feature of contemporary demand and supply networks. Well-designed bottlenecks enhance the speed, accuracy, and cost-efficiency of flows. But beautiful bottlenecks can become troublesome chokepoints, especially when demand is volatile or exogenous impediments emerge (e.g., natural disasters, government interventions, war…)

Here are three current examples: 1) Black Sea grain flows, 2) Gulf of Cadiz LNG flows, and 3) San Pedro Bay off Los Angeles.

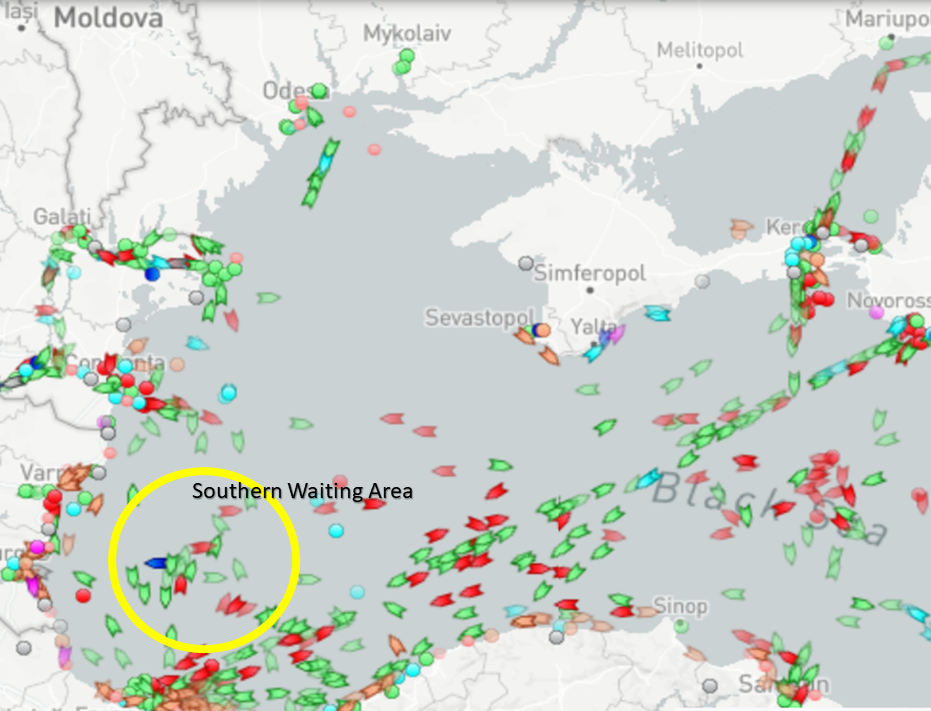
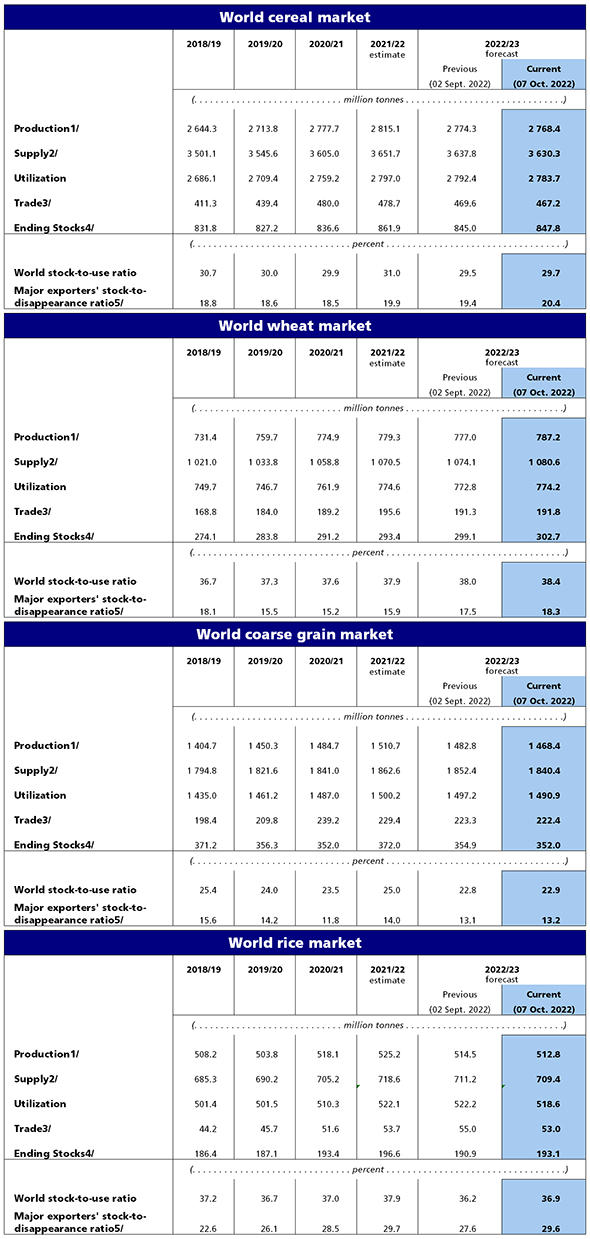
The Black Sea Grain Initiative has been much more successful than I expected. Sustained demand has not surprised me. Prices have been bouncy, but comparatively higher. The level of Russian cooperation has surprised me. The risk-readiness of grain carriers has also surprised me. In recent weeks Russian cooperation has ebbed even as world demand and carrier readiness has, if anything, escalated. The outcome, according to the United Nations, is “There are currently over 150 vessels waiting around Istanbul to move and these delays have the potential to cause disruptions to the supply chain and port operations.” (See map below.)

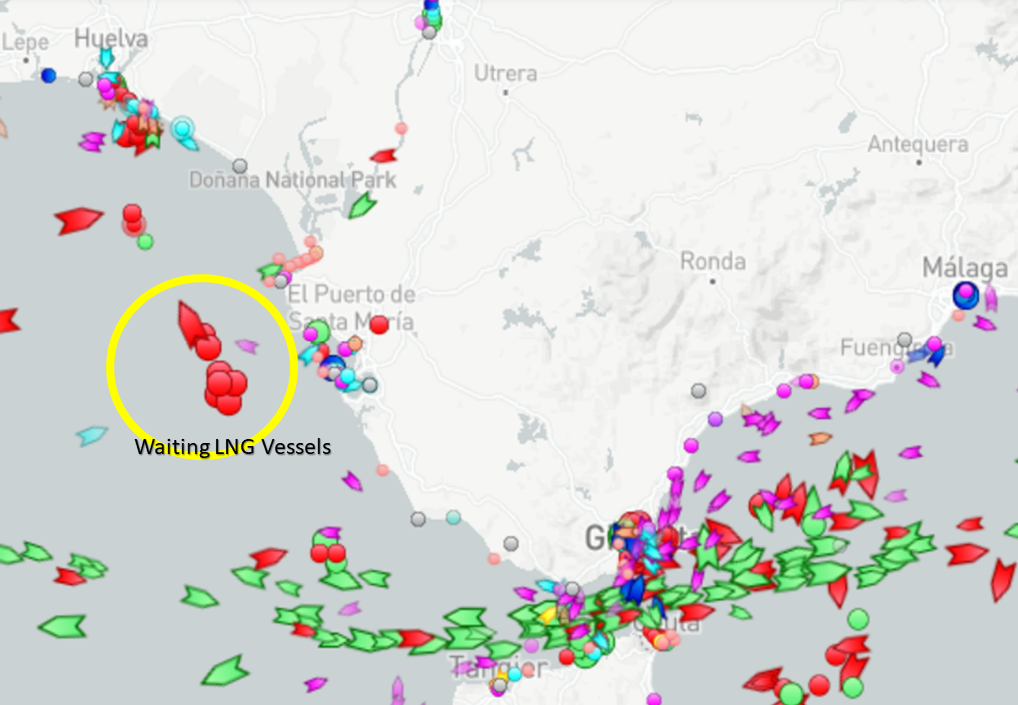
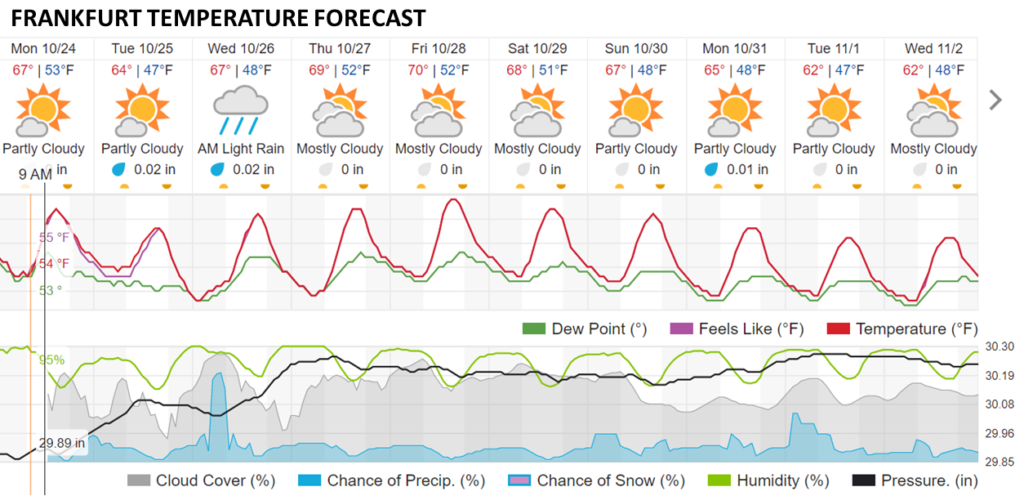
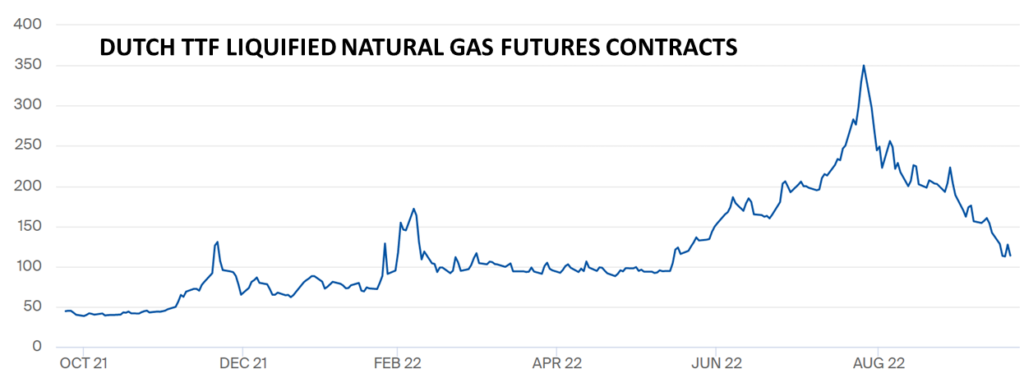
Strong demand to build European winter inventories of natural gas resulted in higher prices that attracted more flows. Recent warm weather has reduced typical demand for autumn residential heating and a combination of an economic slowdown and high prices has reduced industrial demand for energy. LNG prices have fallen. Sooo… according to Reuters and others, “several” LNG vessels are anchored or cycling off European LNG ports. (See map below) “They are waiting for higher prices. If one single idling vessel discharges its cargo, the price will immediately collapse by affecting the other cargoes on the queue and this domino effect is so painful in terms of opportunity cost.”

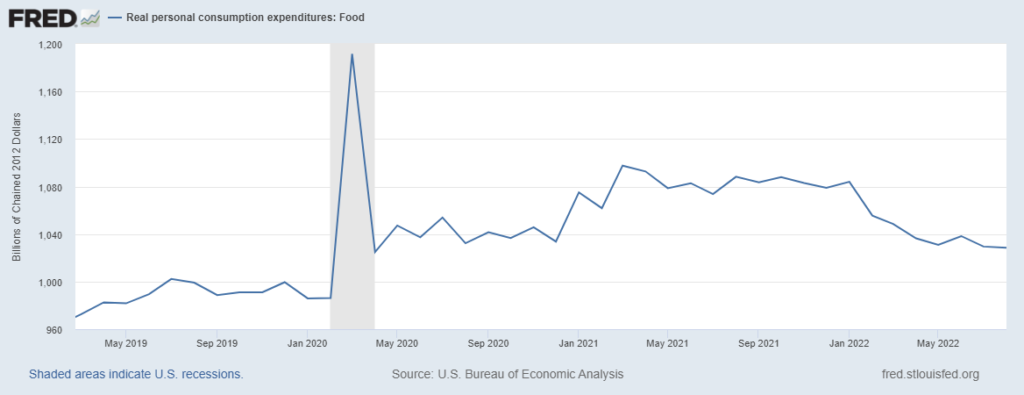
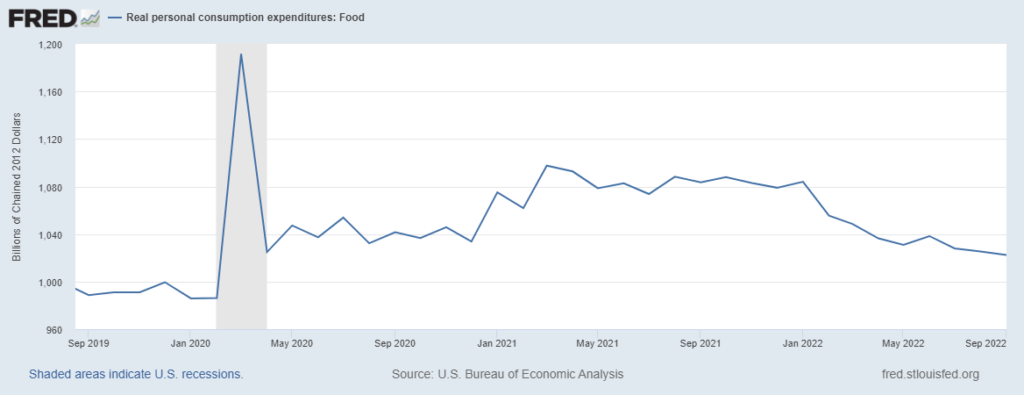
Meanwhile, last week the Wall Street Journal reported, “The backup of container ships off Southern California’s coast that was at the heart of U.S. supply chain congestion during the Covid-19 pandemic has effectively disappeared.” In January there were over one-hundred vessels waiting to dock at LA or Long Beach. More recent queues are in the single digits. The Journal explains, “U.S. import volumes are declining, according to trade data analysts, and a growing share of the shipments are heading to ports on the East and Gulf coasts as importers ship away from the Southern California backup.” Reduced demand (here and here) and agile velocity

Constraints on preexisting push cause price increases. Higher prices tend to pull more flow, which will increase congestion unless a way is found around the constraints or to fix the constraints. These three examples — at least so far — suggest that when 1) demand is more need-based than want-based and 2) need-based demand can be effectually expressed (when pull can afford to pay the price), that flow will find a way to connect supply with demand. Exceptions have been seen and can easily be imagined. But the power of pull should not be under-estimated.

Black Sea grain flows (and congestion)
Gulf of Cadiz LNG flows (and congestion)

Agile Velocity

Supply Chain Management is different than logistics. Logistics is a crucial component of Supply Chain Management. But compared to 5000-plus years of logistics, contemporary Supply Chain Management is much more able — and agile — targeting when and where and how flows are organized around demand. Supply Chain Resilience often depends on this agility.

A good example of this was briefly outlined in yesterday’s (October 25) ADM analyst call on Third Quarter earnings:

Tom Palmer (Analyst with J.P. Morgan)

I wanted to ask on the barge delays on the Mississippi River. Does this have much effect on your business as we look towards the fourth quarter? Is it — if there is impact, should we mainly think about it being in Ag Services, or just given the diversity of your business, are there offsets to consider?

Juan Luciano (CEO of ADM)

Yes. Of course, we have an unprecedented situation and especially in the Lower Mississippi River that will reduce the volume of exports for Ag Services North America. As it’s going to be a negative impact in Ag Services North America, of course, that — part of that is because of soy and we’re going to lose that volume. In the corn side, we’re probably going to extend the window of exports from North America into the first quarter. So part of the offset is you’re going to see that in the first quarter. I think also part of the offset is South America will be able to export more. We are a large exporter in South America, of course, and you’re going to see that.

And then normally, what we noticed or we expect to happen because we’ve seen it before, is when you export less from North America, where destination marketing sometimes get a little bit of a pop in margins, the products and destination become naturally more valuable, if you will. That was part of the original strategy of going into destination marketing. And then, the other impact is that as beans are not exported that matters not that much demand, local values come down, local bases come down and that may be a boost for crush that you may be able to crush lower-priced beans or maybe eventually lower-priced corn for Carbohydrate Solutions. So, we see some puts and takes. So probably negative for North America Ag Services and Oilseeds, maybe neutral for Ag Services and positive overall maybe for the whole.

My interpretation: Given current constraints on Mississippi barge traffic, ADM’s ability to export US soybeans is constrained. As a result, the company anticipates exporting a higher volume of South American soybeans than usual. By adapting available sources and channels, “destination market” demand for soy will be fulfilled (probably at slightly higher margins than otherwise). Because of current capacity to store the US corn harvest, these exports can be delayed until US river levels recover. US domestic flows not exported will be redirected to US domestic processing, perhaps with slightly better margins for ADM, slightly poorer margins for grain producers.

Sooo… by agile management of product flows across extended time and space, ADM can still fulfill high volume near-term demand despite chokepoints that have emerged. Logistical constraints are mitigated by creatively engaging the global “watershed” of supply to fulfill specific demand.

Global Fuel Flows

[Updates Below] Europe’s need to replace lost Russian energy supply has discombobulated markets, channels, and global flows. Nervous demand wants to pull more energy than long neglected and currently disrupted fossil fuel capacity can confidently — affordably — fulfill (more and more and more and more and more).

As a result of Europe’s precipitous pull on non-traditional channels (skewed by the prospect of a war-time winter) fuel prices are higher — which limits the ability of demand to pull much harder. European uncertainty regarding the ability to pull sufficient flows to fulfill minimum social and economic needs is a principal cause of global energy price volatility.

Given China’s zero-covid policies (more, and strengthened statism), Europe’s recession, and an induced counter-inflationary US economic slowdown, net global demand for energy is likely to remain off-peak for months ahead. But local shortages and price surges are also likely as mostly fixed capacity tries to adapt to (and exploit) the turmoil resulting from Russia’s invasion of Ukraine — and all its cascading consequences.

With care the behavior of this complex adaptive system can be broadly anticipated. It cannot — will not — be precisely predicted. In a personal effort to perceive emerging strategic context, I will give recurring attention to:

Frankfurt, Germany’s temperature (more and more, see below). This may be a meaningful indicator of energy demand in Europe’s densely populated industrial heartland.

Liquified Natural Gas (LNG) price futures, especially at Rotterdam (Dutch TTF, see below) and in comparison to the US Henry Hub. LNG constitutes a significant replacement proportion for lost Russian natural gas flows. Higher prices will signal supply falling below demand and/or fear of insufficient supply (more and more).

Diesel price futures, especially comparing Amsterdam-Rotterdam-Antwerp (ARA, see below) to New York Harbor ULSD. Even if LNG flows mostly match lost natural gas flows, there are myriad potential energy gaps. Diesel is a flexible gap-filler. But low diesel inventories and limited production capacity may be unable to close some crucial gaps (more and more).

Taken together these sources may provide early warning signals in terms of shifting directional balances between global demand and supply (admittedly with a trans-Atlantic bias).

+++

October 25 Update: Nice summary of immediate petroleum market realities from Bloomberg. Below is an Infographic from S&P Global that clearly complements the situational assessment I offered on Monday morning.

October 26 Update: Very helpful summary by S&P Global of the significant shifts in global demand for LNG as a result of Europe’s need to replace Russia’s pre-war supply of natural gas.

November 4 Update: Warm temperatures, less-heated economic behavior, full storage tanks, and better-than-expected supply have continued to suppress Europe’s immediate thirst for LNG. More than thirty LNG vessels are cycling off Europe waiting for prices to increase — some are even giving up and heading toward Suez searching for better markets farther east. EU access to LNG-alternatives — such as here and here — are watched almost as closely as the weather.

Global Food Flows

Demand is strong. Supplies are disrupted, but — so far — sufficient. Prices are comparatively high, but not as high as earlier this year. The September Food and Agriculture Organization’s cereal production forecast is close to the high end of the last decade’s volumes, but slightly less than last year (see charts below, more and more).

Several key channels for shipping food are constrained. Black Sea flows are limited by war, but since July an agreement brokered by the United Nations and Turkey has facilitated 285 shipments from Ukrainian ports carrying 6,429,098 metric tons of grains and other foodstuffs. (The current agreement will sundown in November unless renewed.) Canada’s rail capacity is struggling to deliver the flow needed for a strong harvest. Significant drought in both the Danube and Rhine River basins has reduced yields, complicated barge transport, and reduced supply velocity. The Yangtze River is also running very low (more). In recent weeks there have been more low-water closings than usual on the Mississippi River. Urgent dredging has been required to reopen flows. (To be sure, extreme weather is an equal-opportunity threat: floods have complicated commodity flows in Australia, Pakistan, and Thailand).

Food demand is often constrained by the consequences of a very strong US dollar. In more affluent nations, such as the United Kingdom and Japan, the cost of food imports, often priced in dollars, has increased substantially over the last six months. In less affluent nations, such as Lebanon and Sri Lanka — with sparse dollar reserves — the ability to pay is being tightly squeezed or exhausted (more and more).

In 2022 enough food is being produced to feed the world’s population. But production patterns are becoming less predictable as climate change accelerates and production costs increase (more). Sufficient distribution capacity exists, but is vulnerable to a wide variety of potential disruptions. Distribution capacity is especially shallow and fragile where the ability to express effectual demand — in other words, the ability to pay market prices — is weakest. According to some credible sources, of almost 8 billion residents of the planet, about four out-of-ten cannot currently afford to purchase a healthy diet.

US food demand remains elevated

[Update Below] According to the Federal Reserve, Americans continue to purchase food-at-home well above pre-pandemic patterns. In August 2019 US consumers expended $999.1 billion on groceries and related. This August we spent $1028.5 billion. (These are each chained 2012 dollars, see chart below). For further comparison, in August 2012 we spent $845.7 billion. The US population increased about seven percent over these ten years.

This higher demand has persisted even after we returned to restaurants and other food-away-from-home services in Spring 2021. In August 2019 Americans spent $65,191 million at food services and drinking places. This August we spent $86,760 million (not inflation adjusted, here you can see comparable grocery retail sales). Our personal savings rate in August 2022 was less than half that in August 2019.

Another angle on food consumption is offered by the research and consulting firm IRI which finds current cash-basis demand in early October 2022 to be at least seven percent above October 2021 — thirteen percent higher in the “general food” category. As a result, after several weeks of improved demand-supply equilibrium, stock-outs are, again, beginning to proliferate and deepen.

There has been a softening of inflation-adjusted grocery expenditures since January (again, see the chart below). This is probably the result of historically very high food inflation plus reduced cash reserves. But especially given the persistent disincentive of inflation, for food demand to still be at least three percent above pre-pandemic trend has material implications for production and distribution capacity — and therefore flow.

In June I offered the following:

I hypothesize that between May and September we will see food-at-home real consumption gradually decline by another seven to ten percent and then flatten or incrementally increase. I hypothesize that durable goods and services will begin to show slopes similar to 2022 food consumption. I also hypothesize a more rapid rate-of-change than that for food between last November and April. 

With two months of data left to ingest, we have barely seen a one-percent decline in food-at-home consumption. Durable goods spending has been stable. Real services spending has continued to incrementally increase. Given my perception of actual need and inflationary disincentives interacting with economic and geo-political risk, I expected much more consumer restraint to emerge by now. If anything the opposite is true (more and more).

From May 2021 until August 2022 US wage growth was not only consistently higher but the rate of growth was increasing too. Last month’s wages (September) were still growing, but at a slightly slower rate. So — maybe — with more nominal cash flow many American consumers have chosen to avail themselves of “retail therapy” and comfort food to manage accumulating stress. This is not a satisfactory explanation, but it is the best I have right now.

+++

October 29 Update: Based on September’s real Personal Consumption Expenditures (see chart below), since the end of April constant dollar (inflation adjusted) expenditures on food-at-home have declined from $1,036.4 billion to $1,022.4 billion — or 1.4 percent. Real durable goods spending in September was basically flat. Expenditures on services, even in the most discretionary categories, seem very stubborn — much more stubborn than I expected.

Apologia

During the third week in September I was in Europe working with others to prepare for the wartime winter ahead (more and more)… and finally being face-to-face with the Adoration of the Lamb. The last weekend in September, between Den Haag and Ghent, I was involved in work anticipating Hurricane Ian. I flew back to the States on the same day as landfall (for once the flight cabin’s internet was nearly persistent). Post-landfall work continued — and I became about as ill as I have been in forty years. I am still recovering. I have scanned my favorite flows — food, fuels, and high volume freight — just enough to be a bit amazed by the combination of continuity and surprising swerves over the last thirty days. How and how much I will reengage here is not yet clear. But it is past time to explain my absence.