Month: December 2022

Vital signs updated

[Updates Below] There are several helpful tools to assess the overall health of supply chains, including the Global Supply Chain Pressure Index and the CSCMP Logistics Managers Index. Toward the end of November, I suggested five indicators for fitness of emerging global flows focused on the next six months or so. Here’s an updated assessment:

Southern Hemisphere Agricultural Production: Argentina’s corn crop is forecast to be less than last year’s harvest and at the low end of average production levels (more). Anticipated Brazilian soybean yields have bounced back from last year’s disappointing harvest (more). Australia seems to be on track for a record wheat harvest. Wheat futures have been trending lower since September and are well-below their peaks in May.

Global Diesel Demand, Production, and Price: The IEA December analysis of November outcomes reported, “Global refinery runs surged by an estimated 2.2 mb/d last month, to 82.3 mb/d, the highest since January 2020. Increased supply of diesel and gasoline coincided with a seasonal lull in transport fuel demand, boosting product stocks which pulled refinery margins lower. In the US and Europe, diesel cracks made record monthly falls from October’s historical peaks, but remain high.” US diesel stocks were up in most US regions for the week ending December 23. US diesel prices were slightly lower. The bomb cyclone that drove south after December 23 has reduced production and increased prices, how high for how long is not yet clear (more and more). Future contracts for January/February New York Harbor deliveries remain off-peak. Same for Amsterdam-Rotterdam-Antwerp diesel futures. (Related)

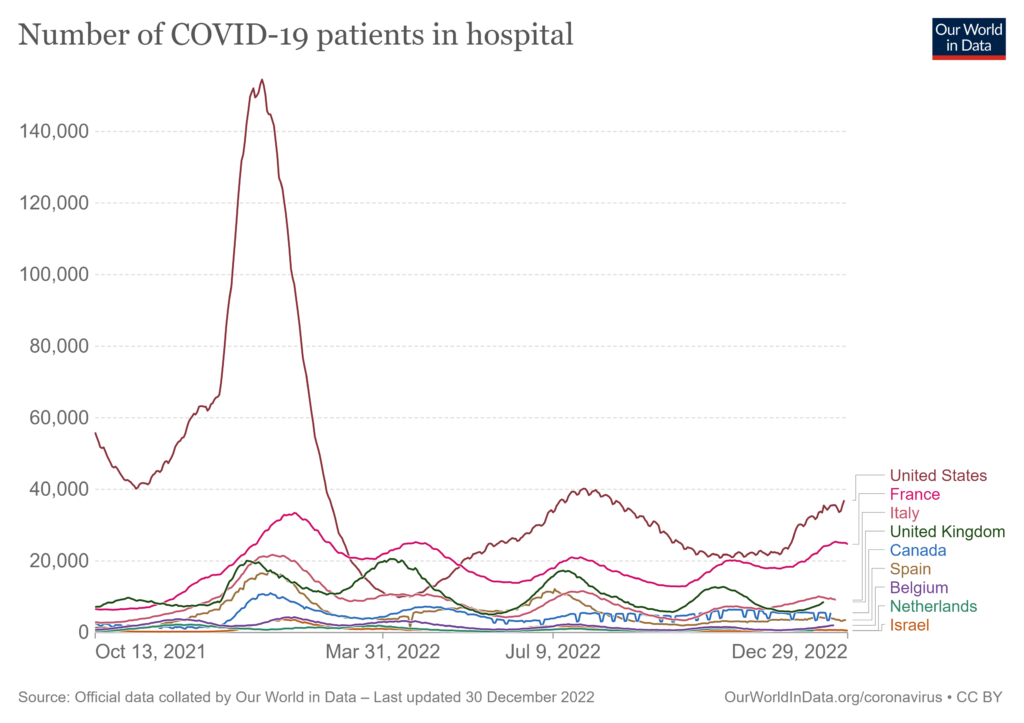
Covid Hospitalizations (and mutations): Transmissions and morbidity are up, especially in the Northern Hemisphere (see chart below). The situation in China is very tough to assess. Since late November public health policy and practice in China has radically changed (more and more and more). There is clearly much more transmission and much more movement of infected people. The virulence associated with this surge — and any related mutation trends — will require a few more weeks to unfold. But, so far, no new variants have been detected (more).

Chinese Export Volumes and Value: According to China’s General Administration for Customs and TradingEconomics, “Exports from China plunged 8.7% yoy in November 2022 to USD 296.1 billion, worse than market consensus of a 3.5% drop and following a 0.3% fall month earlier. This was the second straight month of decline in shipments, and the steepest fall since February 2020, amid weakening global demand due to high inflation and aggressive monetary tightening by major economies and production disruptions lingered.”

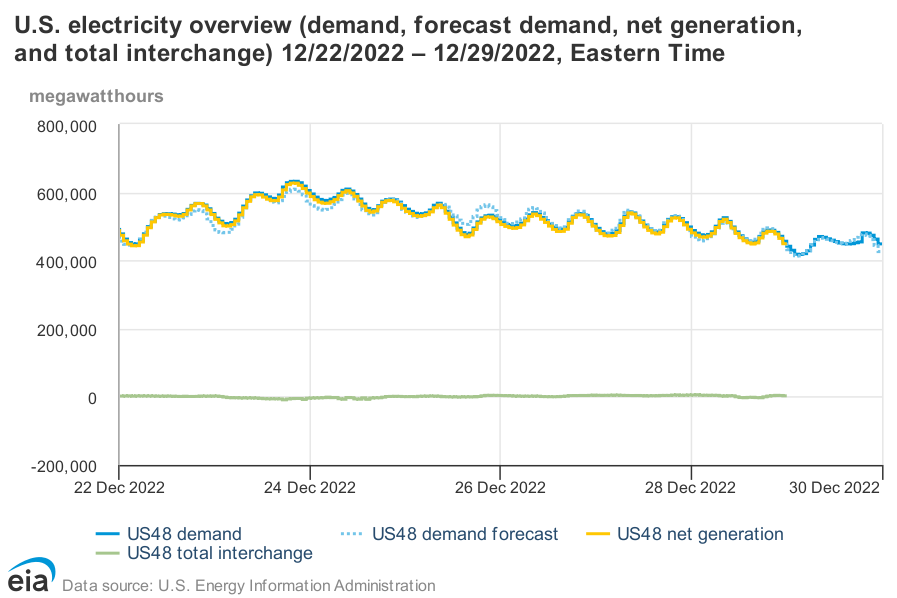
North American Electricity Demand and Supply: The bomb cyclone (more) played havoc with energy demand forecasts, prompting last minute efforts to reduce demand and increase supply across much of North America east of the Rocky Mountains (see chart below, please note divergence between demand forecast, demand, and generation especially on December 23 and 24 ). The Wall Street Journal editorial board commented:

Utilities and grid operators weren’t prepared for the surge in demand for natural gas and electricity to heat homes, which occurred as gas supply shortages and icy temperatures forced many power plants off-line. The PJM Interconnection, which provides electricity to 65 million people across 13 eastern states, usually has surplus power that it exports to neighboring grids experiencing shortages, but this time it was caught short. Gas plants in the region couldn’t get enough fuel, which for public-health reasons is prioritized for heating. Coal and nuclear plants can’t ramp up like gas-fired plants to meet surges in demand, so PJM ordered some businesses to curtail power usage and urged households to do the same through Christmas morning. Rolling blackouts were narrowly averted as some generators switched to burning oil. (More and more and more.)

Compared to one year ago, flows have slowed. Given the war in Europe — with direct effects on food and energy flows — this is unsurprising. Reduced demand for China’s output — by both domestic and international customers — is also a factor. Efforts by North American and European Central Bankers to reduce inflation is another constraint. Given the risks, flows are better than many credible mid-summer projections. War is a perpetual wild card. A wider war — and any new wars — could seriously impede flows. Many worst-case and best-case projections now depend a great deal on what happens in China. An invasion of Taiwan would be catastrophic. If the current dismantling of counter-covid constraints unfolds without spawning a surge in global deaths, then a combination of American and Chinese consumer demand could pull enough to substantially increase both volume and speed of global flows… for better and worse.
+++

January 2 Update: Reuters reports, “China’s factory activity shrank for the third straight month in December and at the sharpest pace in nearly three years as COVID infections swept through production lines across the country after Beijing’s abrupt reversal of anti-virus measures.” More context is available in my December 19 post with several updates.

January 3 Update: Bloomberg reports, “Nearly a dozen major Chinese cities are reporting a recovery in subway use, a sign that an ‘exit wave’ of Covid infections may have peaked in some urban areas… The rise is evidence to support an official statement on Sunday that the Covid outbreak has peaked in the southern manufacturing hub of Guangzhou, where the number of patients at fever clinics have been declining since Dec. 23. Last week, health authorities said infections have peaked in Beijing, Tianjin and Chongqing.” Meanwhile, the Wall Street Journal reports, “In a Dec. 29 article published in Frontiers of Medicine, a medical journal sponsored by China’s Ministry of Education, a team of researchers warned that some provinces in central and western China and in rural areas would be hit by a wave of infections in mid- to late-January. The duration and magnitude of the coming outbreak “could be dramatically enhanced by the extensive travels” during the Lunar New Year, the researchers wrote.” (More and more.) Based on currently available data, the European Centre for Disease Prevention and Control reports, “The variants circulating in China are already circulating in the EU, and as such are not challenging for the immune response of EU/EEA citizens. In addition, EU/EEA citizens have relatively high immunisation and vaccination levels. Given higher population immunity in the EU/EEA, as well as the prior emergence and subsequent replacement of variants currently circulating in China by other Omicron sub-lineages in the EU/EEA, a surge in cases in China is not expected to impact the COVID-19 epidemiological situation in the EU/EEA.”
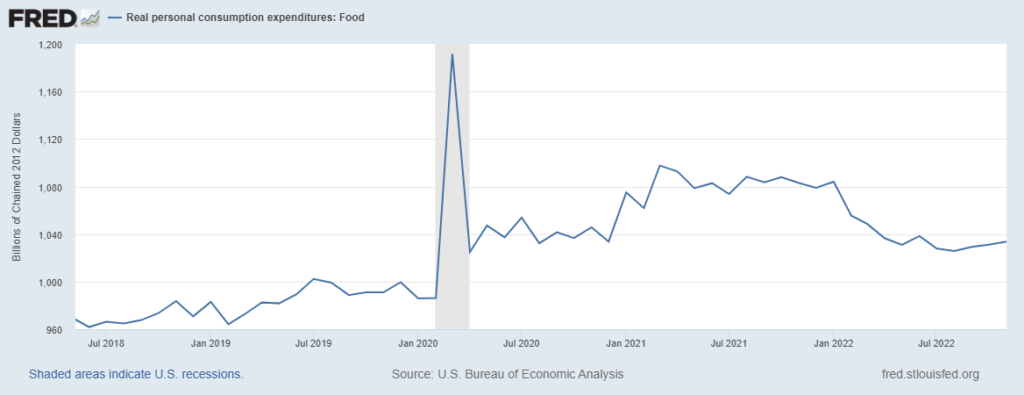
Increased real US consumer demand for food

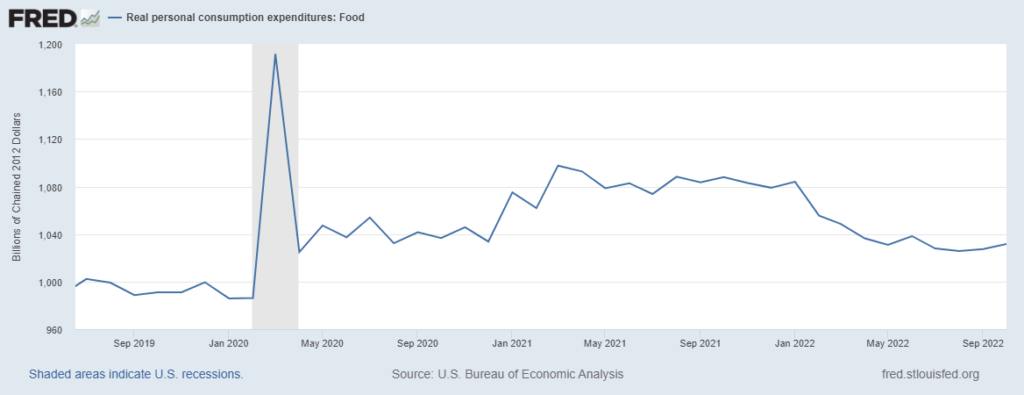
In November 2018 US consumers spent 983.7 billion chained-2012-dollars on food-at-home. In November 2019, 991 billion chained-2012-dollars were spent on food. This November (according to this morning’s report and Federal Reserve analysis) the amount spent was 1033.6 billion chained-2012-dollars. This is an inflation-adjusted figure. We are spending above trend on food-at-home — establishing a new trend? — despite inflation (which eased again in November), despite other increased costs (e.g. energy and shelter), and despite very robust competition for consumer spending. See chart below.

Demand-driven shortages

This morning Dr. Ashish Jha responded to a reporter’s question making the crucial — and too often neglected — distinction between demand-driven or supply-driven disequilibria. In terms of strategic — and responsive — potential actions, this is a crucial differential diagnosis. Below I have teed-up the full four minute interview. The push-pull distinction begins about the 1:55 mark. Dr. Jha’s explanation is accurate in response to the specific products the reporter references. This has also been a recurring feature of so-called supply chain “shortages” for a wide array of products over the last three years.

Wind-blown rolling waves never stay

[Updates Below] In late 2019 and early 2020 something strange was happening in China. Sparse reports and lush rumors swirled. As is often the case with China, we were left listening to the contours of silence much more than anything else.

I watched and listened with increasing alarm, but also with deep uncertainty. It was not until the third week in January that I decided to risk my own credibility and start raising concerns among my colleagues and clients.

Humility is a practical virtue. Fear of ridicule is never helpful. I should have written and said much more, much sooner.

Today’s reports on coronavirus in China are more prominent than three years ago. Yet too much still depends on listening to “silence as a cancer grows.” (Here, here, and here, to sample just a few.) But there are also plenty of signals. Here is what Reuters reports this morning:

China’s chief epidemiologist Wu Zunyou on Saturday said the country was in the throes of the first of three COVID waves expected this winter, which was more in line with what people said they are experiencing on the ground… Beijing city official Xu Hejian told reporters on Monday COVID was spreading fast in the capital, putting pressure on medical resources. Still, more restrictions will be lifted, with previously-closed venues located underground, from bars to internet cafes, allowed to re-open, Xu said.

Over the last three weeks — following widespread protests — China has diverged from a rigorous process of required testing and radical social distancing. The sudden shift has, so far, prompted a fearful self-distancing that quickly gutted the protests and has probably slightly slowed virus transmission. But transmission is well-underway and will not now be contained… during winter in a dense population that is unevenly-vaccinated and in which immunity to a wide range of viral activity is now reduced (as we have seen with seasonal flu and RSV in the United States).

Recent strains of the 2019 novel coronavirus are not as lethal to otherwise healthy hosts as earlier variants. But in coming months the scope and scale of illness and death in China is likely to be extreme. The Institute for Health Metrics and Evaluation has projected a sharp spike early next year. This will seriously disrupt China’s economy. Over the next six months this disruption is likely to be more troublesome than the economic constraints that the Zero-Covid policy caused. This has global supply chain implications with reduced outbound flows from China and less predictability just about everywhere.

The coronavirus continues to evolve. Future mutations are beyond confident prediction, but more evasive and lethal versions are possible. The more infections, the more mutation possibilities. Several million more mutation factories will open in the months ahead.

Risk is the outcome of threats interacting with vulnerabilities to a range of consequences. Likelihoods — best guesses — involve both upside and downside potential. Especially with the virus that causes covid, there are very few certainties.

But there is a strong likelihood of discounting risk. We see discounting (or denial) on a wide range of risks, but it was especially obvious in 2020 as illness and death in Wuhan and elsewhere was being reported. From the December solstice to the March equinox much of the world behaved as if what happens in China stays in China. When this perception was disproven, much of the world responded with a level of surprise that amplified risks too-long denied.

As we approach Wednesday’s 2022 solstice, deja vu all over again?

I hope not. It is, however, in our shared self-interest to soberly, systematically recognize this emerging risk; thinking and talking through appropriate mitigation measures: personal and social, local and global, especially in regard to flows of water, food, fuel, pharmaceuticals, and other critical freight. If we had 2020 to do over, what would we do differently? I don’t suggest the answers are obvious. But meaningful discussions now can displace surprise and amplify readiness (instead of risk).

The title of this post is taken from a Tang dynasty poem:

九曲黄河万里沙
浪淘风簸自天涯。
如今直上银河去…

My translation:

Nine bends of the Yellow River flow with sand from far away
Emerging of sky’s edge wind-blown rolling waves never stay
Searching for the source I travel deep into the Milky Way…

My making of meaning: Knowing source and cause may well be beyond our capacity, but flow and its contents are clear enough. Given what we do know, we should prudently engage flows to minimize harm and maximize benefit.

Too poetic? Insufficiently empirical? Probably. But confronted with deep uncertainty, I have experienced the poetic and empirical to be effective partners.

Best wishes for the New Year fast approaching.

+++

December 20 Updates: A reader has sent me a new World Bank update on China. Thank you. Here is an excerpt from the Executive Summary:

High frequency indicators suggest another growth slowdown in the fourth quarter amid a return of high COVID-19 cases. Despite fiscal and monetary policy support, real GDP growth is expected to slow to 2.7 percent in 2022—1.6 percentage points lower than projected in the June China Economic Update. In 2023 growth is projected to recover to 4.3 percent but remain below the potential rate. China has been moving quickly toward reopening since November 2022, with public health measures being eased rapidly. During the initial stage of reopening COVID infections will rise sharply and might lead to voluntary reduction in social interactions, which will weigh on consumer demand and may lead to continued disruption even after restrictions are lifted. These impacts of the initial exit wave are expected to be concentrated in the first quarter of next year…

Later in the report China’s strategic risks are summarized, including climate change, an unstable real estate market with related macroeconomic challenges, and “uncertain global growth prospects, sharper-than expected tightening in financial conditions, and heightened geopolitical tensions…” The World Bank authors do note, “In China, 69 percent of over 60-year-olds had received a booster dose as of mid-November 2022, but the vaccination rate was just 38 percent for over 80-year-olds…” Risks of the so-called exit wave spawning mutations are not referenced. The report is titled, “Navigating Uncertainty: China’s Economy in 2023“.

The Washington Post editorial board apparently shares the concerns I have outlined above. The headline: China’s new covid nightmare could become a global catastrophe.

December 21 Updates:

Bloomberg reports: Chinese cities and factories tell people with covid to go back to work and China’s covid tsunami could spark a dangerous new variant that infects the world

Reuters reports: Corporate China struggles with supply snags and demand slump as covid cases spread

South China Morning Post reports: China to track covid mutations through national hospital network

December 22 Updates:

Wall Street Journal reports: Undercounted deaths cloud China’s zero-covid exit

Reuters reports: Shanghai hospital warns of ‘tragic battle’ as covid spreads

December 23 Updates:

The Financial Times reports: Covid overwhelms Beijing’s hospitals

Bloomberg reports: Shanghai port strives to keep global trade moving despite covid (successfully so far) and China’s soaring covid cases push economic activity off a cliff.

In the South China Morning Post, Wang Xiangwei comments: Morgues overwhelmed: why China’s new covid crisis is all of its own making

In the Wall Street Journal, Dr. Ezekial Emanuel comments:

Over the past three years, there have been more than 650 million confirmed Covid cases world-wide. Public-health authorities have identified six “variants of concern”—those that have increased transmissibility, increased disease severity, reduced neutralizing antibodies or reduced effectiveness of existing treatments and vaccines… Having 800 million people in China infected will increase the likelihood of dangerous new variants. Making matters worse, the Chinese New Year is Jan. 22, and hundreds of millions of Chinese will travel and gather to celebrate. (Three years ago the city of Wuhan went ahead with a massive New Year’s banquet amid the original outbreak.) The easing of China’s international travel restrictions will disperse any new variants to other countries.

January 12, 2023 Update: “Poetry knows we are as close as a feather to disaster.” Marianne Boruch

Farther horizons

[Updates Below] In three weeks, a new year. In three months, the likelihood of another million-plus deaths from covid (more) and, almost as certainly, a worsening war in Europe.

In three years?

The sharp slope of pandemic demand has eased (even as core demand increases). Compared to one or two years ago, many wealthy people are not quite as wealthy (but there is a continuing tendency for wealth to flow to those already wealthy). Billions in poverty or close-by are now less able to pull what they need. Flows are slowing.

The velocity of demand since 2020 was not sustainable, but there is now increasing risk of peripheral pull (aka low-margin demand) being shed as overall flows are narrowed.

Supply capacity is increasingly volatile. Food sources and flows are disrupted by natural and intentional complications (more and more). Ditto for energy flows (more and more).

There is increasing cause to anticipate more frequent and severe natural disruptions. There is no reason to expect intentional disruptions to dissipate, even if particular conflicts run their course.

Given this risk environment there is — and will be — incentives to diversify sources, nodes, and channels. But this will take time and treasure. In the meantime higher costs will further constrain fulfilling demand. Higher costs for core commodities and transportation will decrease demand for more discretionary consumption, depressing demand across several sectors. Such continuing constraints raise the likelihood of discarding lower-margin pull; increasing the likelihood of political volatility among those with much less pull capacity.

There are various and sundry efforts to arrange autarkic separation of demand and supply. Especially if widely adopted, this would undermine the potential capacity of all flows and expand the size of peripheral populations being shed (more). Aging populations in North America, Europe, and East Asia will pay more to consume less. Youthful populations everywhere will have less to spend and need to pay more for basics.

As you know — and I readily confess — I am a kind of catastrophe-kid (or now, I guess, catastrophe geezer). Yet, over the years I have often warned against assuming the worst. Large-scale complex adaptive systems are predisposed to rebalance over time. We have seen this again and again. But time-scales can vary widely — and for many inside these temporal loops achieving a positive equilibrium takes more time than they (we) have.

There are many projections for a 2023 economic slowdown or recession (here and here and here). The litany above references several potential reasons why. Time-required can often reflect how well capacity concentrations survive impact (physical, fiscal, or policy-driven). Are there potential sources of acceleration?

Given the immediate context, Europe and Britain seem unlikely candidates. Russia‘s economy will continue to suffer from sanctions. Argentina, Australia, Brazil, Canada, and Indonesia could benefit if all commodity prices increase at least as much as fossil fuels. China’s domestic demand is likely to be covid-constrained for considerable time. China, India, Japan, South Korea, and other East Asian economies will reflect some aggregate of global demand. Mexico faces similar dynamics. Turkey is a very special case.

It seems to me that much depends on wither goest American consumers, whether war and covid become more or less deadly, and whether the world’s farmers find the weather extreme or benign.

+++

December 16 Update: Live Science reports,

Since the COVID variant omicron emerged in late 2021, it has rapidly evolved into multiple subvariants (opens in new tab). One subvariant, BF.7, has recently been identified as the main variant spreading in Beijing (opens in new tab), and is contributing to a wider surge of COVID infections in China… BF.7 is believed to have an R0, or basic reproduction number, of 10 to 18.6 (opens in new tab). This means an infected person will transmit the virus to an average of 10 to 18.6 other people. Research has shown omicron has an average R0 of 5.08 (opens in new tab)… The symptoms (opens in new tab) of an infection with BF.7 are similar to those associated with other omicron subvariants, primarily upper respiratory symptoms. Patients may have a fever, cough, sore throat, runny nose and fatigue, among other symptoms. A minority of people can also experience gastrointestinal symptoms like vomiting and diarrhoea. BF.7 may well cause more serious illness in people with weaker immune systems.

This morning the Financial Times is reporting, “Evidence of a wave of Covid-19 deaths is beginning to emerge in Beijing despite official tallies showing no fatalities since an uncontrolled outbreak began sweeping through China’s capital this week.” (More)

The immediate risk presented by the BF.7 subvariant is potentially amplified by the threat of new mutations as several million new cases suddenly flare in the coming weeks (here and here).

Diversifying flows

In a good overview, the Wall Street Journal reports, “The hierarchy of U.S. ports is getting shaken up. Companies across many industries are rethinking how and where they ship goods after years of relying heavily on the western U.S. as an entry point, betting that ports in the East and the South can save them time and money while reducing risk.” Below is a chart showing the shift in container volumes over the first nine months of this year. There are certainly several factors at play here, some ephemeral, some that will probably be more persistent. What is fundamentally true: diversifying nodes and channels increases resilience.

US diesel push and pull in context

Here is a long excerpt from yesterday’s EIA Petroleum Status Report for last week.

U.S. crude oil refinery inputs averaged 16.6 million barrels per day during the week ending December 2, 2022 which was 53,000 barrels per day less than the previous week’s average. Refineries operated at 95.5% of their operable capacity last week. Gasoline production decreased last week, averaging 9.1 million barrels per day. Distillate fuel production increased last week, still averaging 5.3 million barrels per day. U.S. crude oil imports averaged 6.0 million barrels per day last week, decreased by 24,000 barrels per day from the previous week. Over the past four weeks, crude oil imports averaged about 6.2 million barrels per day, 4.1% less than the same four-week period last year. Total motor gasoline imports (including both finished gasoline and gasoline blending components) last week averaged 519,000 barrels per day, and distillate fuel imports averaged 372,000 barrels per day.

U.S. commercial crude oil inventories (excluding those in the Strategic Petroleum Reserve) decreased by 5.2 million barrels from the previous week. At 413.9 million barrels, U.S. crude oil inventories are about 9% below the five year average for this time of year. Total motor gasoline inventories increased by 5.3 million barrels from last week and are about 3% below the five year average for this time of year. Finished gasoline inventories decreased, while blending components inventories increased last week. Distillate fuel inventories increased by 6.2 million barrels last week and are about 9% below the five year average for this time of year. Propane/propylene inventories decreased by 1.0 million barrels from last week and are 14% above the five year average for this time of year. Total commercial petroleum inventories increased by 5.9 million barrels last week. Total products supplied over the last four-week period averaged 20.1 million barrels a day, down by 3.8% from the same period last year. Over the past four weeks, motor gasoline product supplied averaged 8.4 million barrels a day, down by 7.1% from the same period last year. Distillate fuel product supplied averaged 3.7 million barrels a day over the past four weeks, down by 9.8% from the same period last year. Jet fuel product supplied was up 7.5% compared with the same four-week period last year.

Given distance from sources and constrained channels between demand and supply, I give particular attention to diesel stocks for New England and the mid-Atlantic (PADD 1A and 1B). For all of PADD 1 (Atlantic Coast) inventories are back inside the five year range. The mid-Atlantic is a bit better off than New England (see chart below). Demand and prices have fallen (more). As long as channels are not seriously disrupted (e.g., Colonial Pipeline) and production persists (for how long at over 90 percent?), this will do. Our blood pressure is uncomfortably high, but we can keep trucking…

Quick fitness update

[Update Below] Twelve days ago I set out five vital signs to regularly monitor. Here’s a very quick update:

Southern Hemisphere Crop Production: Drought is casting doubt on Argentina’s corn crop as well as Brazil’s soybeans. Australian wheat is mixed, but record yields in the west seem to be making up for flooded fields in the east. (More) Indonesia’s palm oil inventories continue to be in good shape despite higher demand and continued price advantages compared to sunflower and soy oils.

Global Diesel Demand, Production, and Price: According to the IEA November update:

Diesel prices and cracks (differential to crude oil price) surged to record levels in October, and are now 70% and 425% higher, respectively, than year-ago levels while benchmark Brent prices increased just 11% during the same period. Distillate inventories are at multi-decade lows. French refinery strikes last month and upcoming embargoes propelled diesel prices in Rotterdam, Europe’s main trading hub, to more than $80/bbl above North Sea Dated at one point, before easing somewhat. Diesel premiums in the United States have also soared ahead of the winter heating season in the Northeast.

But January futures contracts for New York Harbor have seen significant price declines since Halloween. More details on US diesel inventories will be released in a few hours. I plan to give these results more attention tomorrow.

Covid Hospitalizations (and Mutations): In much of the world, the number of hospitalized patients with covid is less than half that of this time last year (recent increases notwithstanding). There seems to be a meaningful shift in China’s covid zero policy. If this policy shift persists there are potentially significant implications, both epidemiologically and economically (including for diesel demand).

China’s Export Volume and Value: Reuters reports: “China’s exports and imports likely contracted further in November due to weakening global demand, production disruptions and waning demand at home amid widespread pandemic controls, a Reuters poll showed on Monday. Data for November are expected to show a 3.5% fall in outbound shipments from a year earlier, after October’s figures were down an annual 0.3%, according to the median forecast of 28 economists in the poll. That would mark the worst performance since May 2020.”

North American Electricity Demand and Supply: Late autumn demand has been seasonal and within current generating capacity. The price per kilowatt hour has increased. (More)

While the original conceit for these vital signs relates to human health, the outcomes above seem better suited for a weather analogy. Taken together I perceive seasonal to warmer temperatures with clouds, chance of spotty precipitation, and an uncertain mid-term forecast.

+++

December 9 Update: Bloomberg reporters offer their own perspective on what is ahead as China backs-away from ultra-covid-zero:

The (infection) curves have been consistent all over the world, rising exponentially for about three to four weeks and then falling at a similar rate. The experts I’ve talked to don’t expect anything different in China. It’s pretty clear that a month from now will be near the peak… One data set, from the London-based research firm Airfinity, has a range of 1.3 million to 2.1 million (fatalities). Officials at the Institute for Health Metrics say that’s much too high. They are coming out with new numbers in the next few days.  I don’t see a scenario where China avoids the devastation we’ve seen in other places. Given its size, it’s likely to be scary. 

CNBC reports, “U.S. manufacturing orders in China are down 40 percent, according to the latest CNBC Supply Chain Heat Map data. As a result of the decrease in orders, Worldwide Logistics tells CNBC it is expecting Chinese factories to shut down two weeks earlier than usual for the Chinese Lunar New Year — Chinese New Year’s Eve falls on Jan. 21 next year. The seven days after the holiday are considered a national holiday.”

S&P Global reports, “Diesel and gasoil stocks in the Northwest European hub of Amsterdam-Rotterdam-Antwerp sat at 1.716 million mt, 24.9% below the five-year average late November and their lowest since 2008 for the time of year, data from Insights Global showed. Inventories elsewhere have faced a similar fate as demand outstrips supply, with diesel stocks across the Atlantic around 37% below the five-year average at the end of November and middle distillate stocks in Singapore around levels last seen in 2004 for this time of year, US Energy Information Administration and Enterprise Singapore data showed… US Gulf Coast exports of ULSD to Europe surged 117% on the month to 484,200 mt in September, before crashing to 284,000 mt in October and rising to about 418,800 mt in November…”

According to the USDA and Bloomberg, “Wheat posted a fifth straight week of losses as prospects brighten for getting global grain shipments out of the war-stressed Black Sea. The US Department of Agriculture raised its outlook for world wheat trade in part on higher exports from Ukraine and Russia, the agency said Friday in its monthly World Agricultural Supply and Demand Estimates.”

Bloomberg on fossil fuel flows

Yesterday Kevin Book provided a wonderfully concise explanation of recent conditions. Even with breaking news regarding Russia’s oil flows and potential unleashing of (some) domestic demand in China, the explanation has held for more than twenty-four hours, which should not be taken for granted. Selecting the image below will take you to the Bloomberg website. Bloomberg defaults to silent, so turn on website’s sound. Please advance to about 1:08:20.

October personal consumption of food

[Update Below] According to the US Department of Commerce, Bureau of Economic Analysis, “Personal income increased $155.3 billion, or 0.7 percent at a monthly rate, while consumer spending increased $147.9 billion, or 0.8 percent, in October. The increase in personal income primarily reflected increases in compensation and personal current transfer receipts. The personal saving rate (that is, personal saving as a percentage of disposable personal income) was 2.3 percent in October, compared with 2.4 percent in September.”

Given my focus on supply chains — the real movement of real stuff — for several months I have been giving close attention to US inflation-adjusted expenditures on Food-At-Home (FAH) (see chart below).

The pandemic prompted considerably higher demand for FAH, mostly purchased from various categories of grocery stores. This sustained increase made enormous sense given the significantly reduced expenditures on Food-Away-From-Home. But I have been surprised how this increase persisted even after US consumers began to expend as much (or more) than ever at restaurants, fast food outlets, and so on in Spring 2021. As shown below, Food-At-Home expenditures remained about 8 percent higher than pre-pandemic even when Americans resumed eating out. This significant and surprising (to me) sustained shift above the previous demand trend is a big part of persisting supply chain challenges in the US grocery industry.

Six months ago, based on long-term real personal expenditures on Food-At-Home, I decided that a combination of inflation, more competition for spending, reduced personal savings, and, perhaps, even some satiation would result in FAH expenditures falling to something close to $1,010 billion to $1020 billion per month of chained 2012 dollars. In June I announced a “bet” on how expenditures would adapt and adjust over the summer.

So, despite nine months of unfulfilled anticipation (or because of it), I hypothesize that between May and September we will see food-at-home real consumption gradually decline by another seven to ten percent and then flatten or incrementally increase. I hypothesize that durable goods and services will begin to show slopes similar to 2022 food consumption. I also hypothesize a more rapid rate-of-change than that for food between last November and April. These are deniable hypotheses. I am not sure. It does seem plausible. If this happens, demand and supply will be closer to equilibrium. [Excerpt from June 26 blog]

I was way off. The decline in real food expenditures from May to the end of September was a scant 1.4 percent… and real expenditures on food for October were almost a billion (real) dollars more than May. After five flat months, real durable goods expenditures increased in October. Real services expenditures have continued along the softly increasing curve assumed in summer 2021.

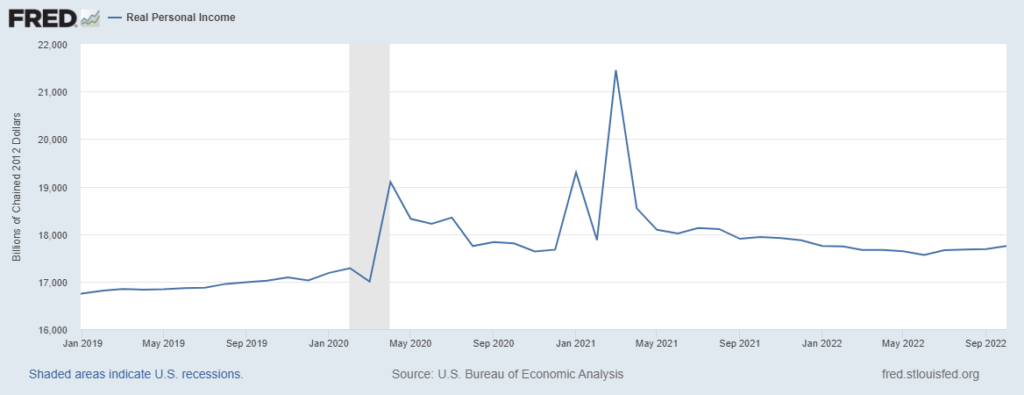
Why was I wrong? As usual, there are so many possibilities. Let us count the ways. But today I am focusing on one fundamental factor that I expect has had high-proportional impact: real personal income (see second chart below) is even more above its pre-pandemic trend than food expenditures. Yet another example of how comparative change and effectual demand matter.

+++

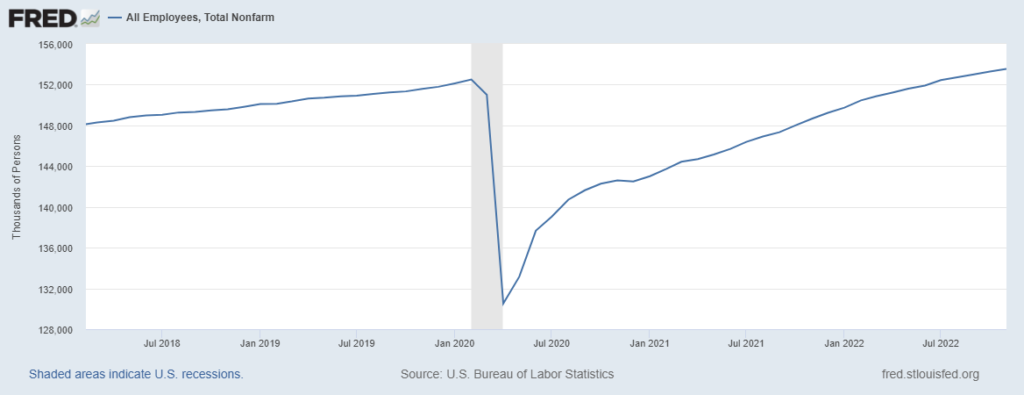
December 2 Update: This morning’s payrolls report from the Bureau of Labor Statistics also suggests why food purchases have continued to be so robust. Despite some high-profile lay-offs, the overall number of new jobs created in November far exceeded most expectations. (See chart below.) Employment in food manufacturing increased 3.4 percent. Employment in retail food increased 4.5 percent.