[Update Below] According to the US Department of Commerce, Bureau of Economic Analysis, “Personal income increased $155.3 billion, or 0.7 percent at a monthly rate, while consumer spending increased $147.9 billion, or 0.8 percent, in October. The increase in personal income primarily reflected increases in compensation and personal current transfer receipts. The personal saving rate (that is, personal saving as a percentage of disposable personal income) was 2.3 percent in October, compared with 2.4 percent in September.”
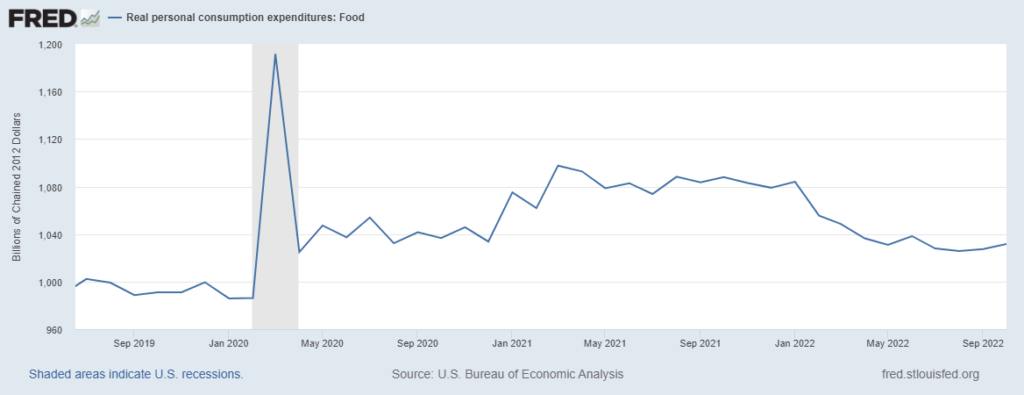
Given my focus on supply chains — the real movement of real stuff — for several months I have been giving close attention to US inflation-adjusted expenditures on Food-At-Home (FAH) (see chart below).
The pandemic prompted considerably higher demand for FAH, mostly purchased from various categories of grocery stores. This sustained increase made enormous sense given the significantly reduced expenditures on Food-Away-From-Home. But I have been surprised how this increase persisted even after US consumers began to expend as much (or more) than ever at restaurants, fast food outlets, and so on in Spring 2021. As shown below, Food-At-Home expenditures remained about 8 percent higher than pre-pandemic even when Americans resumed eating out. This significant and surprising (to me) sustained shift above the previous demand trend is a big part of persisting supply chain challenges in the US grocery industry.
Six months ago, based on long-term real personal expenditures on Food-At-Home, I decided that a combination of inflation, more competition for spending, reduced personal savings, and, perhaps, even some satiation would result in FAH expenditures falling to something close to $1,010 billion to $1020 billion per month of chained 2012 dollars. In June I announced a “bet” on how expenditures would adapt and adjust over the summer.
So, despite nine months of unfulfilled anticipation (or because of it), I hypothesize that between May and September we will see food-at-home real consumption gradually decline by another seven to ten percent and then flatten or incrementally increase. I hypothesize that durable goods and services will begin to show slopes similar to 2022 food consumption. I also hypothesize a more rapid rate-of-change than that for food between last November and April. These are deniable hypotheses. I am not sure. It does seem plausible. If this happens, demand and supply will be closer to equilibrium. [Excerpt from June 26 blog]
I was way off. The decline in real food expenditures from May to the end of September was a scant 1.4 percent… and real expenditures on food for October were almost a billion (real) dollars more than May. After five flat months, real durable goods expenditures increased in October. Real services expenditures have continued along the softly increasing curve assumed in summer 2021.
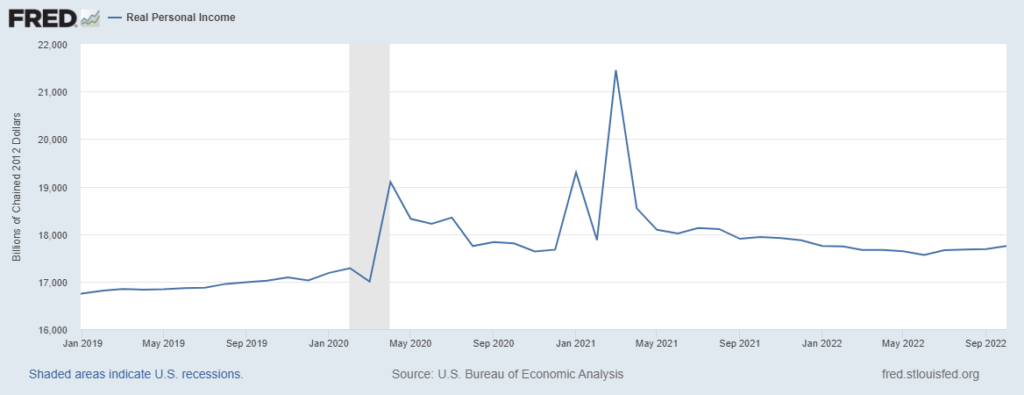
Why was I wrong? As usual, there are so many possibilities. Let us count the ways. But today I am focusing on one fundamental factor that I expect has had high-proportional impact: real personal income (see second chart below) is even more above its pre-pandemic trend than food expenditures. Yet another example of how comparative change and effectual demand matter.
+++
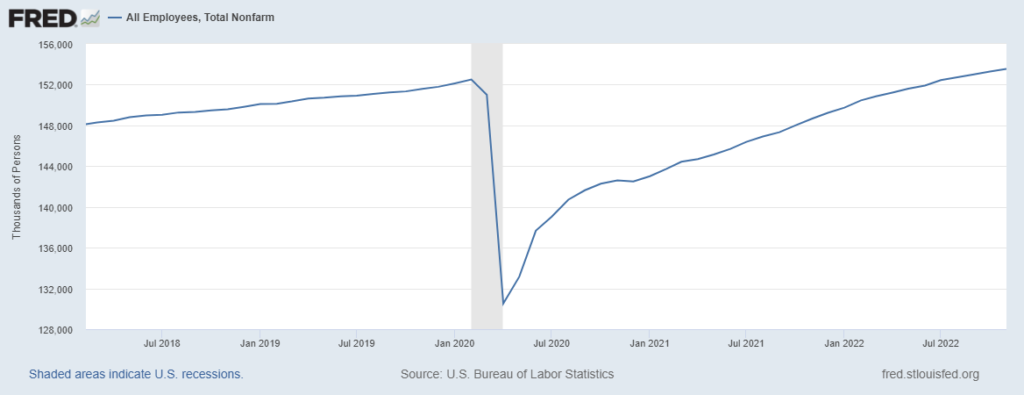
December 2 Update: This morning’s payrolls report from the Bureau of Labor Statistics also suggests why food purchases have continued to be so robust. Despite some high-profile lay-offs, the overall number of new jobs created in November far exceeded most expectations. (See chart below.) Employment in food manufacturing increased 3.4 percent. Employment in retail food increased 4.5 percent.