At the close of his recent newsletter discussing the crucial role played by rate of change, Paul Krugman insists, “you do need a theory” regarding “what kind of inflation process you think is currently operating.”
I don’t yet have a theory regarding what kind of supply chain resilience process is currently operating. But I do have a hypothesis that I am now ready to test on my way to a working theory.
Supply disruptions are undeniably complicit in price increases. But at least until February 24, when Russia invaded Ukraine, I perceive that in the United States these disruptions have mostly been demand-driven (if the excavation of causal factors goes deep enough); even more than the substantial demand-driven contribution found by Adam Hale Shapiro.
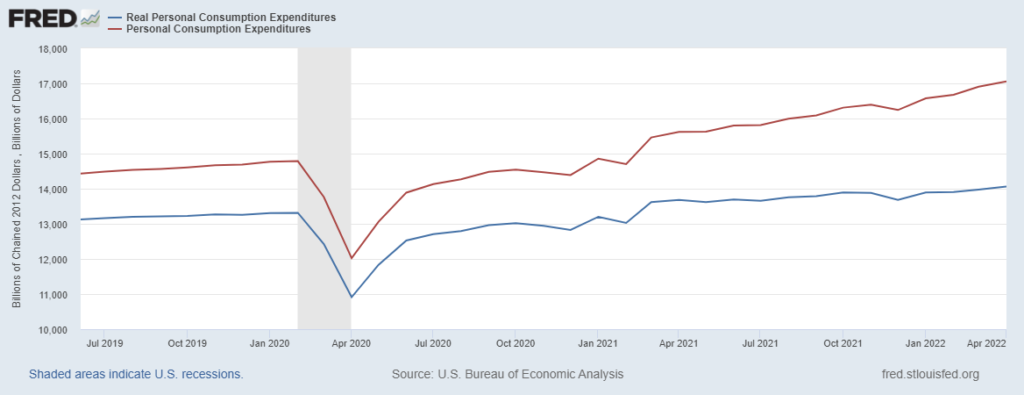
In 2021 personal consumption expenditures (not adjusted for inflation) soared well above preexisting capacity to fulfill demand. This is shown below in the red top line. This seriously stressed supply chains and caused higher price levels. In March 2021 persistently high demand beyond production and/or transportation capacity was accelerated by pandemic-relief payments. This resulted in a yet higher rate of change for increased prices, as demonstrated in the comparatively flatter slope for real PCE shown here and below in the bottom blue line. Since February 24 we have seen what Krugman calls “a high rate of change in the rate of change,” especially in regard to retail fuel prices.
I have already spent most of nine months expecting to see more conservative consumption. This has begun to feel like waiting for Godot. But since at least this January — arguably, even November 2021 — we have seen serious softening in food-at-home purchases, once adjusted for inflation as shown here and in the chart below. This is not (yet) possible to confidently claim with any similar data for durable goods or services. But the data for all the charts above and below close on April 30. I will not be surprised to see demand behaving more conservatively in May (we should see the May PCE print on Thursday) and even more conservatively for June. Part of this is collateral damage caused by the high-rate-of-change-in-the-rate-of-change for fuel prices.
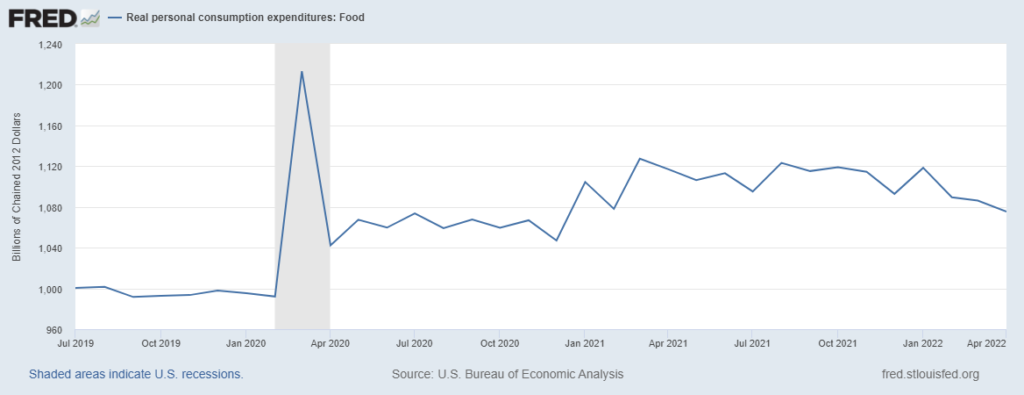
So, despite nine months of unfulfilled anticipation (or because of it), I hypothesize that between May and September we will see food-at-home real consumption gradually decline by another seven to ten percent and then flatten or incrementally increase. I hypothesize that durable goods and services will begin to show slopes similar to 2022 food consumption. I also hypothesize a more rapid rate-of-change than that for food between last November and April. These are deniable hypotheses. I am not sure. It does seem plausible. If this happens, demand and supply will be closer to equilibrium. Accordingly supply will be much less a factor in price increases than over the last 12 to 14 months.
Will this rate of change be sufficient to exorcise behaviors related to wider fears of stubborn inflation? That’s not a question this supply chain resilience guy is competent to answer. What’s above is already on the bleeding edge of my competence.
+++
If you are a new reader, it may be helpful to scan the two immediately prior blog posts. You can find them under Conversation in the red top task bar or at these links: Supply Chains and Inflation and The Output Gap.