From a June 15 commentary by Greg Ip in the Wall Street Journal:
… the evidence suggests high demand and restricted supply are interacting in ways that economists struggle to calibrate. That is a problem, because it suggests inflation may remain unpredictable as the Fed rapidly withdraws stimulus but supply disruptions from Covid and war persist.
Two paragraphs tee-up a crucial difference between an economist’s angle on what has been happening and a supply chain professional’s view of the same behavior.
Economists have treated the supply side—autos, housing, restaurants, energy, healthcare, finance—as homogenous and elastic: When demand for nursing home beds or cars rise, so does their supply, and prices rise only a little, if at all.
But in the last two years, supply hasn’t been homogenous. Some industries like e-commerce have hired easily, while others like nursing homes have lost workers in droves. Food sold to restaurants didn’t substitute easily for food sold in supermarkets. Supply hasn’t been elastic…
The supply side is never homogenous, says this supply chain guy. Supply is never elastic.
It may seem that way to consumers, even B2B consumers (and, apparently economists). Supply chain professionals work hard to make it possible for consumers to get whatever is wanted, when and where it is wanted. (For the last decade this was very often the case in much of the United States.) But inside the network: sources, products, flow, categories, topographies, pull, targets, margins, modalities, and more are profoundly heterogenous. Supply is calibrated to demand. Production capacity and transportation capacity are calibrated to persistent consumption patterns. Push is calibrated to pull.
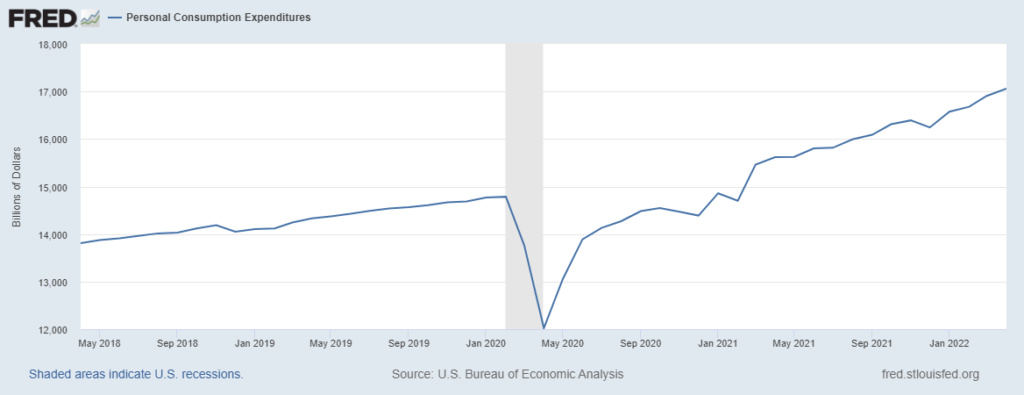
Over the last two years — even the last two months — demand has swerved, surged, and swayed dramatically. The aggregate Personal Consumption Expenditure (PCE) graph — and its slope — is worth a long stare and longer thought (see chart below). Contemplation of volatile PCE sub-components can cultivate humility.
In April 2018 total PCE was $13,809 billion. In April 2019 total PCE was $14,309 billion, reflecting healthy, historically happy year-over-year economic growth with low inflation. April 2020 PCE crashed ($12,021 billion), but by April 2021, total PCE was $15,601 billion. This April total PCE was $17,059 billion!
There are laws of physics, wads of regulations, financial management principles, and quite reasonable uncertainties that conspire to frustrate quick recalibration of push capacity to this extraordinary acceleration in pull.
Yet, since 2020 in the United States, unfulfilled demand has usually not been because of reduced supply. It has been because much more supply has still not been enough to satisfy demand. There has been a reduced supply of new automobiles. But grocery manufacturing, for example, is producing more than ever before. Durable goods manufacturing (other than cars) has grown by over ten percent since Spring 2019. US manufacturing of clothing and footwear is up 18 percent over 2019. US imports from China increased across all of 2021 and remain above pre-pandemic seasonal levels. Supply can be said to be “restricted” by various factors. It is not easy or automatic to grow this much so quickly, but growth in capacity and flow has been robust.
From March 2020 until March 2021, Personal Consumption Expenditures were restrained. Many Americans — especially high-earners — did not spend nearly as much as usual (saving more). Since April 2021 spending has, however, made up for lost time. For US personal consumption expenditures to increase over 8 percent inside twelve months is just about unprecedented.
It is not surprising that a much faster rate of increase for the Consumer Price Index began about the same time as this sustained demand surge. The CPI has also experienced a proportional increase that closely mirrors growth in personal consumption expenditures.
From when this buying surge began until at least January 2022 — even until now, depending on where and how you look — many supply chains have been challenged to keep up and grow with the increased demand. But both global and domestic flows have mostly kept up (here and here). Given the swift, significant surge in demand: any supposed elasticity was not nearly enough. Flows needed to be supplemented with substantive capacity expansion. This has happened in terms of new investments in technology, space, and labor. For example, in April 2021 there were 1.64 million US warehouse and storage employees. In April 2022 there were 1.78 million employees serving this sector.
Now, since January there is (finally) evidence of some reduced demand across several categories (for example, food). I suspect this slowdown will become more pronounced — especially under pressure from increased fuel costs. Given increased capacity (US and worldwide) built out over the last two years and some softening demand, we will soon be back to where elastic and homogeneous supply will feel real (even when it is not). In any case, barring some extreme event (not implausible), disequilibrium between demand and supply in the United States will be much less than 2021 — and contribute less to inflationary tendencies.
Unfortunately, since February 24 the disequilibrium between demand and supply outside the United States — especially in regard to fuel and food has widened, deepened, and become very complicated. One source of inflation has been mostly absolved, another potentially worse has emerged.
United States Personal Consumption Expenditures: April 2018 to April 2022