Month: July 2021

Increase in the inventory to sales ratio

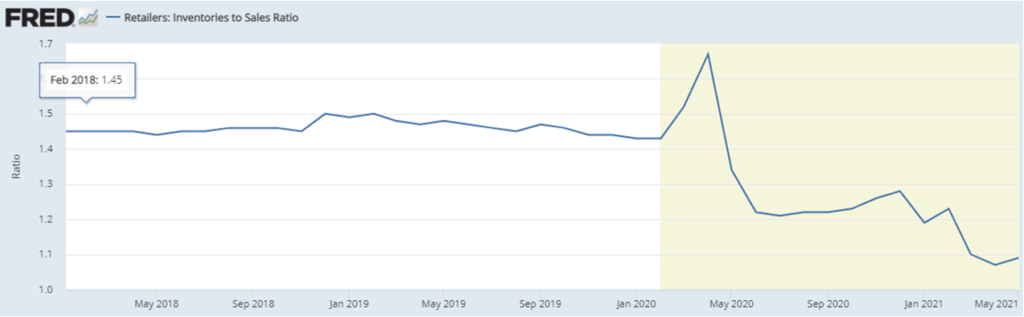
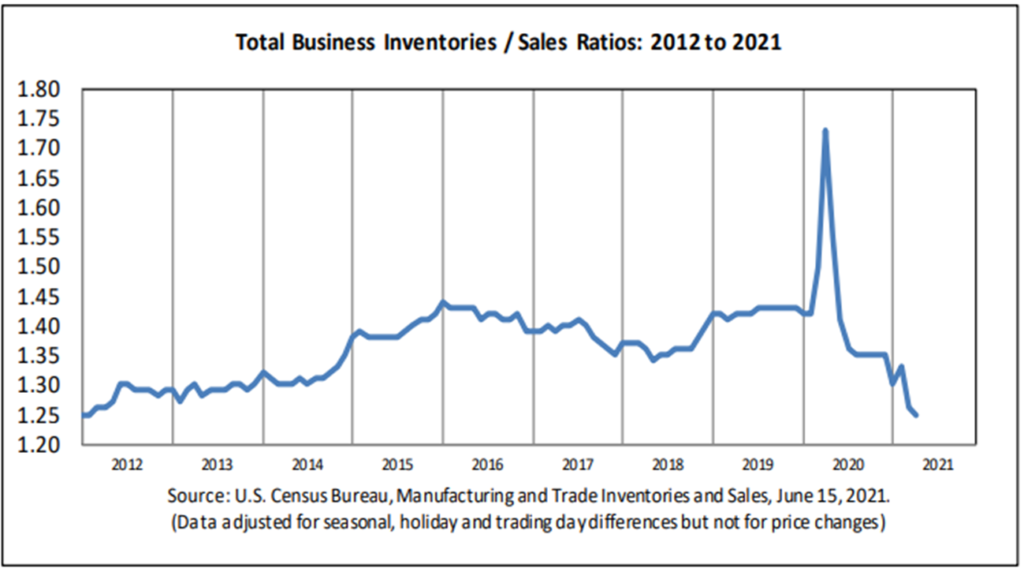
According to the US Census Bureau, for the first time since February inventories showed a slight improvement compared to sales. The ratio increased to 1.09 in May from 1.07 in April. Moderating May demand helped. But much tighter-than-normal inventories reflect several impediments to upstream capacity achieving pre-pandemic velocity (especially spatial/temporal accuracy). Dwell times and other freight delays have continued to increase. So, is this an ephemeral blip or the start of separating from an all-time bottom?

Chart developed by the Federal Reserve Bank of Saint Louis

Preexisting Pull Patterns

In most mature networks, especially those with higher volumes and greater velocity, population demand tends to persist. Sharp, sudden deviations are unusual and almost always result from externalities. Even in these atypical circumstances, it is often not so much that demand itself has changed as the ability to express continued demand has somehow been displaced.

There are exceptions, but when in doubt, placing my bets on the persistence of well-established pull usually pays off.

Consistent with this Supply Chain Resilience principle, last summer I joined many others to suggest that preexisting patterns of demand for seasonal flu vaccinations would help target where extra effort would be needed to encourage covid vaccinations. Not much was done last summer — many who might have done more were plenty busy with the sick and dying. I pushed again last November. Once again, there were — I agree — competing priorities. Others more credible than me continued pushing. But serious grass-roots engagement with vaccine reluctance has been rare until recently.

Still, the data are fairly clear: places with persistently low demand for seasonal flu vaccinations are also places with lower covid vaccination rates. In 2019-2020, 51.8 percent of US residents were vaccinated for seasonal flu (a bit better than in most flu seasons). As of July 18, 2021, the United States had fully vaccinated 48.6 percent of its population against covid. The chart below shows those states with the lowest seasonal flu vaccination rates for 2019-2020. The third column reports the population percentage in each of these states fully vaccinated for covid.

There are outliers. Arkansas vaccinated 54.9 percent of it’s population against seasonal flu, but so far only 35.39 percent are vaccinated against covid. Florida’s three point improvement in covid coverage versus the seasonal flu is better than many states (but not as good as Vermont moving from 57 percent for flu to 66.9 percent for covid). I wish I had time to run a Pearson’s R on the correlation between flu and covid vaccinations rates. (I’m sure someone has this, please let me know.)

It would also be interesting to know more about what happened in Arkansas and Vermont that might explain how prior patterns were undone. But the larger pattern is still clear enough.

Current resistance to vaccinations should not be surprising. Given long-established patterns with seasonal flu vaccinations, we should not assume recent causes. We should also avoid being distracted by ad-hoc (even post-hoc) justifications that will obscure deeper sources of resistance (potentially obscure even to the resistant, reluctant, hesitant, and delayed). Especially after losing so much time and opportunity, there is even greater urgency to understand and engage real impediments. It is also worth being realistic regarding the time-and-effort typically involved with demand creation.

The coronavirus called “novel” in late 2019 was not optimized for human infection. The Delta (B.1.617.2) variant of that original virus is much more effective at claiming human hosts. Fortunately, so far, vaccines approved in the US have demonstrated considerable ability to suppress the onset of disease, even by Delta. Unfortunately, the virus will continue to evolve. Over half of the US population and nearly three-quarters of the world population are, right now, essentially high capacity — unvaccinated — mutation factories.

The more who are effectively vaccinated sooner, the less likely a vaccine-vanquishing mutation.

+++

July 27 UPDATE: Many thanks to a reader who sent along this link to a related BBC report.

Consolidation’s impact on price discovery

The Fed and some others perceive that over-heated physical friction in supply chains is being gradually worked out. Demand has been seriously disrupted and diverted. As — if? — demand settles — sources, channels, and modes of supply will catch up.

From this angle, recent price hikes help demand determine what is really needed/wanted, when and where. As demand becomes less volatile and supply more elastic, surging prices will soften. Ergo, this argument goes, the current sharp swing toward inflation is transitory.

This will often be true. Push typically knows its limitations. Both time and space are uncompromising task-masters. Fixed costs are almost as clear, if treacherously less rigid. With high-quality customers, push does not want to seem mercenary. In any case, pre-existing contracts often set upper limits. The highest prices now being paid for scarce unclaimed capacity are imposed on smaller players or newbies. This is how suppliers and carriers assess the potential value of otherwise obscure pull-signals. High volume, high velocity networks have a tendency to shed suboptimal demand. But if more space opens up or velocity can be increased, available push will accommodate additional pull, re-optimizing to changing conditions.

The big question: in the next several months will this accommodation reflect prices increasing at a slower rate or more stable pricing or reduced pricing? Pandemic price increases will be more stubborn when and where push is capacity constrained, increasing capacity is expensive and time-consuming, and barriers to entry by new competitors are high. This is the case with ocean and rail shipping (more and more). The US trucking market is much more price pliable. Consolidation of capacity is a crucial differentiator between these three freight modalities.

Three ocean freight alliances carry over 80 percent of maritime container shipments. Four US railways account for over 80 percent of industry revenue. In contrast the top ten long-distance trucking firms carry less than ten percent of long-distance US freight (more and more). At the close of 2020 there were over 150,000 trucking firms of all types operating in the United States.

Big players can and need to be strategic. Smaller players often are (and need to be) opportunistic. A market dominated by strategists seeks predictability. Strategists are reluctant to forsake an advantage once secured. A market where no player or set of players dominate is less predictable, much more inclined to facilitate steady or falling prices.

For the remainder of this year, we will see both behaviors playing out — responding to both economic fundamentals and regulatory threats. Once the current catch-up and Christmas are completed we will have a much clearer sense of core capacity, constraints, and competitive agilities. The most resilient demand and supply networks are diverse. By March 2022 (or before) we should have the results of real-world stress tests highlighting where our networks enjoy diversity dividends and suffer diversity deficits.

Volatility: from Latin volātilis (flying, swift, temporary): volō (I fly)

Timber prices fall as US consumers swap DIY for going out | Financial Times

Supply of lumber has increased. Even more important, demand has decreased. Increasing prices have, as usual, diminished demand. Alternative spending opportunities displaced lumber.

On June 16 Jerome Powell, Chairman of the Federal Reserve Board of Governors, said, “Inflation has come in above expectations over the last few months. But if you look behind the headline numbers, you’ll see that the incoming data are, are consistent with the view that prices—that prices that are driving that higher inflation are from categories that are being directly affected by the recovery from the pandemic and the reopening of the economy. So, for example, the experience with, with lumber prices is, is illustrative of this. The thought is that prices like that that have moved up really quickly because of the shortages and bottlenecks and the like, they should stop going up, and at some point, they, they, in some cases, should actually go down.”

In the month since, this lumber market pattern has persisted and similar behavior has been seen in other product categories. Will demand spikes continue to be concentrated in specific categories? Will category-specific price increases successfully redistribute demand and restore supply equilibrium? Or will widening lags between demand and supply morph into generalized and stubborn inflationary pressures?

According to the US Department of Labor, “In June, the Consumer Price Index for All Urban Consumers rose 0.9 percent on a seasonally adjusted basis; rising 5.4 percent over the last 12 months, not seasonally adjusted. The index for all items less food and energy increased 0.9 percent in June (SA); up 4.5 percent over the year.” (More)

Food and energy prices are typically footnoted in the CPI due to their volatility. But recently food and energy have not been alone in attracting manic demand — and resulting supply gyrations. More from the CPI:

The index for used cars and trucks rose sharply for the third consecutive month, increasing 10.5 percent in June. This was the largest monthly increase ever reported for the used cars and trucks index, which was first published in January 1953… The lodging away from home index increased 7.0 percent in June. The index for new vehicles rose 2.0 percent in June, that index’s largest 1-month increase since May 1981. The motor vehicle insurance index increased 1.2 percent over the month. The index for airline fares rose 2.7 percent in June after increasing 7.0 percent the previous month.

According to the Bureau of Economic Analysis, Real Disposable Personal Income was just over $15 trillion in January 2020. By May 2021 DPI had increased by about $1 trillion. Household debt is higher than ever, but high-interest credit card debt has been slashed. The US Personal Savings Rate remains remarkably elevated, as shown below.

There is pent-up demand, especially for products and services constrained by pandemic slow-downs and shut-downs. There is plenty of cash available to express “effectual demand“. In some categories, spending has surged and/or returned more quickly than sources of supply had anticipated. In some categories — such as restaurant meals, automobiles, and airline seats — there are structural challenges that continue to constrain supply below seasonal 2019 levels.

Demand is pulling and has the potential to pull harder. Supply is pushing toward demand, but suppliers are keen to avoid long-term capacity-building costs (capacity that is unlikely to be needed by early 2022). As a result, supplies can increase more gradually than demand. This incremental gap can suddenly deepen when demand surges all at once on a narrow target. These gaps and resulting market fluctuations are likely to persist through Christmas this year.

After Christmas? Others have some projections. But I will wait to see what can be seen as of late September… I already have a sense of trying to fly too high.

+++

Starting at noon today Chairman Powell will give testimony to the House Committee on Financial Services. Both a live webcast and an archive copy should be available. JULY 15 UPDATE: The Fed Chairman is watching carefully, but still perceives most of today’s sharp price increases are the outcome of temporary imbalances between demand and supply. If so, as demand moderates and supply chains optimize , prices should stabilize. Here’s the WSJ report.

Proving the benefits of diversity

I apply a self-conscious heuristic — let’s go with the Anglo-Saxon and call it a rule-of-thumb — that more diversity breeds more resilience. In most disaster contexts I do NOT have data or really much evidence that this assumption or principle or guess accurately fits the immediate problem-context. But I have seen enough data and evidence from analogous situations that I tend to make decisions that depend on the claim. (Such as here and here and here.)

Rigorous empiricists offer increasing evidence that takes us well-beyond inspired (or delusional) analogies. Late last week Nature, one of the most prestigious peer-reviewed journals, published, “Supply chain diversity buffers cities against food shocks“. The title states the claim. The paper organizes and analyzes data that persuasively demonstrates the claim.

The authors (two of whom I know), write, “For cities in the USA, the probability of an annual food supply shock S being greater than a shock intensity s, P(S > s) (see Methods), declines as the diversity D of a city’s food inflows supply chain increases … Using data for 284 cities and 4 food sectors, the annual probabilities of food supply shocks are calculated by measuring, for each city and food sector, the maximum food supply departure from the annual average during 2012−2015 (Methods). We utilize a total of 4,884 buyer–supplier subgraphs and 1,221 time series to calculate P(S > s) and D. Our results indicate that with greater supply chain diversity D, cities are more likely to avoid or resist shocks of increasing intensity (3%, 5%, 10% and 15%; Fig. 1a).”

It is an academic paper using scholarly language and calculus. The reasoning is, still, clear enough. Absolutely worth reading.

A narcissism of small differences?

Friday’s Executive Order includes, “over the last several decades, as industries have consolidated, competition has weakened in too many markets, denying Americans the benefits of an open economy and widening racial, income, and wealth inequality.”

Maybe this is just another way of saying: “A more diverse set of economic players will be more responsive to demand.”

Maybe there is little more here than a distinction between political rhetoric and network(y) language.

Mature high volume, high velocity networks tend toward consolidation. Functional concentrations of capacity often enhance network efficiency. But over-concentration can also increase the risk of catastrophic network failure. Tightly concentrated, interdependent networks are very effective at spreading good or bad.

I am interested in Supply Chain Resilience — if you are reading this, I suppose you are as well. Diversity and decentralization of network nodes combined with densely (critical?) diverse connectivity may achieve efficiencies of concentrated networks while reducing catastrophic risk.

The authors of the Executive Order do not address Supply Chain Resilience. They are much more concerned with labor market flexibility, consumer choice, easy access to economic markets, cost/price dynamics, and related second-order cultural, social, and political effects. The authors perceive that consolidation of ownership — especially consolidation of market value — reduces competition that ipso facto reduces market flexibility, openness, and responsiveness. (Or using my terminology: increases network friction and fragility.)

With this Executive Order the Biden administration intends, “to enforce the antitrust laws to combat the excessive concentration of industry, the abuses of market power, and the harmful effects of monopoly and monopsony — especially as these issues arise in labor markets, agricultural markets, Internet platform industries, healthcare markets (including insurance, hospital, and prescription drug markets), repair markets, and United States markets directly affected by foreign cartel activity.” So, there is a new focus — even targeting — for enforcing existing antitrust principles and processes. Unfortunately, this approach can only undo what has already been done.

Attempting to foster a more proactive, even preventive approach, the EO sets out, “Agencies can and should further the polices set forth in section 1 of this order by, among other things, adopting pro‑competitive regulations and approaches to procurement and spending, and by rescinding regulations that create unnecessary barriers to entry that stifle competition.”

This White House is in the middle of a process explicitly focused on Supply Chain Resilience (see here and here). I may be more inclined to connect this new EO to that ongoing work than anyone at the White House. The lack of any reference to Supply Chain Resilience by this new EO is important to acknowledge, even as consolidation, competition, and concentration are each crucial issues in Supply Chain Resilience.

I am trying — even straining — to be affirmative regarding the intentions that motivate this Executive Order and the February 24 EO specifically focused on supply chains. But I will confess that in each case I am troubled by what I perceive to be a preoccupation with treating symptoms rather than a principled diagnosis and prescription to address core causes.

Related Comments:

The Curse of Less Bigness by Robert Armstrong in The Financial Times.

Joe Biden, 20th Century Trustbuster by the Editorial Board of the Wall Street Journal

Civilization and its Discontents by Sigmund Freud (origin of the phrase “the narcissism of small (or minor) differences.”)

Consolidation, competition, and unintended consequences

Later today the President will sign a new Executive Order on Promoting Competition in the American Economy (according to the early morning fact sheet). I have not yet seen a final draft of the actual order. But be forewarned, the “facts” require fourteen sheets of 12 point type, more than 3600 words.

I did see a purported early draft of the EO. That draft was shorter and more focused, apparently similar to something the WSJ also received. That freight-focused piece was, however, still packed with very specific examples to spur proactive federal interventions. Actionable measures are increasingly the preferred currency of policymaking, much more than old fashioned statements of principle. According to the fact sheet, “The Order includes 72 initiatives by more than a dozen federal agencies to promptly tackle some of the most pressing competition problems across our economy.” Yikes.

But this morning on Bloomberg Surveillance, Danny Blanchflower characterized the EO as “an opening salvo… without any teeth.” (Watch/listen starting just before 1hr:13mn mark on the video.)

Salvo has two meanings in English. The better known (it seems to me) involves the concentrated release of artillery or language against a target. The second is to insert, usually in a legal document, specific reservations or exceptions. The White House almost certainly intends for this EO to achieve the first meaning. But as Dr. Blanchflower suggests, it is instead a fair example of salvo’s second meaning. Again and again the fact sheet critiques a specific economic outcome and reserves Presidential authority to undertake an exception for a particular group or situation. There is not (yet and for me) a clear vision of coherent principle.

I am told that one of the West Wing authors (well, probably, EOB telecommuters) of the Executive Order is Tim Wu. In 2017 while a faculty member at Columbia Law School, Mr. Wu wrote, Antitrust via Rulemaking: Competitive Catalysts. He explained, “The strategy involves using industry specific statutes, rulemakings, or other tools of the regulatory state to achieve the traditional competition goals associated with the antitrust laws.” Cass Sunstein, well-known for nudging, is referenced in two of Mr. Wu’s citations. I hear related harmonies. Despite it’s larger claims and considerable detail, the fact sheet suggests the economic equivalent of Cognitive Behavioral Therapy: a nudge here and there, not electroshock nor a frontal lobotomy.

Pareto proportions are remarkably persistent. Power laws seem to be innate. Consolidation can generate real benefits to consumers, producers, and the economy at large. Economies of scale can usually be exploited for the general welfare. As long as the economic system self-organizes around demand; especially when the ecosystem of demand and supply features and fosters considerable diversity.

In a recent personal exchange, a Chief Supply Chain Officer with a global retailer wrote, “In order to stay resilient to growing threats that await us — contagion, bio warfare, acts of god, or human misadventure — we need a common problem-solving framework. Each of these threats impact the supply chain in different ways stressing commodity pools in different ways. So a demand driven supply chain structure is needed to navigate this.” As common sensical as this may sound, it implies a revolutionary shift in current structures and (usually unconscious) management concepts.

A trucking company CEO reacted to proposed Biden administration Supply Chain Resilience measures, “The transportation industry remains diversified, decentralized, sustainable and resilient… If our trucking industry were as consolidated as our rail or pipeline industry, one hack could cripple our economy or a region, sending deep impacts nationwide. We depend on food and consumer goods for so much. There is no discernable benefit from the standpoint of service or flexibility or supply chain fluidity when industry consolidates to larger fleets.” This is more than a nudge, this is a principle, even a personal commitment.

So… whenever I am able to read the the Executive Order’s specific salvos, I will be looking and listening for how the principles of demand-orientation and system-wide diversity are consistently reflected in the seventy-two recommended actions — or not.

Demand is up. Supply is not keeping up.

This is not news. But the duration and depth of the disequilibrium is cause for concern. Above is what the US Census reports for April and prior. The May report will be released next week. Any bets on turning up or continuing down?

Despite Census bureau statistics, grocery distributors are stockpiling. Many manufacturers, facing longer lead-times, would stockpile if they could. Shifting and surging demand has exceeded production capacity in several product categories. Many owners of capacity perceive these shifts are temporary. Current capacity is being maximized, but not much is being invested in new and more. The output of that maximized capacity is sometimes not being loaded because supplies of packaging materials are short (more).

Whatever is ready for delivery is often delayed. From fuel to furniture, shipping capacity — sometimes flow capacity — has been constrained by lack of conveyance (truck or ship or plane) or lack of containers or insufficient space for the number of containers ready to ship. This turmoil has also significantly increased the price of shipping each container that is shipped.

My best guess is that this disequilibrium will broadly persist until Christmas. If, when, and where covid is contained, demand and supply will gradually rebalance as a pandemic-fueled fixation on “stuff” is relieved by more opportunity to consume experiences (e.g. travel, restaurant dining, live music, and such). I can even imagine excess inventories prompting some deep post-holiday discounting.