Month: June 2023

May food expenditures

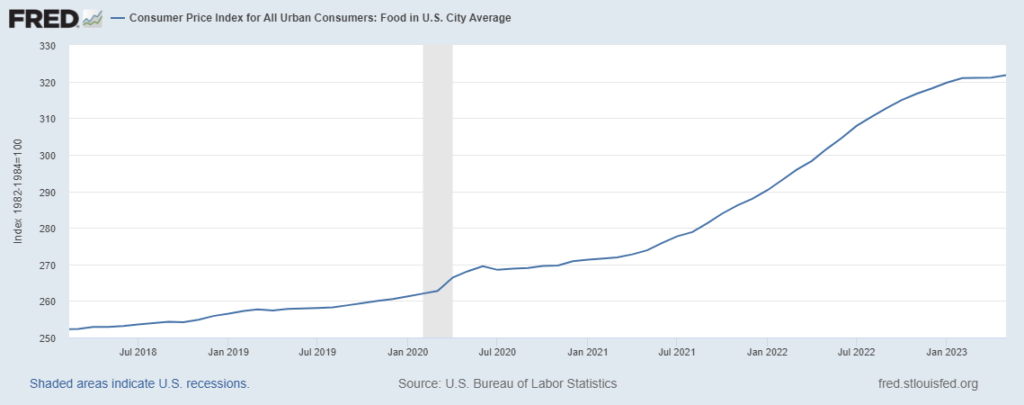
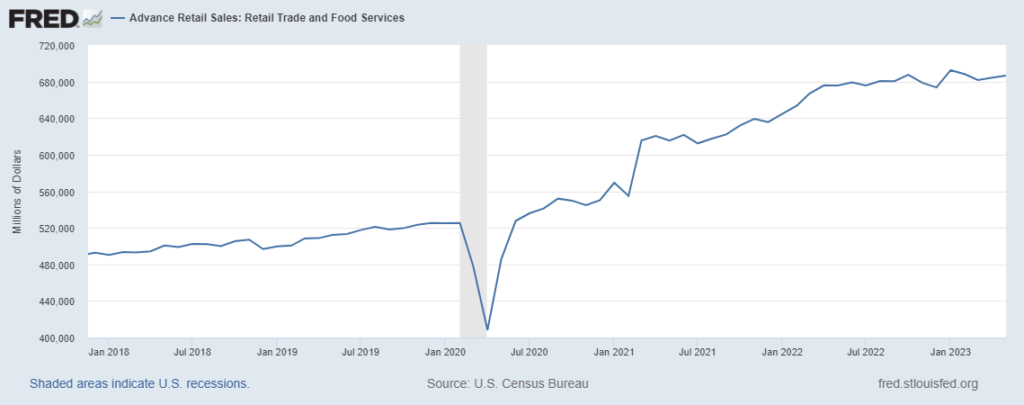
Americans continue to eat more — or at least spend more on — Food-At-Home. But our rate of increase has slowed considerably (see chart below). In May 2019 US consumers spent $981.7 billion (2012 dollars) on groceries and related. Last month we spent $1023.5 billion in 2012 equivalents. This is a bit more than a four percent increase (as we avert our eyes from the turmoil between then and now). From May 2015 to May 2019 real spending on food increased just about ten percent. Due to inflation it can seem like we are spending even more on food (again, see chart below). But for most of the last year our real, inflation-adjusted expenditures for food have been flat or falling… and as a result, food supply chain dynamics have been much more predictable. Current production and distribution capacity has been well-matched with demand.

Texas grid troubles (again)

[Updates below after the graphics] According to the National Weather Service, “an upper-level high over the south-central portion of the country, along with high temperatures and temperatures not cooling off much overnight, have contributed to Excessive Heat Watches/Warnings and Heat Advisories over most of Texas, southern New Mexico/Arizona, southeastern Oklahoma, Louisiana, Arkansas, Mississippi, and western Tennessee.” (See graphics below and specific forecasts here and here and here.)

The intensity of this week’s heat over such a wide area involving several significant population concentrations will stress grid capacity and continuity. (Significant force prompting wide-area, unpredictable demand for essentially fixed supply capacity (more).)

As noted last week, the ERCOT dashboard provides near real-time capacity, supply, and demand information. In recent days, solar has often exceeded anticipated capacity, while natural gas has contributed less. Wind has been, well, variable: some days delivering more than anticipated, other days less. Wind speeds could make a crucial difference this week. As of Sunday afternoon, Tuesday’s wind speeds are forecast to be ten or less miles-per-hour. Wednesday’s wind speeds are forecast at between 9 and 14 MPH. (More and more and more.) For current proportional flows, see “fuel mix” on the ERCOT Dashboard.

+++

June 27 Update: Monday’s demand for electricity across Texas fell just short of the record. Every type of fuel delivered as needed. Natural gas usage has hit a new record. According to S&P Global, “As the National Weather Service issues excessive heat warnings for dozens of counties across central Texas, gas-fired power burn demand has surged to an average 7.1 Bcf/d over the past week – about 1 Bcf/d above the prior three-year average and a new record high for late June… ” Tuesday’s projected supply from all sources exceeds projected demand by more than 10,000 MW despite even higher projected heat (here and here and here and here).

Bloomberg has a detailed piece on systemic problems complicating the contribution of natural gas to electric generation.

June 28 Update: Tuesday’s demand for electricity hit a new record (here and here and here and here). Despite the high heat and 80,875 MW pull, an almost 7000 MW buffer (operating reserve power) was maintained (more and more and more).

July 1 Update: S&P Global provides a concise after-action and look-ahead, “The heat wave that spread triple-digit high temperatures across the Electric Reliability Council of Texas footprint since mid-June has dissipated, slackening power demand forecasts for the first week of July, but substantially weaker wind forecasts have boosted day-ahead prices for July 3 delivery. CustomWeather forecast highs to average 96 degrees F July 3-7 for the Dallas metro area, up about 1.5 degrees from normal for those dates but down about 2.5 degrees from the National Weather Service’s average highs June 26-30. ERCOT’s 2:30 pm CT (June 30) load forecast shows peakloads averaging 76.3 GW July 3-7, down 4.7% from the July 26-30 average of about 80 GW.” I perceive that one factor that helped was a purposeful, prudent decision to over-estimate demand. This signal served to maximize production potential and output. This reflects the lessons of Winter Storms Uri and Elliott applied to summer extremes.

Upstream decides downstream

Drought has required that ships transiting the Panama Canal float higher. Starting today the largest vessels’ draft cannot be deeper than 43.5 feet (more). Higher in the water means less cargo. Due to this year’s drought Gatun Lake’s water level is almost five feet below its five year average (including a dry 2019) and is forecast to continue dropping. Gatun Lake is itself a travel lane and source of water for the canal’s locks and drinking water for local inhabitants. If water levels continue to fall the number of canal crossings may be reduced. Typically thirty-five or so ships cross the canal each day. Fewer than thirty are now being contemplated.

The Rhine River is also running low (if not, yet, quite as low as last summer). Rain over the last few days has bumped most river gauges just barely above the lowest mean value threshold while sparse rain is forecast for this week. In mid-June, Bloomberg was already reporting, “any barges planning on hauling diesel-type fuel past Kaub (on the Rhine) have been limited to loading just 60% of their maximum carrying capacity.” (More)

Since last week rain has finally returned to the Upper Mississippi watershed. The Missouri River and Lower Mississippi have benefitted from higher-than-average snowmelt and more typical seasonal precipitation. (See preexisting conditions with map below, more). Local farmers hope this is just in time to save spring planting (more). Until this week’s precipitation, the Upper Mississippi seemed threatened by a second year of low flow (here and here). Even with recent (current) rain, downstream levels are still forecast (more) to continue falling.

The literal upstream to downstream dynamics here are important enough. The potential analogies for wider demand and supply networks are worth consideration. Upstream surplus or drought defines downstream capacity. Measures of midstream channel flows are indicative, if less than conclusive, regarding potential supply. Where and when, how widely and for how long, upstream and midstream capacity is constrained will decide what proportion of downstream demand is fulfilled when and where.

Private-public resilience profile: I-95

On Sunday, June 11 the driver of a gasoline tanker truck lost control on the Cottman Avenue exit from Interstate-95 in Philadelphia. The resulting fire caused the elevated deck of the northbound Interstate to collapse and seriously damaged the southbound deck. The driver did not survive. Since the accident, several miles of Interstate-95 have been closed to traffic.

City and state officials took quick action to divert traffic, extinguish the fire, establish detours, expand public transit options, and facilitate freight flows on other routes. Up to 160,000 vehicles per day often travel the disrupted route (AADT and more and more).  This includes up to 20,000 freight-hauling trucks per day.  On most days three-quarters of this freight volume is focused on serving the immediate urban matrix in Southeast Pennsylvania. 

Local carriers have — with difficulty — adapted to the impediment. Most long-distance flows actively avoided this densely traveled route even before the incident. 

On the best days, Interstate travel in the Philadelphia region can often be congested. Closure of this segment of I-95 has increased congestion and slowed both commuter and freight flows. Freight flows discharging into and out of central Philadelphia have been especially impacted.  While longer distance flows have been less impacted, the additional friction has time and cost implications that are acute for some carriers and consumers and have been accumulating across the region.

Federal, state, and local leaders all promised quick action to restore the lost network segment. Less than two weeks later, a temporary solution just reopened to flow. According to the Associated Press, “… Workers [have filled] the gap — which is roughly 100 feet (30 meters) long and 150 feet wide — by piling recycled foam glass aggregate into the underpass area, bringing it up to surface level and then paving it over so that three lanes of traffic can reopen each way…”

The glass aggregate is produced by AeroAggregates of North America. The company operates south of Philadelphia where it processes recycled glass bottles and jars into powder that is then heated into a foam to produce small, lightweight glass nuggets. The company’s CEO, “estimated that it will take about 100 box-truck loads to haul about 10,000 cubic yards (7,600 cubic meters) of the glass nuggets required for the I-95 project. The total weight is around 2,000 tons, a fraction of the weight of regular sand or dirt, meaning that it will take many fewer trucks to bring it to the site…” More on this innovative solution is available via the week-old local TV news report below.

This morning — Friday, June 23 — two fire-trucks were the first two vehicles to cross the reopened section (more and more).

Resilience implications: The importance of this channel — this concentrated capacity — was widely recognized by both private and public sectors. Coordinated intergovernmental funding and action was taken to expedite mitigation. Private sector flows adapted as possible. Public sector decision-makers sought out innovative means of reopening the channel. Upstream has now reclaimed its downstream capacity in less than two weeks. It does not always happen this way. It is absolutely worth celebrating when it does.

+++

June 28 Update: Very nice after-action from Bloomberg. Here’s a taste: “The fast feat was “a small miracle” in many respects. What made it possible: emergency, no-bid contracts, around-the-clock repair crews, a guarantee from the federal government to pick up the check, and no small amount of Rust Belt ingenuity.”

September 3 Update: In late August the Washington Post ran a related story headlined: “Avoiding ‘carmageddon’ after the I-95 collapse“. Some details confirming what is outlined above.

Overfed feedback?

From time to time, most recently on May 2, this blog has given attention to Supply- and Demand-Driven Contributions to Annualized Monthly Headline PCE Inflation by staff with the Federal Reserve Bank of San Francisco. Yesterday an extended review and update was published by the FRBSF. Below are a few quotes to encourage you to read the full report here.

As suggested by the chart below, this analysis draws on two other Federal Reserve statistical products: Personal Consumption Expenditures (PCE) and the Global Supply Chain Pressure Index (GSCPI). Is there a statistically valid relationship and, if so, what does this relationship tell us?

Supply chain disruptions increase input costs and raise the public’s expectations for higher prices. We estimate that these effects contributed about 60% of the above-trend run-up of headline inflation in 2021 and 2022...

Since supply chain disruptions directly constrain supplies of traded goods, with only indirect effects on services, one would expect a GSCPI shock to boost goods price inflation more than overall inflation. This is the case in our model results. We find that a one standard deviation shock to the GSCPI raises PCE goods inflation by up to 1.5 percentage points relative to the pre-shock level, about three times the peak effect on overall inflation…

Disruptions to global supply chains are often associated with surges in commodity prices. Studies have shown that people’s inflation expectations—especially for short-term, one-year ahead inflation—are sensitive to commodity price fluctuations… A tightening of supply chain constraints can raise imported goods prices, which are then passed through to consumer prices… In response to supply chain disruptions, businesses would pass increases in intermediate input costs through to consumer prices...

… as costs move further along the production chain, from initial inputs to intermediate goods, PPI inflation becomes less sensitive to a GSCPI shock. The effects of the shock on final consumer goods inflation are even more muted…

The Federal Reserve is mostly interested in price stability and maximum sustainable employment. I am mostly interested in flows (and frictions) of demand and supply. What I indirectly perceive in the FRBSF analysis is how seriously disrupted demand — and suppliers’ (over?) response to such disruptions (e.g., 2020) — can spawn a stubborn feedback loop that amplifies and extends both demand and supply disruptions (e.g., 2021 and the first half of 2022). How many times do we have to play the Beer Game before we have a disciplined confidence in the parameters of demand vis-à-vis core production/ distribution capacity?

Global Supply Chain Pressure Index and PCE inflation

Texas — and more — grid capacity

[Important updates below] The summer solstice is forecast to bring triple digits to wide areas of Texas with the heat index rising above 110 F for three consecutive days in many places including metro-Houston, Austin, and most of the Texas Triangle.

The Electric Reliability Council of Texas (ERCOT) has announced a “Weather Watch” through June 21. Grid capacity, supply, and demand can be monitored at the ERCOT dashboard. The Houston Chronicle has published a helpful primer on how to interpret the dashboard’s outputs.

S&P Global offers its own Texas forecast for next week including, “The load forecast keeps changing and has had a great deal of error due to unpredictable convective risks,” said Campbell Faulkner, senior vice president and chief data analyst at OTC Global Holdings, an interdealer commodity broker. “What will determine if load records are broken will be if the high pressure heat ridge intensifies in a way that the various weather models are currently struggling to nail down. But ERCOTs price sensitivity to heat load became very clear last year due to issues with being able to cleanly forecast both solar/wind output and gross line congestion across the system.”

ERCOT’s electric generating capacity is — or should be — sufficient to meet historical demand. There is, however, real risk of demand exceeding its historic parameters. There is also the risk of losing capacity inputs at just the wrong time and place. The risk of “gross line congestion” can be an even more insidious factor. As this blog noted a few days ago, Texas and the entire US grid needs many more “major high-voltage power lines that connect different grid regions.” (More and more)

According to the NERC Summer Reliability Assessment:

Given an Anticipated Reserve Margin of 23% and Reference Reserve Margin of 13.75%, ERCOT expects to have sufficient operating reserves in expected normal summer system conditions… ERCOT’s probabilistic risk assessment indicates a low probability of energy emergency conditions during the summer peak load period, but the risk increases into the early evening hours due reductions of solar PV generation. There is a 4% probability that ERCOT will declare an EEA1 [Energy Emergency Alert 1] during the expected daily peak load hour increasing up to 19% probability at the highest risk hour ending at 8:00 p.m. System stability and strength stemming from the growth of IBRs [Inverter Based Resources] remains a concern. ERCOT is also experiencing large increases in renewable production curtailments due to transmission constraints, and these curtailments are increasingly occurring at solar PV sites.

This is not just a Texas problem. This blog has given particular attention to the risks emerging from last year’s Christmas Eve surprise that impacted some of the most robust and resilient regional grids (more). According to the Summer Reliability Assessment, six other sectors of the North American grid have lower Anticipated Reserve Margins than ERCOT (in case of high demand, outages, and derates). The particular problem areas are shown in orange on the map below.

As they say, this is a developing story. Look below for more next week.

+++

Saturday afternoon additional comment: A couple of readers have wondered about my focus on Texas heat rather than a possible Caribbean hurricane. I am watching the NHC forecasts too. But — right now — I am more attentive to Texas because we have a much more precise sense of force-on-target (even measurable force on concentrated capacity) than is yet possible for so-called Disturbance 1. In response-mode Supply Chain Resilience is mostly about recognizing if and how crucial capacity concentrations will be impacted and taking mitigation action. By Tuesday it may be possible to give similar attention to capacity concentrations in both East Texas and the Eastern Caribbean.

June 20 Update: Today’s Texas temperatures — and heat index — will still be tough. But at least early this morning, this week is now not expected to be quite as extreme as forecast and less troublesome than what is now forecast for next week. In the Caribbean, Bret is strengthening but force-on-target is still not predictable. A further update as of midday: The anticipated capacity deficit has now been discerned as unfolding in real time. ERCOT has warned of a “projected reserve capacity shortage with no market solution available” after 1500 hours Central Time today. Consumers are requested to reduce demand. Part of what is happening is the Houston forecast of 101 F has now been ratcheted up to 103 F. Austin may hit 106 F. Without reduced consumer demand, rolling black-outs may be instituted. (More and more and more.)

June 21 Update: The Texas grid avoided the worst… one more time. As the following chart suggests, it was a close. Demand for electricity hit new records on both Monday and then on Tuesday. But it also appears that many consumers cooperated with requests for voluntary reductions in demand. It could — easily — have been worse. (More and more and more.) Mexico is also facing similar capacity-challenging demand. TS Bret is about to peak and then degenerate… without impacting significant aspects of concentrated capacity.

Tai on trade and supply chains

Yesterday Ambassador Katherine Tai, the US Trade Representative, spoke to the Open Markets Institute. It is worth reading the full speech. Following are a few excerpts especially relevant to Supply Chain Resilience.

… our global supply chains, which have been created to maximize short-term efficiency and minimize costs, need to be redesigned for resilience.   Because resilient supply chains are vital for greater national and economic security. By this, we mean production that can more easily and quickly adapt to and recover from crises and disruptions.  It means having more options that run through different regions. But getting there requires a fundamental shift.  A shift in the way we incentivize decisions about what, where, and how we produce goods and supply services...

Let me unpack this a bit more.  I want to start with critical minerals.  The underlying problem is clear—we are dependent on a range of critical minerals and materials for products we use every day, everything from engines to airplanes to defense equipment. Demand for many of these metals is projected to surge over the next two decades, especially as we work to achieve net-zero greenhouse gas emissions by 2050; but the PRC already controls more than half of global mining capacity and 85 percent of refining.   Those are vulnerabilities—or in the terminology of competition policy, “chokepoints”—that we need to address and break.  And we are working with Congress, stakeholders, and partners to develop responses that help foster the kinds of supply chains we want to see for clean energy products—like commitments on export duties, non-market policies, best practices on investment screening, and labor rights...

The more concentration of capacity, the more risk is pooled. The more diverse and dispersed production, distribution, and demand capacity, the less our risk of catastrophic consequences.

+++

June 18 Update: Two pieces of related journalism. In today’s Financial Times (online) Rana Foroohar comments favorably on Ambassador Tai’s speech and offers three “conclusions” for our shared consideration. Then, the lead front page story in the Sunday New York Times is headlined, “Failures of Globalization Shatter Long-Held Beliefs” (in the newspaper) while online is titled, “Why It Seems Everything We Knew About the Global Economy Is No Longer True“. Included is reportage resonant with Tai’s remarks. Such as, ““Our supply chains are not secure, and they’re not resilient,” Treasury Secretary Janet L. Yellen said last spring… Economic networks, by their very nature, create power imbalances and pressure points because countries have varying capabilities, resources and vulnerabilities… The extreme concentrations of critical suppliers and information technology networks has generated additional choke points.”

Mid-June Vitals

[Several updates through July 1 continue after the charts] Below are five very broad indictors that I revisit every four to five weeks. Consider these outcomes in the context of other more comprehensive and detailed measures, such as the Supply Chain Stability Index, the Logistics Managers Index (see first chart below), and the Global Supply Chain Pressure Index.

North American Agricultural Production: I have been worried by early signals of sustained drought across much of the mid-continent. But so far, USDA and others are encouraging (at least in terms of volumes, if not prices). The World Agricultural Supply and Demand Estimates (WASDE) continue to anticipate good harvests. According to the June 9 update, “The outlook for 2023/24 U.S. wheat this month is for larger supplies, unchanged domestic use and exports, and higher stocks. Supplies are raised as all wheat production is projected at 1,665 million bushels, up 6 million from last month…” Corn projections also look good. US livestock and dairy production is mostly fluctuating in response to demand. Fresh produce prices have fallen and supplies are abundant (more). Global food prices are also softened. A wide range of indicators suggest, however, that SNAP beneficiaries are struggling to adapt to the loss of pandemic supplements (here and here and here).

Global Natural Gas Demand and Supply: US natural gas inventories are comfortably within the five-year average range (more). EU natural gas storage facilities are over seventy percent full. Natural Gas prices have returned to pre-war levels and are toward the low end of pre-pandemic prices. According to Bloomberg, “Futures for December 2023 (EU benchmarks) are trading at a discount of about 8% to December 2024, according to ICE Endex data. That’s a reversal from January, when the nearest winter contract traded at a premium. The shift indicates Europe is relatively well-prepared for the coming heating season following a mild winter that allowed it to build up inventories with an influx of liquefied natural gas. But the coming years are more uncertain, as the region adjusts to a new reality with scant help from former top supplier Russia.” Asian demand for LNG has been insufficient to push up global prices.

China Export Volumes and Value: According to a June 7 report by Reuters, “China’s exports shrank much faster than expected in May while imports extended declines with a grim outlook for global demand, especially from developed markets, raising doubts about the fragile economic recovery.” As the domestic economies of several customers of China slow-down, orders for China’s manufactured goods have also declined (see chart below). Without this external stimulus, China’s domestic consumption has been flat. Recent action by China’s Central Bank confirms the domestic slowdown and efforts to turn this around (more). It is worth noting that volumes (and value) continue to be above pre-pandemic levels and trend-lines. This is not a collapse. So far, it is much more of a correction that reflects more sustainable demand velocity.

North American Grid Capacity: As previously noted by this blog, current capacity should probably be okay this summer unless there is a surprising spike in demand (probably due to a “surprise” extreme weather event). US electricity generating capacity is growing, especially in those regions with increased demand (more and more). On June 12, the New York Times published a long piece titled Why the US Electric Grid is not Ready for the Energy Transition. This (and other) reports focus on the increasing mis-match between generating capacity and transmission capacity. According to the NYT, “In recent decades, the country has hardly built any major high-voltage power lines that connect different grid regions. While utilities and grid operators now spend roughly $25 billion per year on transmission, much of that consists of local upgrades instead of long-distance lines that could import cheaper, cleaner power from farther away.”

US Personal Consumption Expenditures: Yesterday’s May Consumer Price Index (more) suggests that expenditures by US consumers are gradually decelerating — even with continued strength in the labor market. Slower pull is unfolding into slower (and less expensive) push (more). Flows remain huge. But current flows are flat or even receding, especially compared to late-pandemic bounce-backs. This is not a drought. But compared to flooding during the first half of 2022, consumers are less thirsty. As a result, suppliers don’t need to sweat as much (which is not always good news if sweating is part of what you sell).

+++

June 15 Update: The Financial Times headlines, “Chinese economic data fuels gloom over recovery.” Bloomberg piles on with, “An undershoot in [China] retail sales showed the consumption recovery lost more momentum. A sharper-than-expected slowdown in fixed asset investment showed sinking private spending, particularly in the property sector, is overwhelming government stimulus in the form of outlays on big projects.” (More and more.) But… the energy market was much more positive regarding new data showing “China’s oil refinery throughput rose 15.4% in May from a year earlier, hitting its second highest total on record.” Please choose your preferred retrospective leading indicator.

June 16 Update: S&P Global delivers a very helpful round-up of anticipated Southern Hemisphere Agricultural Production given historical El Nino effects.

June 19 Update: I am not the only one worried about Midwest precipitation and lack thereof. According to S&P Global, “The prolonged dry weather across the key regions of the US — especially in the eastern Corn Belt and northern parts of the Midwest — has stoked fears of drought for the corn and soybeans farmers.” Talking with locals over the weekend, yields could still be okay if rain arrives “soon” (as in the next five days). But this is not what the forecast currently projects for most of this morning’s dry places. There is some possibility of precipitation-on-target inside the next seven days — for some places. Just in Time?

LATE JUNE UPDATE (July 1)

Too much is happening for me to feel confident that I am tracking even general directions. So, here is a quick effort to recalibrate (or at least confirm or clarify).

North American Agricultural Production: Rain in the Upper Mississippi River basin has helped temporarily recover water levels for navigation (see mid-Mississippi too). But the drought at the heart of corn and soybean country has persisted. Commodity prices have been reflecting worry, but are not yet signaling deeply discounted yields (more and more). A great deal depends on rain that is expected over the next few days (July 1-3) and later in July. Fresh fruits and vegetables are mostly abundant. Produce prices were up an average of 1.3 percent in May. Since then, according to industry sources, prices (and demand) have been “steady”… especially in contrast with late 2022 price hikes (here and here).

Global Natural Gas Demand and Supply: With the recent — current in some places — heat wave, US demand for natural gas has far exceeded multi-year averages. There has also been significant demand for US LNG exports. Prices have, however, not surged given sustained production/distribution flows and competition from other energy sources. Below please see an S&P Global Infographic with a good overview of the natural gas context in Europe. Slow economic growth in Asia combined with comparative high prices (and given the war, less demand urgency than Europe) has reduced LNG flows to Asia.

China Export Volumes and Values: Recent reports on China’s economic performance continue to emphasize slow to negative outcomes. Bloomberg reports, “It was meant to be the year China’s economy, unshackled from the world’s strictest Covid-19 controls, roared back to help power global growth. Instead, halfway through 2023, it’s facing a confluence of problems: Sluggish consumer spending, a crisis-ridden property market, flagging exports, record youth unemployment and towering local government debt. The impact of these strains is starting to reverberate around the globe, impacting everything from commodity prices to equity markets.” (More and more.) China has the capacity to export more and wants to export more, but especially as North American and European central banks try to depress demand to moderate inflation, existing pull is not motivating anything close to maximum push.

North American Grid Capacity: Texas has been providing a constructive use case playing out in real-time. Here is this blog’s recent coverage (be sure to see updates below the graphics). Here is a blurb that I have inserted in many recent emails: There are systemic, structural issues of grid transformation that increase the likelihood of grid failures — and these factors will almost certainly NOT be resolved in the next decade. There are specific issues of increasing demand (e.g., EV and other electrification, especially in high-growth regions), transmission/distribution (e.g., paucity of long-distance high capacity confident connections), and generation (e.g., changing mix of sources) that conflate to amplify risk. So, given this higher risk of long-term, wide-area grid failure, it is especially important that we (meaning private-public collaboratives) have the ability to facilitate flows of water, food, fuel, and other crucial freight when and where the grid is gone for an extended time over a wide area.

US Personal Consumption Expenditures: This blog tends to give particular attention to food PCE (both nominal and real). This was updated yesterday here.

Soooo… many aspects of demand have moderated and demand/supply equilibrium has been (is being) reestablished. Where and when demand has increased, there has — so far — usually been sufficient push capacity to fulfill pull capacity. There are upstream factors that threaten to constrain some push capacity. There are risks of sudden spikes in demand. There is probably enough buffer capacity to handle short-term and tightly targeted spikes. If demand spikes evolve into longer-term surges there is an increasing risk of demand/supply disequilibrium amplified by any lags in distribution capacity or loss of production capacity… especially as disequilibrium expands over time and space.

US food inflation (plus retail sales)

In May the Consumer Price Index for food continued flat (see chart below) showing little change since February. The overall CPI headline number “rose 0.1 percent in May on a seasonally adjusted basis, after increasing 0.4 percent in April… Over the last 12 months, the all items index increased 4.0 percent before seasonal adjustment,” according to the US Bureau of Labor Statistics. While core inflation remains above policy-making targets, the direction of travel is widely considered encouraging. According to Bloomberg, “At 4%, year-over-year inflation is now at its lowest level since March 2021.” What I read into these statistical bytes is that many Americans have reduced expenditures on what they physically bite off at most meals. Please see more below the chart.

+++

June 15 Update: May retail sales (not inflation-adjusted) were up slightly, please see chart below. This includes food sales, but I am going to call food sales flat. Grocery store sales, adjusted for selling days and season, are reported as $73,731 million for March, $73,634 million for April, and $73,792 million for May. Food-Away-From-Home sales have also been stable for the last 90-plus days, moving between $87,392 million and $87,997 million. I know this is getting redundant, but it is worth noting how far above pre-pandemic trends these levels of retail sales remain… for essentially the same size population (more).

June 19 Update: According to Bloomberg’s Business Week, “… household spending on “food away from home” surpassed spending on “food at home” for the first time in 2015, and after falling back in 2020, it’s now back on top by a bigger margin than ever…“Food away from home” accounted for 53.2% of US household food spending in 2022, the USDA estimates, up from 48.3% in 2020 and 43% in 1997.”