Last year Adam Shapiro at the Federal Reserve Bank of San Francisco deployed a method for measuring the comparative contributions of demand or supply to the PCE inflation rate. You can read how he does this with an Economic Letter published in June 2022.
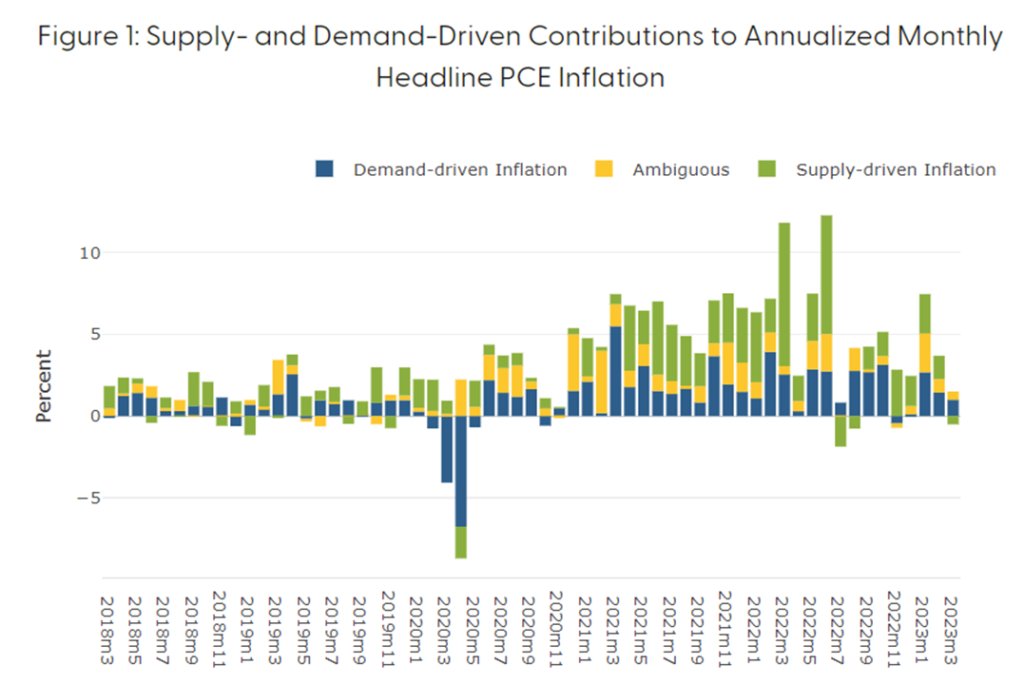
Monthly results since March 2018 are available at a FRBSF research webpage. Four angles on the comparative contribution are offered. Below is Supply- and Demand-Driven Contributions to Annualized Monthly Headline PCE Inflation through March 2023.
Dr. Shapiro seeks to “quantify the degree to which either demand or supply is driving inflation in a current month.” He further explains:
The series show expected time-series patterns. The demand-driven contribution tends to decline during recessions, while the supply-driven contribution tends to follow food and energy prices. Monetary policy tightening acts to reduce the demand-driven contribution of inflation. Oil-supply shocks act to increase the supply driven contribution, but decrease the demand-driven contribution of inflation. The decompositions can be used to test theory or by policymakers and practitioners to track inflation drivers in real time.
I am less concerned about inflation and more concerned about the equilibrium of demand and supply and, more specifically, the efficacy of push to fulfill effectual pull. Further, as regular readers know, I am especially interested in the dynamics of food, fuel, and freight under duress. I perceive Dr. Shapiro’s outputs can be helpful indicators of this (dis)equilibrium.
So, what I read in the chart below is that the shorter the bar, the better the overall balance between demand and supply. For me the credibility of Dr. Shapiro’s differentiation of demand or supply contributions is reinforced by the findings for the first half of 2020. We know that overall demand dried up. The disproportionate contributions of supply to 2022’s PCE inflation rate also resonate with my felt experience of consequences related to labor, raw materials, parts, and other production problems.
What I also “see” is how persistently higher — and only partially fulfilled — demand in 2021 caused increasing “congestion” that prompted profound volatility and disequilibrium across most of the first half of 2022. (I imagine that “caused” and “prompted” may be fighting words for some.)
Appropriate or not, this exegesis views the results since January 2023 as demonstrating a consistent improvement in the balance between demand and supply and, with the March results, the emergence of a slight (0.51 percent) overall excess supply.
What do you see?