Month: December 2023

Fundamentals of flow

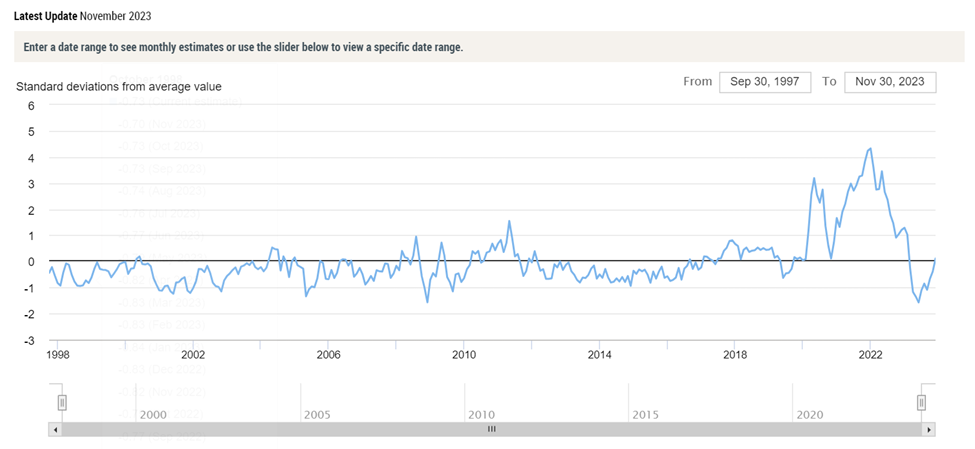
At the end of November, according the the Global Supply Chain Pressure Index, pull and push were about as balanced as at any time this century. See chart below. Two US-focused measures — the Cass Freight Index and the Logistics Managers Index — can be read (without too much distortion) as coherent with the GSCPI signals.

This balance is never universal or problem-free. There is always friction. Small differences in friction can be decisive to flows. Acceleration or deacceleration and related reaction functions persist, especially at higher scales. Most readers live in places where these dynamics can quickly display dramatic changes — as seen between March 2020 and late 2022.

For the last two years this blog has supplemented GSCPI, LMI, and other more comprehensive measures with monthly snap-shots focused on demand velocity, food volumes, energy supplies, and transnational trade (for example, here and here). I have tried to cherry-pick some sector-specific data to confirm, clarify, or correct the big picture indices.

This monthly discipline has underlined the power of effectual demand. The reaction function related to EU natural gas demand and supply has been fascinating — and mostly very encouraging (see here and here). Similar behavior at somewhat slower speed has been observed in agricultural, other energy, and many other markets.

Despite wars, rumors of war, famines, earthquakes, cyclones, drought, floods, prospect of plague, and other troubles, flows ebb and rise in response to demand. There have been awful exceptions. But even these exceptions have seemed to prove the rule: pull attracts push. To be explicit: need alone does not pull. Push is attracted to credible promises of value greater than value delivered.

Downstream demand attracts upstream supply. Here is how this dynamic is described by the authors of the November LMI:

Downstream respondents… are still seeing some growth. Inventory is contracting slower Downstream (48.8 to 40.8). Downstream firms are seeing Warehousing Utilization growing at a significantly faster rate (59.8 to 48.4), Transportation Price is holding steady rather than contracting (50.0 to 41.5) and Transportation Utilization expanding rather than contracting (55.1 to 47.9). Taken altogether, this suggests that inventories were pushed towards consumers, and last-mile deliveries are ongoing, leading to the higher levels of Transportation Utilization Downstream (despite the higher Transportation Capacity expansion Downstream)… Interestingly, Upstream firms are predicting increases in Inventory Levels going forward, while Downstream is not. If those predictions hold, we may eventually see freight rates increasing Upstream as well as Downstream. 

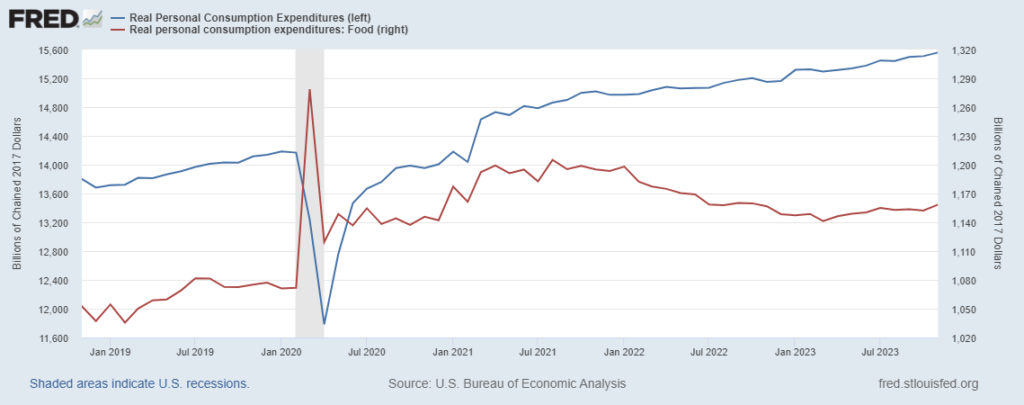
As we move into 2024 I will adjust my monthly snapshot to focus on downstream demand for food, upstream supply of food (more and more), and channels for food delivery. Fuel and other energy costs are important components of food flows, so there will be continuing attention to these elements. I will give much more attention to freight markets (more and more).

This shift is partly motivated by worry. Global food production is enormous and widely distributed. This robust scale lends innate resilience… as does sustained pull. Food production is also seasonal and vulnerable to factors beyond human control. There is evidence of increasing vulnerability. Reuters recently reported,

The El Nino weather phenomenon, which brought dryness to large parts of Asia this year, is forecast to continue in the first half of 2024, putting at risk supplies of rice, wheat, palm oil and other farm products in some of the world’s top agricultural exporters and importers. Traders and officials expect Asian rice production in the first half of 2024 to drop as dry planting conditions and shrinking reservoirs are likely to cut yields… India’s next wheat crop is also being threatened by lack of moisture, which could force the world’s second-largest wheat consumer to seek imports for the first time in six years as domestic inventories at state warehouses have dropped to their lowest in seven years... Come April, farmers in Australia, the world’s No. 2 wheat exporter, could be planting their crop in dry soils, after months of intense heat curbed yields for this year’s crop… “The (wheat) supply situation in the current 2023/24 crop year is likely to deteriorate compared to last season,” Commerzbank wrote in a note.

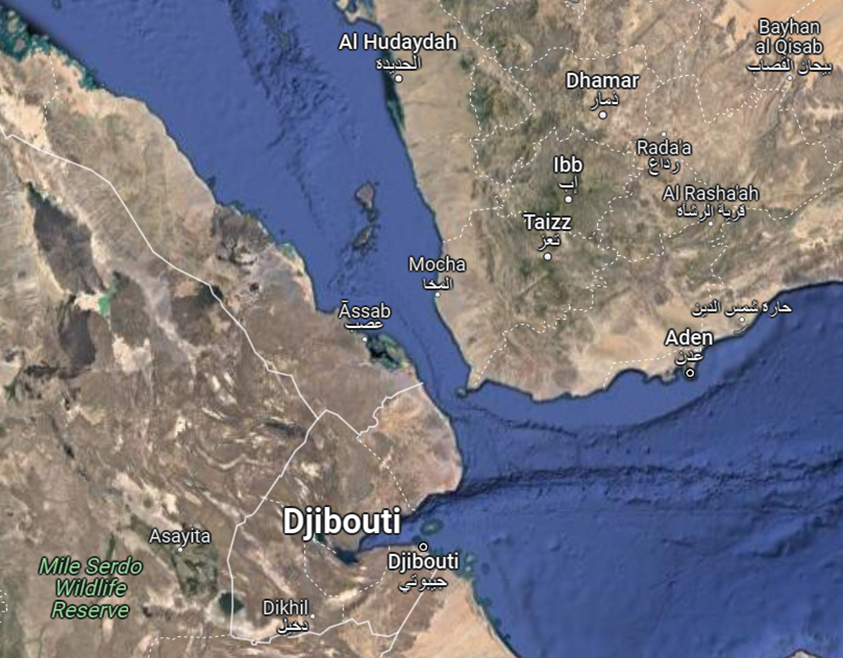
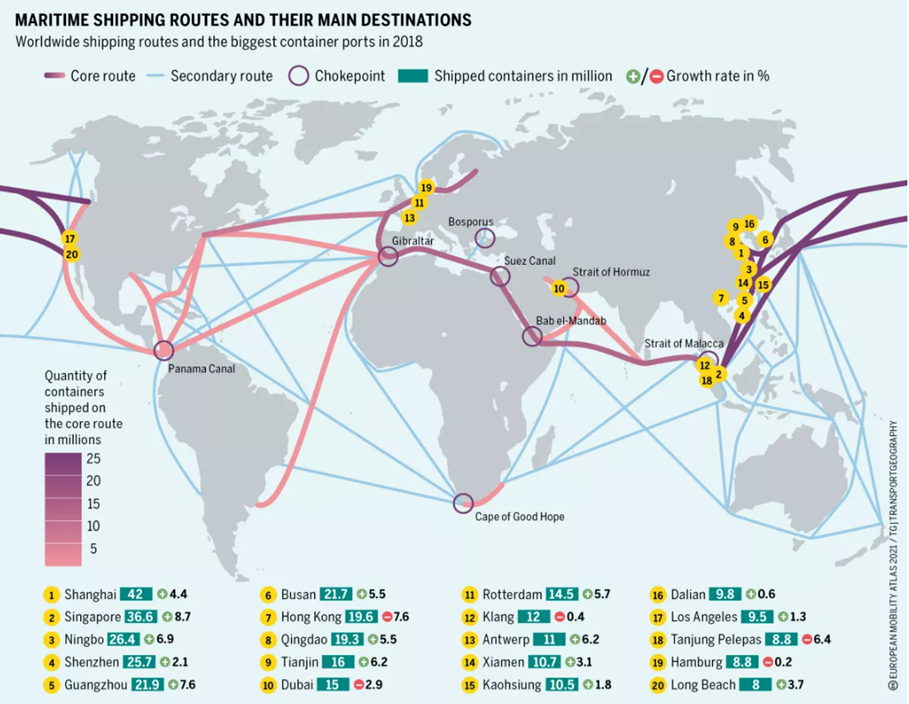
Serious, sustained, and widespread upstream constraints will increase the amount of pull needed to attract available supplies (this is often called inflation). Drought-like conditions either upstream or downstream (even more if both) will stress channels in between. And as we have recently seen at the Panama Canal, Suez Canal/Red Sea, Mississippi River, and elsewhere, many channels are having their own systemic problems regardless of supply chain pull or push.

In my experience, the best way to manage worry is to improve observations, preparation, and readiness to creatively respond.

Very best wishes for the New Year.

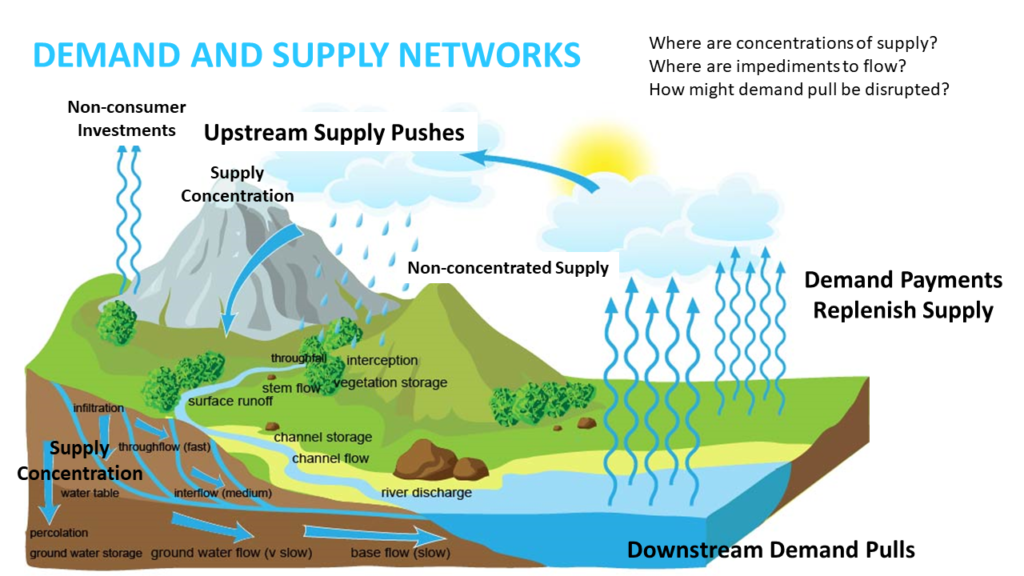
Below is my own mind-map for some key systemic characteristics of demand and supply networks. It works well for me. But I notice it can too often be meaningless — or even misleading — for others. I welcome your critique or questions. I wonder what I have misconceived or how I can more effectively illustrate these dynamics.

2023 Consumption-Demand-Pull

According to the Bureau of Economic Analysis, “Personal income increased $81.6 billion (0.4 percent at a monthly rate) in November. Disposable personal income (DPI)—personal income less personal current taxes—increased $71.9 billion (0.4 percent). Personal outlays—the sum of personal consumption expenditures (PCE), personal interest payments, and personal current transfer payments—increased $47.8 billion (0.2 percent) and consumer spending increased $46.7 billion (0.2 percent). Personal saving was $839.8 billion and the personal saving rate—personal saving as a percentage of disposable personal income—was 4.1 percent in November.”

In November 2022 American consumers spent 15,150 billion inflation-adjusted dollars. Last month we spent spent 15,558 billion dollars (see chart below). This is probably about $500 billion more than where pre-pandemic patterns would have brought us. But our rate of change has been coherent with pre-pandemic performance since about October 2021. In any case, healthy, sustainable pull for most push categories — including Food-at-Home as shown below with the red line.

From dark into light

Los puentes colgantes by Federico García Lorca

Oh qué gran muchedumbre,
invisible y renovada,
la que viene a este jardín
a descabsar para siempre!

Cada paso en la Tierra
nos lleva a un mundo nuevo.
Cada pie lo apoyamos
sobre un puente colgante.

Comprendo que no existe
el camino derecho –
Sólo un gran laberinto
de encrucijadas múltiples.

Constantemente crean
nuestros pies al andar
inmensos abanicos
de senderos en germen.

Oh jardín de las blancas
teorías! Oh jardín
de lo que no soy pero
pude y debi haber sido!

 Floating Bridges

Oh what a crush of people
invisible reborn
make their way to into this garden
for their eternal rest!

Every step we take on earth
brings us to a new world.
Every foot supported
on a floating bridge.

I know there is no straight road
no straight road in this world.
Only a giant labyrinth
of intersecting crossroads.

And steadily our feet
keep walking and creating
like enormous fans
these roads in embryo.

Oh garden of white
theories! Oh garden
of all I am not, all I
could & should have been!

The poem is by Federico García Lorca the great Spanish — Andalusian — poet. The photo is of a “floating bridge” over the Almanchares River between Sedella and Canillas de Aceituno, along the ancient spring-fed waterways so crucial to this region. Surely I am not the only Supply Chain or related person who perceives our daily context in these verses. This is where we step. This is why we go. This is how we flow along these intersecting crossroads, giving what we can, making our way in this world, and even unto the next.

כִּי-הִנְנִי מֵבִיא אֶת-עַבְדִּי, צֶמַח.

Kerem Shalom updates

Just in case, updates on humanitarian logistics continue at the December 9 post. Please see chart below. Before October 7 a rough average of 500 trucks per day supplied the residents of Gaza. Two-hundred food and fuel trucks per day has been estimated as minimal to avoid mass starvation. [December 22 Update: Only eighty-eight supply trucks entered Gaza on December 21. Yesterday a new analysis of food insecurity in Gaza reported, “Around 85% of the population (1.9M people) is displaced, with many people having relocated multiple times, and currently concentrated into an increasingly smaller geographic area. There is a risk of Famine and it is increasing each day that the current situation of intense hostilities and restricted humanitarian access persists or worsens.” (More and more.)]

Long-term grid reliability (and risk)

Last week the North American Electric Reliability Corporation (NERC) released its 2023 Long-Term Reliability Assessment (not to be confused with the winter reliability assessment). Here’s the first substantive paragraph in full:

The North American BPS (Bulk Power System) is on the cusp of large-scale growth, bringing reliability challenges and opportunities to a grid that was already amid unprecedented change. Key measures of transmission development and future electricity peak demand and energy needs, which NERC tracks and reports annually in the LTRA, are rising faster than at any time in the past five or more years. New resource projects continue to enter the interconnection planning process at a faster rate than existing projects are concluded; this increases the backlog of resource additions and prompts some Regional Transmission Organizations (RTO) and Independent System Operators (ISO) to adapt their processes to manage expansion. Industry faces mounting pressures to keep pace with accelerating electricity demand, energy needs, and transmission system adequacy as the resource mix transitions.

While not the most elegant set of sentences ever written, this is a reasonable statement of what is happening as the old grid makes a paradigm-shift over the next decade-plus. Following are some choice cherries found in the report. I hope these will mostly motivate you to read the entire report.

Demand-Pull

Electricity peak demand and energy growth forecasts over the 10-year assessment period are higher than at any point in the past decade. The aggregated assessment area summer peak demand forecast is expected to rise by over 79 GW, and aggregated winter peak demand forecasts are increasing by nearly 91 GW. Furthermore, the growth rates of forecasted peak demand and energy have risen sharply since the 2022 LTRA, reversing a decades-long trend of falling or flat growth rates. (See first chart below).

Supply-Push

The total capacity of traditional baseload generation fuel types will continue to decline as older generators retire and are replaced with new generation that has different capacity characteristics. (See second chart below)… The change in resource mix is gradual. Over this 10- year assessment period, Thermal generation, which consists mainly of natural-gas-fired, coal-fired, nuclear plants, and hydroelectric power are projected to continue providing 85% or more of the BPS on-peak generation capacity… The pace of change in the resource mix is likely to be influenced by the addition of more wind, solar PV, battery resources, and the retirement of more fossil-fired generators.

S&P Global reports, “the assessment found a total power capacity increase of 34 GW over the next 10 years, with most incremental capacity coming from solar, while simultaneously new emissions regulations are likely to prompt further resource retirements.”

Channels

The amount of BPS transmission projects reported to NERC as under construction or in planning for construction over the next 10 years has increased, indicating an overall increase in transmission development. Siting and permitting challenges continue to inflict delays in transmission expansion planning. Regional transmission planning processes are adapting to manage energy transition, but impediments to transmission development remain.

S&P Global reports, “Olson (a NERC official) also stressed the importance of expanding the nation’s electric transmission capacity. To that end, NERC has been tasked with conducting a two-year study on the need for more interregional transfer capability with a final report due to the Federal Energy Regulatory Commission by December 2024… As new resources are often in different places than current resources and load behaviors are changing, it’s important that the transmission network is able to adequately serve needs.”

UtilityDive offers a stark summary for a very nuanced report, “Rising peak demand and the planned retirement of 83 GW of fossil fuel and nuclear generation over the next 10 years creates blackout risks for most of the United States… While most regions should have sufficient electricity supply in normal weather, both the Northeast and Western half of the U.S. face an elevated risk of blackouts in extreme conditions. And parts of the Midwest and central South areas could see power supply shortfalls during normal peak operations.”

Houthis hit flows

According to Bloomberg, “A.P. Moller-Maersk A/S, the world’s second-largest owner of container ships, said in a statement on Friday that it has instructed its vessels heading for the southern entrance of the Red Sea to pause their voyages. Its vessel Maersk Gibraltar was attacked. Shortly after Maersk’s announcement, Germany’s Hapag-Lloyd AG announced a halt until Monday…” (More and more.) According to S&P Global these two shipping firms account for a bit more than 21 percent of global container flows. Significant oil and LNG shipments follow the same route. S&P Global also reports, “The Bab al-Mandeb, which lies between the Horn of Africa and the Middle East with a narrow width of 20-mile, connects the Red Sea to the Gulf of Aden and the Arabian Sea. It accounted for 8.8 million b/d of total oil flows in the first half of 2023, according to the US Energy Information Administration. LNG flows through the strait were 4.1 billion cf/d during the same period, EIA data showed.”

December 18 Update: Several more carriers have announced they will avoid the Bab al-Mandeb — and therefore the Suez Canal. Here and here and here. Late Afternoon: Bloomberg reports, “From BP Plc to A.P. Moller-Maersk A/S, companies that transport consumer goods, commodities like coal and corn, and energy supplies face longer journeys. While there’s some slack in global supply lines to absorb the recent capacity strains, the sudden closure of the Suez Canal in 2021 showed how fragile networks are when major links break down.” Reuters reports, “The disruptions would likely affect supply of consumer goods ahead of the Chinese new year in particular, with delays leaving retailers with unsellable stock and ultimately driving up prices for consumers, said Marco Forgione, director general at the Institute of Export and International Trade.” S&P Global reports, “The US is seeking a regional coalition to secure Red Sea navigation, with a summit to be convened virtually Dec. 19, as a series of vessel attacks launched by Iranian-backed Houthi militia in Yemen has already prompted BP and several shipping companies to reroute cargoes.”

Risks associated with Bab al-Mandeb disruptions are amplified by continuing constraints at the Panama Canal.

December 21 Update: S&P Global Reports, “Although selling economics in the recent weeks for LNG was incentivizing supplementary cargoes to move from the Pacific to the Atlantic, heightened global tensions amid the attacks in the Red Sea have subdued redirecting cargoes between basins. Additionally, constraints with the Panama Canal has further worsened trading between basins and market participants battle the uncertainty in both the Panama and Suez canals… With traders now keeping cargoes within their respective basins, and demand still lagging behind, vessel availability has improved significantly since last month. While the number of available spot vessels in the Atlantic was steady week on week, it has nearly tripled since the end of last month till now. In the Pacific, vessel availability has risen slightly on the week and has nearly doubled since the end of November.” (More and more and more.)

December 22 Update: FreightWaves reports, “Current fallout from the Red Sea crisis is focused much more on container shipping than other vessel segments. Virtually all container vessels are rerouting around the Cape of Good Hope. Container ships that had already transited southbound through the Suez but had yet to reach the Bab-el-Mandeb Strait are now turning back, paying another toll to get to the Mediterranean. Numerous bulk commodity ships are heading to the Cape, as well, but not to the extent container ships are. That could change with a military escalation, which could increase reroutings across all shipping sectors.”

Bab al-Mandab strait into and out of the Red Sea (and Suez Canal)

Maritime shipping routes and their main destinations (Heinrich-Böll-Stiftung European Union)

Sales stay strong

Many media — even financial media — were surprised by yesterday’s November US retail sales report. The FT headlined, “US sales rise unexpectedly in November“. Bloomberg was forward leaning, “US retail sales unexpectedly rise in solid start for the holidays“. The Wall Street Journal more narrowly noted economists were surprised. Given Tuesday’s CPI and big sales reported for Black Friday (and related), I’m not sure why the rather modest retail sales growth surprised anyone (see chart below).

The Census Bureau summarized: “Retail trade sales were up 0.1 percent (±0.5 percent)* from October 2023, and up 3.1 percent (±0.5 percent) above last year. Nonstore retailers were up 10.6 percent (±1.6 percent) from last year, while food services and drinking places were up 11.3 percent (±2.3 percent) from November 2022.”

Despite progress, inflation reinforces nominal retail outcomes. Employment has recovered. Real-earnings are consistent with pre-pandemic patterns. Consumers have “plenty of dry powder“, It is the season of gift-giving. Pull remains persistent. Supply chain push continues well-aligned with current pull.

Gaza: The Push Needed

Since 2007 supply chains serving the 2.2 million-plus residents of the Gaza Strip have been constrained by complications imposed by neighboring states. Increasing poverty related to these complications has further suppressed demand and supply. Since early October military operations in Gaza have destroyed critical infrastructure including many supply chain nodes and links. Resupply has been shut down for extended periods (more and more). Evacuations have been tightly controlled (more and more).

Prior to the last eight weeks of destruction and constant disruption, Gaza demand and supply networks experienced much more friction than is found in the high volume, high velocity scale-free flows typically the focus of Supply Chain Resilience. Redundant clustering within Gaza’s hyper-local network featured much higher inventories-per-capita than is typical of US, EU, or supply chains in most advanced economies. These stocks are now mostly drained (after lasting longer than I expected).

According to a 2022 United Nations report, roughly 80 percent of Gaza residents depended on humanitarian food assistance before the recent hostilities. Despite extensive international relief operations, over sixty percent of Gaza residents were already food insecure before the blockade was further tightened and bombing began. Given these conditions, supply chains serving Gaza have long been much more push-oriented than pull-oriented. The World Food Program estimates that only about one-third of food sector capacity has been market-oriented. Potentially surviving market-oriented pull has recently been disrupted by a dwindling supply of currency. After eight weeks of hostilities, the expression of effectual demand is increasingly limited to crowds of hungry, frightened people assembling where they perceive food might be available (here and here and here).

These places do not have enough food available to supply current demand. In recent years approximately 8000 to 10,000 trucks per month have supplied Gaza’s demand for a wide range of goods (see chart below). In October and November, according to the World Food Program, “3,099 trucks, of which 1,249 carrying food assistance have reached Gaza.” Extensive efforts are underway to ensure “continuous and sustained flow of humanitarian aid into Gaza” (here and here and here), but current food flows are barely half that minimally needed for a large population with fewer and fewer options (here and here and here).

Life-sustaining needs exceed current supply. Sufficient supplies are available, but the necessary push is constrained by purposeful policy, severe structural complications, and constant confusion caused by the toxic fog of war. With prior food stocks now mostly exhausted the current catastrophe is fast turning toward mass starvation.

""

December 10 Update: A reader asks, “Eight weeks in what has changed on the ground or in your mind to prompt “the current catastrophe is fast turning toward mass starvation”? My response: the inventory calculus has changed. Demand volume has remained roughly constant. Demand direction — pull — has shifted considerably because of population displacements. Velocity of supply has been reduced by at least three-quarters volume and direction/discharge has become even more detached from pull signals. This has resulted in a sustained drain of “buffer stocks” held by individuals and institutions. The second derivative — acceleration of resupply — is not (yet?) showing any sustained improvement. I am aware of several efforts to increase acceleration, but I am not yet seeing consistent throughputs. Especially given detached pull signals, supply velocity may actually be deaccelerating. The third derivative — rate of change in (de)acceleration — is outside the scope of evidence available to me. But given reports of intense military operations across the demand-supply matrix, I am pessimistic. Given this calculus, the arithmetic on my conceptual inventory spreadsheet is rapidly approaching zero or negative. I am confident zero is already the reality for many people inside Gaza. As food inventory numbers tack toward zero for more than 2.2 million people the approaching phase transition is unpredictable but predisposed to extremes. In similar cases, we usually see incremental movement of demand (hungry people) to mitigate mass starvation (and reduce demand velocity). Significant efforts (and ability) to restrict such movement increases the likelihood of mass starvation. This week? Next week? I don’t have sufficient evidence to support that sort of precision.

Additional December 10 Update: NBC News provides an overview of the current situation on the ground in Gaza (includes related video). It mostly reflects what was outlined here on December 9. There is also a link to a Friday statement by a WFP official who had just completed a site visit to Gaza. Here is an excerpt, “With law and order breaking down, any meaningful humanitarian operation is impossible.  With just a fraction of the needed food supplies coming in, a fatal absence of fuel, interruptions to communications systems and no security for our staff or for the people we serve at food distributions, we cannot do our job… A WFP survey taken during the pause in hostilities, showed that Gazans are simply not eating. Nine out of ten families in some areas spent a full day and night without any food at all. When asked how often this happened, they told us that for up to 10 days in the past month, they had not eaten food.”

December 11 Update: At midnight on Monday morning (US Eastern Time), the Financial Times posted a new report headlined: ‘Catastrophic’ conditions in Rafah as Palestinians reach the end of the line. More evidence, a bit more detail, no new substantive angle, no promising developments… quite the opposite.

A reader notes that, as outlined in my original post’s links, the WFP LogCluster “is following the Red Cross lead.” The reader requested I make available the following links related to the Palestine Red Crescent Society.

PRCS Overview of its response from October 7 to December 4
The ReliefWeb “feed” for PRCS activity

Another reader who is directly involved in logistical support to humanitarian relief organizations in the region writes, “We’re assuming that there’s 0 functioning infrastructure available to frontline groups in Gaza.  Anything that’s not already destroyed risks becoming a target, so we’re planning for field conditions.  Advocacy to push for the evacuation of critically at-risk / injured people will be important, but if the war continues for much longer, “critically at-risk” will soon include the entire population of Gaza.”

Early December 12 Update: A second channel for security checks of relief supplies has been announced. Additional security check-points are scheduled to open today at the Kerem Shalom crossing and near-by Nitzana, increasing potential velocity and volumes. But, according to I24 news, any cargo approved at Nitzana or Kerem Shalom will then be routed through the same Rafah Crossing currently being used for discharge into Gaza (Kerem Shalom is less than two miles from the Rafah Crossing). To the extent delays for security checks at Rafah (and preexisting checks at Nitzana) have been a significant constraint on throughput, these additional security check-points could help. It is, however, my impression that goods movement beyond the Rafah Crossing has been the most serious constraint in recent weeks. Destruction of the Gaza transportation network, ongoing military operations, and lack of information/coordination are slowing or stopping trucks on the Gaza side of the Rafah Crossing and seriously complicating deliveries further into Gaza . Unless the discharge point allows for continued movement, more volume at a single threshold will increase congestion and exacerbate delays (more and more ). According to a Reuters December 12 report, “… limited aid distributions were taking place in the Rafah district, but “in the rest of the Gaza Strip, aid distribution has largely stopped over the past few days, due to the intensity of hostilities and restrictions of movement along the main roads”. Aid flows were also restricted by a shortage of trucks in Gaza, a continuing lack of fuel, communications blackouts, and growing numbers of staff unable to travel to the Rafah crossing with Egypt because of the intensity of hostilities…” (More)

Late December 12 Update: An official with the Palestine Red Crescent Society has told Reuters the new inspection process at Kerem Shalom did get underway today with 80 trucks from Egypt.

Early December 13 Update: The United States government has increased public pressure for the Kerem Shalom check-point to be reopened for truck movement directly into Gaza. Yesterday Jake Sullivan, the President’s National Security Advisor, said, “We need the capacity that Kerem Shalom provides — on an emergency basis — to get more food, water, medicine and essentials in to be distributed to Palestinian civilians, and we’re putting that quite urgently to the Israeli government to say we are asking you to do this ASAP because of the nature of the humanitarian situation on the ground.” This is a shift from two weeks ago. Sullivan and US Defense Secretary Lloyd Austin will depart for face-to-face talks in Israel yet this week. (More and more and more) [CORRECTION: Austin did not accompany Sullivan. Austin will be in the region during the third week in December.]

December 15 Morning Update: According to I24 News, “Israel will now permit trucks to briefly unload goods at the Kerem Shalom crossing on the Gaza side.” This is the first written confirmation that I have seen. I am otherwise hearing that Kerem Shalom is understood by “all parties” as essential to reestablishing minimum-necessary “flows to support Gaza residents.” There is some (loose?) talk of drop-and-go staging inside the Gaza border proximate to the Kerem Shalom crossing. I am not hearing, much less seeing, credible explanations of how what is dropped can be effectively distributed across the demand matrix (see prior note on congestion and here). But getting more trucks — more inbound volume — inside is a necessary and helpful first step. [Reuters and others (here and here) are confirming.]

December 16 Update: The Times of Israel provides an update and review of the “reopening” of the Kerem Shalom crossing.

Before October 7 Kerem Shalom was designed and operated as the principal freight point of entry for Gaza. The site includes roads, security, parking, and staging infrastructure to facilitate well over 7000 trucks per month (mostly food and construction materials). The current reopening anticipates up to 6000 trucks per month being allowed. Restarting flow by unleashing this preexisting capacity is essential. These volumes are fundamental to preventing mass starvation in Gaza. But as every supply chain geek reading this realizes, increased volume requires calibrated velocity or flow will quickly slow and eventually stop as congestion builds. Increasing “outbound” speed and effectively aiming the direction of flow to those surviving in Gaza is now the priority. Kerem Shalom can be translated as “peaceful orchard” or “peaceful vineyard”. If Kerem Shalom is the root, we need its branches and vines to rapidly grow and spread.

December 17 Update: According to several media outlets (most quoting unnamed Egyptian Red Crescent officials) earlier today seventy-nine truckloads of emergency supplies crossed through the Kerem Shalom Crossing into Gaza. According to Reuters, “The aid may not quickly reach those in need. Colonel Elad Goren, head of the civil department at COGAT, told Reuters humanitarian agencies had not increased their capacity to distribute aid to meet the demand from the influx of Gazans who have fled to the south of the enclave on Israeli advice.” (More and more and more.)

December 21 Update: When direct flows from Kerem Shalom into Gaza proper were permitted again on December 16, the turmoil inside Gaza was amplified by a communications blackout (more). This further complicated movement and delivery of supplies within Gaza. As noted in the chart immediately below, the volume of supplies discharged seriously slowed. Many communications networks resumed operations on December 17-18 and volumes recovered — for the first time since October 7 supplemented by entries at Kerem Shalom. On December 18 sixty-four truckloads entered at Kerem Shalom, another sixty on December 19, and another seventy-five yesterday (including a 40 truck convoy from Jordan). I have not, however, been able to confirm if and how the supplies at Kerem Shalom are being further distributed. Recent reports from the Palestine Red Crescent Society have not updated truckload reports since December 16. There have been several media reports regarding disrupted distribution at the Rafah Crossing (here and here). I am receiving contradictory reports on the status of truckloads after entry at Kerem Shalom. As noted — foot-stomped — above, volume is just about useless without velocity meaningfully targeted toward demand. Reuters reports, “Hunger has become the most pressing of the myriad problems facing hundreds of thousands of displaced Gaza Palestinians, with aid trucks able to bring in only a small fraction of what is needed, and distribution uneven due to the chaos of war. Some trucks have been stopped and looted by people desperate for food, while swathes of the devastated territory are beyond their reach because access roads are active battlegrounds.”

December 22 Update: Only eighty-eight supply trucks entered Gaza on December 21. Yesterday a new analysis of food insecurity in Gaza reported, “Around 85% of the population (1.9M people) is displaced, with many people having relocated multiple times, and currently concentrated into an increasingly smaller geographic area. There is a risk of Famine and it is increasing each day that the current situation of intense hostilities and restricted humanitarian access persists or worsens.” (More and more and more and more.)]

December 24 Update: Only forty-nine supply trucks entered Gaza on Friday, December 22. According to COGAT, “In line with the agreement made with the UN, the Kerem Shalom and Nitzana crossings are closed on Saturdays. This measure is to facilitate the UN’s distribution of accumulated goods on the Gazan side of Kerem Shalom and the reception of goods on the Egyptian side of Rafah” On Sunday, December 24 COGAT reported, “113 trucks were inspected and transferred to the Gaza Strip via the Rafah crossing. In coordination with the UN, no trucks were inspected at the Kerem Shalom crossing, due to logistic constraints on the Gazan side of the crossing.” (More and more.)

December 26 Update: According to COGAT, yesterday, December 25, the number of truckloads discharged in to Gaza finally exceeded two-hundred. The 218 truckloads received on Christmas Day is the first time since December 17 this minimum-necessary benchmark has been achieved. But only 83 truckloads were discharged today. Regardless of volumes discharged into Gaza, I am receiving no evidence of improved distribution inside Gaza. Push is entirely insufficient. Push is also almost entirely detached from pull. The PRCS has resumed posting updates.

January 2 Update: I have a new post on the current situation at https://supplychainresilience.org/bad-start-for-new-year/

I will discontinue updates to this post. Future updates will be updated to this new post or future new posts.

+++

Supply Chain Resilience acknowledges that contemporary high volume, high velocity flows of essential human resources serving large populations cannot be replaced, even by the most robust and best-organized relief operations. The only effective and timely way to serve large numbers of survivors is rapid restoration and adaptation of preexisting flows. The current situation in Gaza may be the exception that proves the rule. For sixteen years a huge, dense population has depended on robust, well-organized “relief” operations. Sixteen years of relief operations should have signaled an unsustainable situation requiring fundamental reform. But in the very present crisis, this humanitarian supply chain is the only “preexisting capacity” that has the irreplaceable ability to serve survivors.

Gas tanks are almost full

The cold has started. EU residential demand for natural gas has increased. But Europe’s natural gas inventories and inbound flows are good. Storage remains over 90 percent full (more). According to S&P Global, “Norway’s pipeline gas exports to Continental Europe and the UK rose to a 10-month high in November, with supplies now running consistently close to capacity…” US natural gas output (see chart below), including LNG exports to Europe, are flirting with record-breaking territory (more and more). Prices are subdued (see chart below and more). Bloomberg offers, “Fears of shortages in Europe and Northeast Asia have all but disappeared. Weak industrial demand, particularly in China and Germany, and continued increases in fuel supply, are the main reasons for the lack of alarm.”

+++

December 11 Update: Nice round-up of Atlantic-area LNG market from S&P Global opening with, “Lacking seasonal support from the heating sector and ample availability of supply weighed on the global LNG market during the week ended Dec. 8, with sources still awaiting a demand catalyst to reignite activity.”

Catalyst becomes chokepoint

Bloomberg comments, “For more than a century, the Panama Canal has been a catalyst for consumer goods and raw materials flowing between the Americas, Asia and beyond. Thanks to climate change, it’s now a chokepoint.”

This blog has been watching as reduced water-levels have increasingly constrained daily canal throughput (here and here and here). An increasing number of ocean carriers are rerouting to avoid the Panama Canal altogether (here and here).

Suez would usually be next in line for East Asia to the US East Coast (or reverse). But recent Houthi attacks on Red Sea shipping requires comparing drought to drones to Cape of Good Hope gales.

No near-term improvement of Panama Canal flows are likely. December is the start of Central America’s dry season extending through April

December 7 Update: Splash247 reports, “The transit backlog at the interoceanic waterway today numbers just 77 ships, 13 below the average since the 2016 expansion of the locks, and down by more than 50 vessels in the space of just a fortnight. For those in the queue, however, wait times are long, especially for ships waiting for a northbound convoy where average wait times topped out at over 15 days earlier this week and currently stand at 14.5 days.”

+++

December 9 Update: The Financial Times reports, “Simultaneous disruption in the Panama and Suez canals, two vital corridors for global trade, is threatening global supply chains in the run-up to Christmas. Shipowners and importers have warned that a drought in the Panama Canal and a spate of attacks on cargo vessels 11,500km away near the Suez Canal risk constraining traffic ahead of the festive season.” The report also provides a helpful outline of the dilemmas involved in this dual disruption.