Every four to five weeks I update the following indicators. Here are the June and May updates. These are not comprehensive indicators. For comprehensive please see other sources, such as the Global Supply Chain Pressure Index or the Logistics Managers Index. But combined with more comprehensive measures, these five factors give me a finer sense of overall flow capacity, current discharge, and emerging conditions.
North American Agricultural Production: On July 14 the USDA reported mostly robust conditions, “The 2023/24 U.S. feed grains supply forecast is raised to 444 million metric tons this month, up 0.9 million tons—as increased acreage for corn, sorghum, and barley raised production by 2.4million tons. Yield reductions in corn, barley, and oats tempered greater supply growth. Beginning stocks are down 1.5 million tons to 38 million. Supply is projected at 46 million tons above the last marketing year. Projected feed grain use is raised slightly to 384 million tons. Ending stocks are projected at 190 million tons, down slightly from last month but 22 million tons higher than 2022/23.” Early July rains have, for now, reduced concerns about US harvests. Recent rains in Alberta and Manitoba improved crop conditions. But drought persists in Saskatchewan, Canada’s largest grain producer. A second year of drought (more) and extreme heat is seriously impacting Mexico’s agriculture and human hydration (more). Monday’s cancelation of the agreement facilitating grain shipments from Ukraine through the Black Sea will reduce global supplies and support higher-than-otherwise prices (more and more). [July 20 Update: global wheat prices soar on warning that Russia has mined Ukrainian grain ports.]
Global Natural Gas Demand and Supply: Extreme, sustained heat in North America, Europe, and Asia (more and more) has prompted record-setting electric generation — and increased the electric utility sector’s demand for natural gas. But manufacturing sector demand, especially in Europe and China, remains comparatively low. As a result, front-month European futures prices for natural gas are well below last year’s very strong pull (see chart below). But Tsvetana Paraskova warns longer-term price behavior is beyond confident prediction, “Volatility… will continue as prices and demand ahead of and during the coming winter will depend on two factors that are out of EU control—the weather and the contribution of renewable energy sources to the mix depending on the weather.” For a mind-bending bit on possible natural gas supply dynamics, please see this July 10 post.
China Export Volumes and Value: Reuters reports, “Outbound shipments from the world’s second-largest economy slumped a worse-than-expected 12.4% year-on-year in June, data from China’s Customs Bureau showed… following a drop of 7.5% in May. Related, China’s GDP growth decelerated significantly during the second quarter ending June 30. According to the New York Times, “output was only 0.8 percent higher in the second quarter than the first quarter. When projected out for an entire year, that is a growth rate of a little over 3 percent a year, down from about 9 percent in the first quarter.” The South China Morning Post headlined, “Recovery is going from Bad to Worse” (until the headline was edited). In any case, global demand has slowed, as a result China’s — still enormous outbound flows — are not growing nearly as fast as in the past. (More and more.)
North American Grid Capacity: North American grids — and plenty of others — are undergoing a significant transition. This transition will be especially intense over the next decade (here and here). Part of this transition is to better network current grids so that each can share the strength of all. The sometimes treacherous nature of this transition is exemplified by what happened in Texas during Winter Storm Uri and other grids on Christmas Eve last year (more and more). I was expecting this summer to challenge the grid. It certainly has (here and here and here). But, so far, the North American grid has met this challenge. Capacity has been sufficient to meet several record-demand days, especially when grid operators have not been stingy with their demand projections.
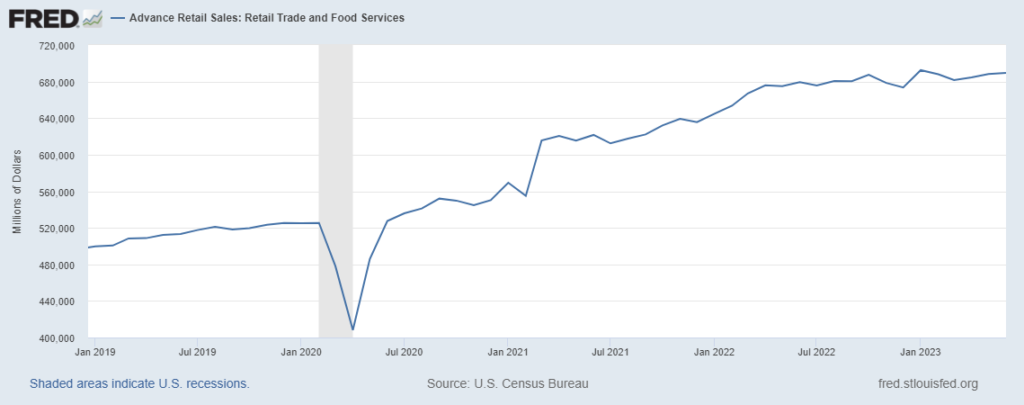
US Personal Consumption Expenditures: The May PCE suggested real (inflation adjusted) expenditure growth to be flattening (more). Yesterday’s report on retail sales indicate this behavior mostly persisted in June (see second chart below). According to Bloomberg, “The value of retail purchases rose 0.2% in June after an upwardly revised 0.5% increase in May, Commerce Department data showed Tuesday. The figures aren’t adjusted for inflation… Sales increased in seven out of 13 retail categories last month, including advances at non-store retailers, electronics stores and furniture outlets. The value of purchases at building materials stores, gas stations and grocery stores declined.”
Audacious (foolish?) generalization: With notable and deeply unfortunate exceptions, global capacity for effectual demand is significant. Compared to some prior periods, the rate of demand growth has moderated. The current level of demand is mostly being fulfilled… and prices for fundamentals (e.g., food and fuel) have fallen back from much higher 2022 patterns. Because the growth-rate is modest, supply capacity is well-adapted and mostly well-matched with demand capacity and even demand velocity. Risks to this equilibrium may be emerging, but as a general rule are not the predominant feature of mid-July high volume, high velocity supply chains.

+++
July 25 Update: S&P Global has a helpful roundup of US refined product exports, “US refineries are finishing their ramp-up to full rates following a heavier-than-normal maintenance season, eclipsing restarts from around the globe. With ongoing refinery downtime in other regions like Latin America and Asia expected to continue through August, export demand for US refined products is expected to stay robust.”