At the end of November, according the the Global Supply Chain Pressure Index, pull and push were about as balanced as at any time this century. See chart below. Two US-focused measures — the Cass Freight Index and the Logistics Managers Index — can be read (without too much distortion) as coherent with the GSCPI signals.
This balance is never universal or problem-free. There is always friction. Small differences in friction can be decisive to flows. Acceleration or deacceleration and related reaction functions persist, especially at higher scales. Most readers live in places where these dynamics can quickly display dramatic changes — as seen between March 2020 and late 2022.
For the last two years this blog has supplemented GSCPI, LMI, and other more comprehensive measures with monthly snap-shots focused on demand velocity, food volumes, energy supplies, and transnational trade (for example, here and here). I have tried to cherry-pick some sector-specific data to confirm, clarify, or correct the big picture indices.
This monthly discipline has underlined the power of effectual demand. The reaction function related to EU natural gas demand and supply has been fascinating — and mostly very encouraging (see here and here). Similar behavior at somewhat slower speed has been observed in agricultural, other energy, and many other markets.
Despite wars, rumors of war, famines, earthquakes, cyclones, drought, floods, prospect of plague, and other troubles, flows ebb and rise in response to demand. There have been awful exceptions. But even these exceptions have seemed to prove the rule: pull attracts push. To be explicit: need alone does not pull. Push is attracted to credible promises of value greater than value delivered.
Downstream demand attracts upstream supply. Here is how this dynamic is described by the authors of the November LMI:
Downstream respondents… are still seeing some growth. Inventory is contracting slower Downstream (48.8 to 40.8). Downstream firms are seeing Warehousing Utilization growing at a significantly faster rate (59.8 to 48.4), Transportation Price is holding steady rather than contracting (50.0 to 41.5) and Transportation Utilization expanding rather than contracting (55.1 to 47.9). Taken altogether, this suggests that inventories were pushed towards consumers, and last-mile deliveries are ongoing, leading to the higher levels of Transportation Utilization Downstream (despite the higher Transportation Capacity expansion Downstream)… Interestingly, Upstream firms are predicting increases in Inventory Levels going forward, while Downstream is not. If those predictions hold, we may eventually see freight rates increasing Upstream as well as Downstream.
As we move into 2024 I will adjust my monthly snapshot to focus on downstream demand for food, upstream supply of food (more and more), and channels for food delivery. Fuel and other energy costs are important components of food flows, so there will be continuing attention to these elements. I will give much more attention to freight markets (more and more).
This shift is partly motivated by worry. Global food production is enormous and widely distributed. This robust scale lends innate resilience… as does sustained pull. Food production is also seasonal and vulnerable to factors beyond human control. There is evidence of increasing vulnerability. Reuters recently reported,
The El Nino weather phenomenon, which brought dryness to large parts of Asia this year, is forecast to continue in the first half of 2024, putting at risk supplies of rice, wheat, palm oil and other farm products in some of the world’s top agricultural exporters and importers. Traders and officials expect Asian rice production in the first half of 2024 to drop as dry planting conditions and shrinking reservoirs are likely to cut yields… India’s next wheat crop is also being threatened by lack of moisture, which could force the world’s second-largest wheat consumer to seek imports for the first time in six years as domestic inventories at state warehouses have dropped to their lowest in seven years... Come April, farmers in Australia, the world’s No. 2 wheat exporter, could be planting their crop in dry soils, after months of intense heat curbed yields for this year’s crop… “The (wheat) supply situation in the current 2023/24 crop year is likely to deteriorate compared to last season,” Commerzbank wrote in a note.
Serious, sustained, and widespread upstream constraints will increase the amount of pull needed to attract available supplies (this is often called inflation). Drought-like conditions either upstream or downstream (even more if both) will stress channels in between. And as we have recently seen at the Panama Canal, Suez Canal/Red Sea, Mississippi River, and elsewhere, many channels are having their own systemic problems regardless of supply chain pull or push.
In my experience, the best way to manage worry is to improve observations, preparation, and readiness to creatively respond.
Very best wishes for the New Year.

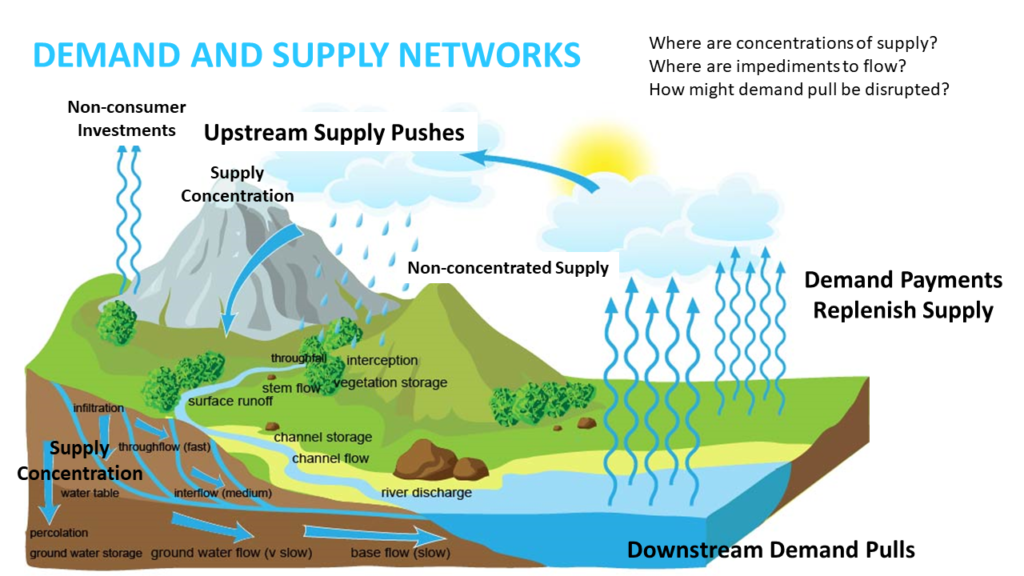
Below is my own mind-map for some key systemic characteristics of demand and supply networks. It works well for me. But I notice it can too often be meaningless — or even misleading — for others. I welcome your critique or questions. I wonder what I have misconceived or how I can more effectively illustrate these dynamics.
