Supply Chain Resilience is especially attentive to wide-area, cross-sector, high volume, high velocity flows. Is there enough flow in the right channels to deliver what is needed when and where it is needed? This is analogous to the human body’s blood pressure being sufficient to feed oxygen and nutrients to our vital organs, but not get so fast and tight as to over-stress the cardiovascular system.
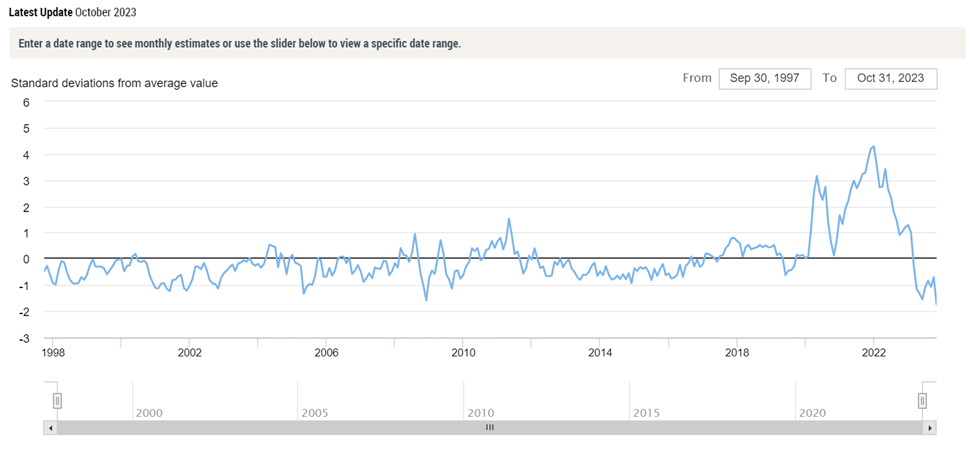
During the worst days of the pandemic, global supply chains were arguably experiencing dangerously high pressure. It was possible to perceive supply chain equivalents of multiple blood-clots emerging simultaneously. The Global Supply Chain Pressure Index tracked that high pressure for most of 2020 through 2022. But we have spent most of 2023 with pressure well-below historical averages. (See first chart below.)
Are we now in danger of hypotension — too-low supply chain pressure? There are some US producers, shippers, carriers, retailers and consumers that have experienced related symptoms. But no, as a whole, current US flow is strong, consistent, even athletic. In many cases pandemic stress has resulted in higher capacity, increased efficiency, and more effective flows.
Below are some current measures that — in combination with the GSCPI, Logistics Manager’s Index, and other more comprehensive efforts — may suggest where our fitness routine is most successful or needs some extra attention.
Agricultural Production: There are places having serious food production problems, such as Argentina, Ukraine, and North Georgia (US) and Wisconsin. But total world production is mostly higher. According to the November World Agricultural Supply and Demand Estimates (WASDE), “The global wheat outlook for 2023/24 is for increased supplies, fractionally lower consumption, less trade, and larger ending stocks… Global coarse grain production for 2023/24 is forecast up 4.8 million tons to 1,499.3 million… The 2023/24 global rice outlook this month is for higher supplies, consumption, trade, and nearly unchanged stocks… The global 2023/24 soybean supply and demand forecast includes lower beginning stocks, higher production, higher crush, and lower ending stocks. Beginning stocks are reduced 1.6 million tons, reflecting offsetting back-year balance sheet revisions for China and Brazil. China’s beginning stocks are reduced on lower soybean imports for 2021/22 and 2022/23 and higher crush for 2022/23. Conversely, Brazil’s beginning stocks are increased on a larger 2022/23 crop of 158 million tons due to higher-than-expected use to date.” Where there is increased supply, prices are — not surprisingly — falling (here and here and here).
Global Natural Gas Demand and Supply: This week Bloomberg reported, “European natural gas traders have started taking fuel out of the region’s record inventories as colder weather settles in, drawing from its buffer against winter supply shocks. Consecutive net withdrawals took place for the first time since April this week, data from Gas Infrastructure Europe show, and may accelerate as parts of Europe face below-normal temperatures over the weekend. For now the withdrawals are marginal, and storage facilities remain over 99% full.” Asia’s demand for natural gas reflects continued economic sluggishness across the region. According to Reuters, Asian “prices have so far failed to get their usual seasonal bump as demand remains relatively subdued and supply is more than adequate, especially from the United States.” US natural gas inventories and production continue to be strong. According to the EIA as of November 15, current domestic stockpiles are at the second-highest end-of-refill-season level experienced during the past five years. US spot prices are two-thirds below fourth-quarter 2022 benchmarks, even though US consumption is slightly above last year. This affordable abundance is not limited to natural gas. Diesel flows have adapted better than many (including me) were worried about last year. The collapse of fossil fuel prices over the last few weeks is unlikely to reverse without severe reductions in supply (not impossible, but…). [November 20 Update: Very helpful round-up of the current Atlantic LNG market from S&P Global.]
China Export Volumes and Value: During October Chinese exports fell 6.4% compared to October 2022 according to China’s General Administration of Customs. This was the sixth month of consecutive declines and reflects a steeper decline than September’s 6.2% reduction (more). It is, however, helpful to differentiate between volumes and value. For example Barron’s reports, “Beijing is selling as much as ever, if not more, volume-wise. It’s the price of exports that’s dropping—8% year over year at the last reading, says Duncan Wrigley, chief China economist at Pantheon Macroeconomics. “China has become a global disinflationary force,” confirms Larry Hu, chief China economist at Macquarie Group. The yuan is partly responsible: It is down 3% against the dollar over the past 12 months.” Given China’s proportion of global flows its current condition is relevant to the health of the whole. A body with a great pulse rate but circulation problems or arthritis in the feet is not likely to do well running a marathon. [November 19 Update: Related commentary by Ruchir Sharma in the Financial Times.]
North American Grid Capacity: Extreme weather is prompting demand spikes that challenge North American (and other) electrical grids. This challenge is compounded where — as in Texas — episodic demand piles-on sustained growth in systemic demand caused by increased population and economic activity (more and more). As recently outlined here, the US grid will face serious threats if — likely when — severe winter weather prompts simultaneous increased demand and disrupted supply. [November 20 Update: The New York Times compares US sources electricity generation with that of other nations.]
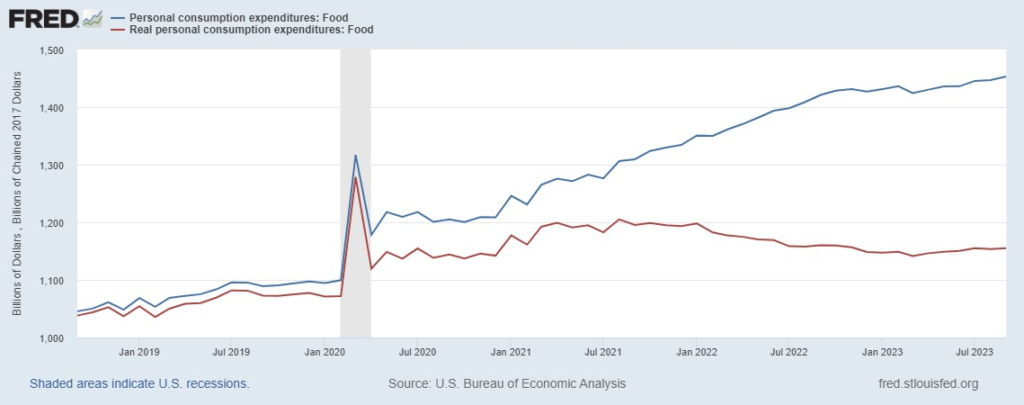
US Personal Consumption Expenditures: The US Census Bureau’s method for measuring retail sales is differentiated from how the US Bureau of Economic Analysis calculates Personal Consumption Expenditures. But a flattening of the growth rate for US retail sales during October will almost certainly be echoed in the October consumption data to be released in a couple of weeks. Slowed growth at the current high levels of demand (see second chart below) is not, however, a systemic threat. The US economy is very active, as such domestic consumer demand has been robust. Food, fuel and most other supplies are flowing as needed without much stress. There are aging edges. There are comparatively weaker bones and muscles. Some extra attention, coaching, even therapy is needed. But right now the overall flow between demand and supply is about as healthy as a body this mature and this big can usually get.
GLOBAL SUPPLY CHAIN PRESSURE INDEX (Federal Reserve Bank of New York)