Month: January 2024

Persistent PCE Pull

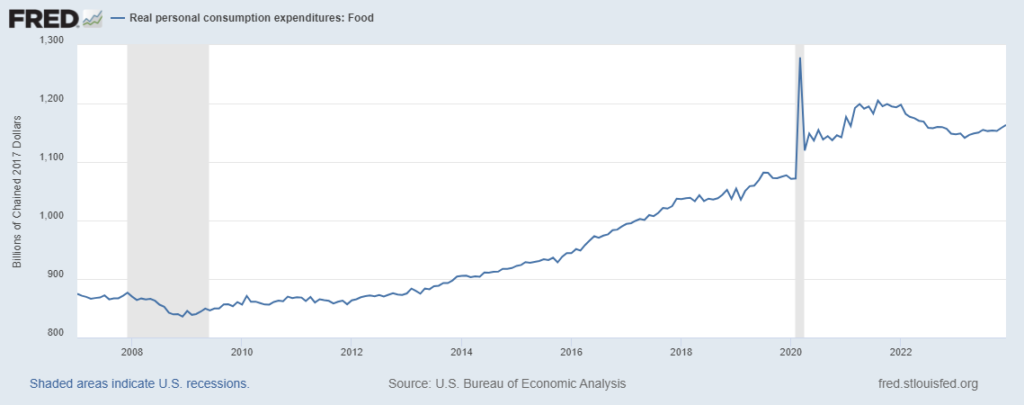
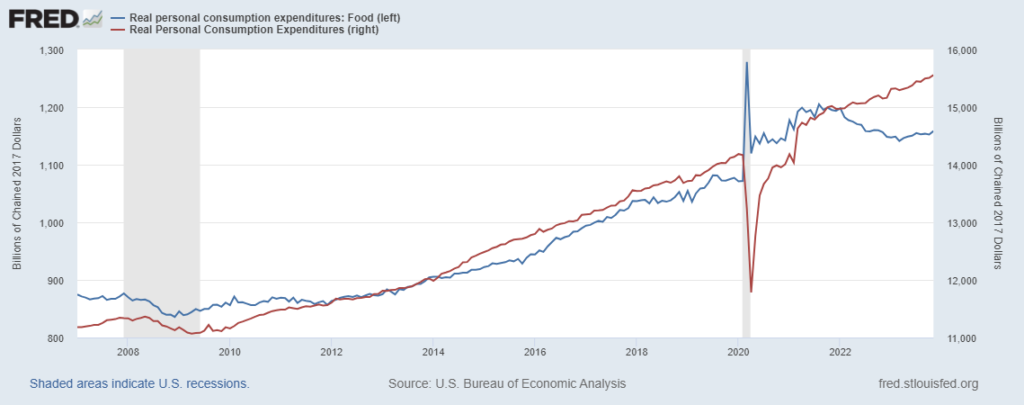
Supply chains perceive demand. Supply chains are pulled by demand. Contemporary supply chains organize, size, and time push toward demand. One way to estimate pull in US supply chains is real (inflation-adjusted) Personal Consumption Expenditures (here and here). The chart below provides an overview of pull patterns since 2007 (figured with constant 2017 dollars).

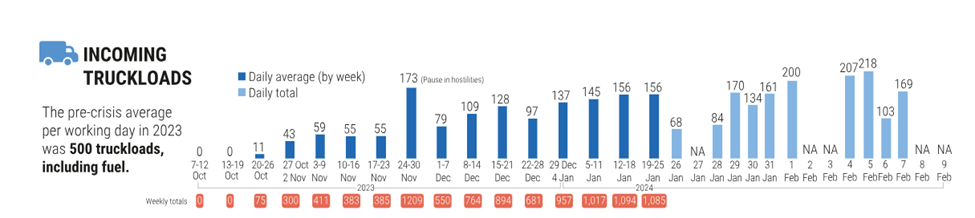
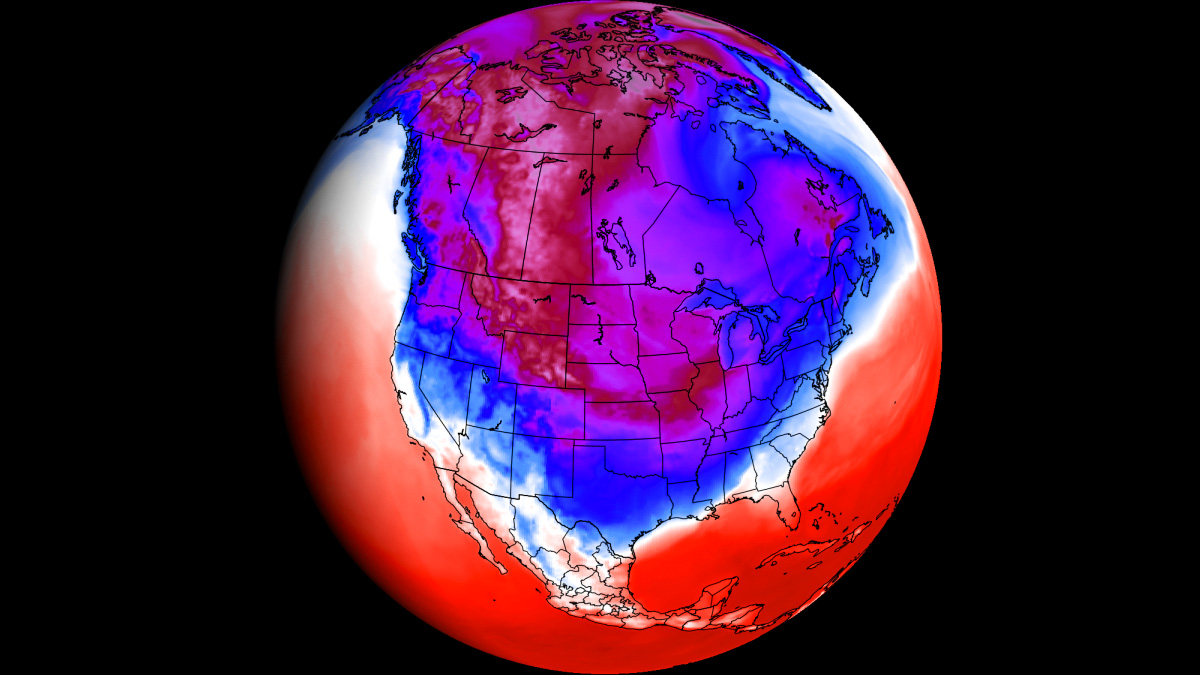
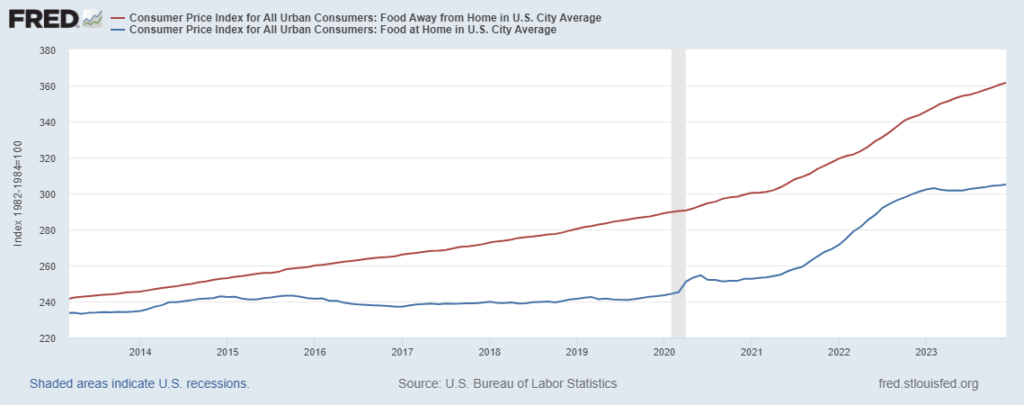
The dramatic variations in pull tracked from March 2020 until, let’s say, May 2022 help explain why push did not always fulfill demand back then. The boring consistency of expenditure on goods (real, physical stuff) since March 2021 suggests when (and why) the US supply chain “crisis” ended. That trembly but nearly straight red line also suggests why so many freight carriers are feeling trapped in a snowy, cold, redux of Groundhog Day (here and here) — without the laughs or romantic fizz of Bill Murray and Andie MacDowell. (But some see early signs of spring.) The second chart below reflects one important component of non-durable goods. In my judgment the slow but steady increase in demand for Food-At-Home is a healthy signal for Supply Chain equilibrium and potential resilience.

With average US wages increasing (here and here) and US consumption expenditures increasing even more (here and here and here) the current rough equilibrium between pull and push is likely to persist. As one freight market researcher recently commented, “Truckload spot rates are 12% above the seasonal pattern in January following the cold snap. While weather effects should revert in the coming months, freight is an outdoor sport, so the cycle will likely find a higher trajectory as the reversion happens amid tightening capacity and recovering demand.” [Or as Bill Murray said, Winter slumbering in the open air, wears on his smiling face a dream of Spring (and here)!]

Deadly Network Friction

According to an update from COGAT, the Israel Defense Forces unit coordinating access to Gaza, 227 humanitarian aid trucks were inspected and transferred to the Gaza Strip on January 15. “This is the highest number of aid trucks being transferred to Gaza in one day since the start of the war. 111 trucks were inspected at Nitzan crossing and transferred to the Gaza strip via the Rafah crossing. 116 trucks were inspected and transferred via Kerem Shalom.” According to the the UN Office for the Coordination of Humanitarian Affairs (OCHA), “On 18 and 19 January, 288 truckloads with food, medicine and other supplies entered the Gaza Strip through Rafah and Kerem Shalom crossings.”

Last week there was more volume discharged into Gaza than most weeks since November’s temporary cease-fire (here). This is, however, less than half the freight volume that Gazans consumed prior to October 7. Below is a chart by a United Nations agency that reports a similar pattern but with different — reduced — numbers. The number of truckloads discharged into Gaza is often inconsistent between reporting agencies and even by the same reporting agency. What is counted, how it is counted, and when it is counted is not well-calibrated. After 100-days plus of war, private stocks and commercial flows are now much reduced. How much is impossible to carefully measure. Eighty percent or more is a reasonable guess.

Early Sunday morning, January 21, the Financial Times reports: “Gaza’s population has become almost completely reliant on external aid brought in via the only two entry points — Rafah on the border with Egypt and Kerem Shalom on the Israeli border. The enclave’s commercial farms have been damaged in the war and are largely out of commission. The aid, which includes flour, oil, rice, legumes and canned foods, is mainly delivered to UN warehouses for distribution to shelters and elsewhere, and people have to queue, sometimes for hours, to get food.” (More and more and more.) Here’s my from-a-distance angle on food-related supply chain implications:

Upstream Capacity of Food Flows (Gaza inbound potential): There is significant preexisting capacity from Port Said (Egypt), about 107 miles west of Rafah (more and more and more). Recently as many as 500 aid trucks were waiting at Port Said. Another 3000 have been reported at al-Arish, less than thirty miles west of Rafah. The trucks at al-Arish have mostly arrived from Port Said or farther west. (According to LogCluster al-Arish currently has ship off-loading capacity for only 25 to 30 truckloads per day.) Efforts are underway to open a “Jordanian Corridor” for trucks from Amman (less than 100 miles to Gaza) or Aqaba (about 130 miles to Gaza). Pilot deliveries have taken place. Scaling up has been delayed for reasons not clear to me. Despite recent transportation improvements in the Taba-Arish corridor (160 miles one way), I have not been able to find any effort to surge maritime-to-rail intermodal flows (and such surge may not be needed given current flow congestion closer to Gaza). Egyptian regulatory and related impediments are non-trivial, but workable. There is the prospect of an additional crossing into Gaza being opened near Ashdod, Israel (more) to facilitate the resupply of flour through Ashdod’s seaport (about 30 miles north of Gaza). In any case, there is already plenty of food ready to be delivered into Gaza. Upstream capacity is not a serious constraint to feeding Gazans.

Midstream Capacity of Food Flows (Rafah and Kerem Shalom crossings): Daily food for more than 2.2 million people currently moves through two “gateways” at Kerem Shalom and Nitzan, where goods carried on 100 to 200-plus trucks per day are inspected before being discharged into Gaza through Rafah. The inspection protocols are rigorous and time-consuming. Here is a summary per LogCluster for truckloads arriving at Kerem Shalom: “Goods arrive from Egypt on Egyptian trucks at the Kerem Shalom checkpoint. These trucks then enter into large walled compounds/rooms where they are offloaded. Once the goods have been offloaded, they are scanned by COGAT using different means. At this point, the goods are inside Israel. Egyptian trucks then return to Egypt. After scanning is complete, the goods are moved from the scanning rooms in Israel into Palestine using sterilized trucks. Once the goods cross to the yards on the Palestine side, they are offloaded again, and the sterilized trucks go back to the scanning rooms to pick up more cargo. Goods from the yards (which are about 2.2 km from the Rafah Transshipment Point) are then brought to the Rafah Transshipment Point using another set of trucks. The goods are offloaded at the Rafah Transshipment Point then loaded onto trucks that will move cargo to various destinations in the Gaza Strip.” Just to restate — with emphasis — while there are two gateways, there is only one truck entrance into Gaza at the Rafah Transshipment Point. Expanded cross-docking facilities at Kerem Shalom are being developed. Additional warehouse space at both Rafah and Kerem Shalom are needed. The current number of cargo “touches” will never facilitate major improvement in velocity, much less result in continuous flow. There have even been situations where Gaza-side recipients request the cessation of inbound freight, mostly at Kerem Shalom, because of the need to decongest received goods at the warehouses. Midstream capacity is seriously rate-limiting for volume and, especially, velocity.

Downstream Capacity of Food Flows (“last mile” inside Gaza): A constantly displaced population and ongoing, intense military operations seriously disrupt, delay, and complicate both pull and push inside Gaza (here and here and here). The government of Israel has asserted that sufficient food is entering Gaza, but not being effectively distributed. Six hour “operational pauses” to allow for transport of food, medical goods, and other aid into specific neighborhoods are announced by the Israel Defense Forces. But deliveries to roughly 300,000 Gazans who still reside in the middle and northern Gaza Strip often fail (many because the IDF disapproves movement requests due to safety concerns). The situation for nearly 2 million in Southern Gaza is not much better. In most neighborhoods designated for an operational pause both delivery routes and receiving facilities are anemic or absent . Since January 12 telecommunications blackouts have seriously complicated tactical coordination. Since October 7 more than 150 United Nations staff involved in relief operations have been killed by military operations in Gaza. There is reluctance to deploy into danger when left logistically deaf and blind. Staged delivery vehicles have been intercepted and emptied by the hungry people in the staging area. There is profound need, but almost no meaningful way of sending pull signals, except by showing up where food might be available. Nothing like a contemporary demand and supply network has survived. Where downstream capacity to deliver relief has survived, it is fragile, fractured, and entirely insufficient.

According to a 2022 United Nations report, roughly 80 percent of Gaza residents depended on humanitarian food assistance before the last three months of hostilities. Despite extensive international relief operations, over sixty percent of Gaza residents were already food insecure before the blockade was further tightened and bombing began. Given these conditions, supply chains serving Gaza have long been much more push-oriented than pull-oriented. The World Food Program estimates that only about one-third of food sector capacity was market-oriented before October 7.

Losing almost all of that preexisting one-third volume has been very difficult. Losing market-oriented velocity and adaptability has been even worse.

On January 18, UNICEF Deputy Executive Director Ted Chaiban said: “Once aid enters the Gaza Strip, our ability to distribute it becomes a matter of life and death. It is essential to lift access restrictions, ensure reliable ground communications, and facilitate the movement of humanitarian supplies to ensure that those who have been without assistance for several days receive much-needed assistance. We have to get commercial traffic flowing in Gaza, so that markets can reopen, and families are less dependent on relief.”

Large-scale, long-term relief operations, such as those operating in Gaza since 2007, tend to be organized around static places and rather stable population requirements. Gaza and Gazans now exemplify the opposite of static or stable. Given current — and anticipated — volume and volatility of demand there is the need for much more systemic flexibility, experimentation, and widely distributed voluntary risk-taking such as more market-oriented behaviors can contribute.

+++

January 28 Update: The recent running average of truckloads received into Gaza is about 168 per day. Once these truckloads enter, they are usually warehoused before being redistributed. According to January 22 meeting minutes, , “The Logistics Cluster conducted a transport assessment in January 2024. Results show that 230 trucks are currently operational in the Gaza Strip. 43 trucks belong to the major transport companies, while others are owned by small companies or individuals. Access to fuel was not reported as an issue currently, as all are able to access it through UNRWA or commercially.” The so-called “Jordanian Corridor” for deliveries into Gaza is getting closer to operational. Two routes have been piloted and are currently anticipated to soon begin recurring operations: 1) Amman – Aqaba – Nuweibaa – Arish – Rafah or Kerem Shalom. WFP and the Logistics Cluster support the coordination, however, partners must provide their own trucks and must be registered in Egypt, following the standard procedures that are used to bring cargos from Arish to Gaza. 2) King Hussein Bridge/Allenby – Nitzana – Kerem Shalom. Organised by WFP and the Logistics Cluster, two convoys are scheduled per week, consisting of 24 trucks each. The Logistics Cluster is advocating to increase the frequency and number of trucks per convoy. WFP has published some detail on its operations in al-Arish to Rafah (more and more and more and more). Minutes of January 25 LogCluster meeting provides more detail on the Jordanian Corridor. A detailed summary of Standard Operating Procedures provides further insight on how potential flow is fractured and slowed.

January 31 Update: The United Nations Relief and Works Agency for Palestinian Refugees (UNRWA) is the principal source of last-mile food deliveries in Gaza. UNRWA personnel and operations in Gaza constitute the principal “preexisting capacity” to feed Gazans before and since October 7. Twelve UNRWA personnel have been credibly accused of participating in the October 7 attack on Israel (here and here and here). According to this morning’s Financial Times, “So far, 15 countries, led by the US, have pulled funding, leaving a $444mn hole in UNRWA’s finances, out of an approximately $1.2bn budget.” (More and more.) Over the last week these issues have added considerable friction to an already wrecked network and threaten an imminent collapse of remaining downstream capacity. Early today the Times of Israel quoted a “senior Israeli official” as saying, “If UNRWA ceases operating on the ground, this could cause a humanitarian catastrophe that would force Israel to halt its fighting against Hamas… This would not be in Israel’s interest and it would not be in the interest of Israel’s allies either.” (More and more and more.) The LogCluster overview for January is available here.

February 5 Update: According to COGAT: “271 trucks carrying humanitarian aid were inspected and transferred to the Gaza Strip yesterday (Feb.4). This marks the highest number of humanitarian aid trucks inspected and transferred in one day since the start of the war. 112 humanitarian aid trucks were inspected at the Nitzana crossing and transferred to the Gaza Strip via the Rafah crossing, and 159 humanitarian aid trucks were inspected and transferred via Kerem Shalom. 180 trucks carried food.”

February 10 Update: Kerem Shalom and Nitzana crossings are closed on Saturdays. On February 9, NBC news reported on the situation in Rafah, “Any attempt to evacuate from the overcrowded city would be neither feasible nor safe, said Andrea De Domenico, who heads the U.N. humanitarian agency responsible for the Palestinian territories. “People are everywhere. This congestion not only makes it difficult for people to move but also hampers any potential evacuation efforts, and humanitarian operations,” she said in a statement from Gaza. Satellite imagery shows the sprawling growth of makeshift shelters and tents that have transformed the enclave’s southernmost city over the past two months.” (More and more and more and more.)

OCHA

The map below reflects conditions prior to October 7. The Gaza Strip is about 25 miles in SW to NE length and roughly 3.5 to 7.5 miles wide.

Big system, big flows, big picture just now

So far, retrospective data and current observations suggest that US demand and supply networks are well-balanced. The Global Supply Chain Pressure Index ended December hovering around its long-term average. The Cass Freight Index is similarly well-behaved if compared to several pre-pandemic year-ends (more and more). The Logistics Managers Index, “moved back into expansion territory in December. This movement back to growth was led by increased activity among the three warehousing metrics. Warehousing Capacity is tighter (-5.5) while Utilization (+7.4) and Prices (+1.2) are both expanding at increasing rates. Inventory Levels continued to decline at a steady pace (although they were breaking even Downstream – likely indicative of JIT practices products selling briskly).” There are credible indicators that strong US consumer demand continues at a less erratic, supply-chain-friendly pace than in recent memory. The December US Personal Consumption Expenditure report is unlikely to dramatically diverge from recent patterns (see second chart below).

Given the global context — featuring economic constraints in China and Europe and expensive chokepoints related to the Suez and Panama canals — benign or better US conditions ought not be taken for granted. How bodes the future?

Last week’s USDA World Agricultural Supply and Demand Estimates projects, “global wheat outlook for 2023/24 is for larger supplies, consumption, trade, and ending stocks compared with last month. Global supplies are raised 3.6 million tons to 1,056.5 million on higher beginning stocks and production. The increase in global beginning stocks is primarily the result of revisions for Ukraine, where beginning stocks are raised 2.2 million tons to 3.5 million on downward revisions to feed and residual use estimates since 2021 /22… Global consumption is raised 1.8 million tons to 796.5 million, mainly on higher feed and residual use for India and the EU.” Corn and other course grains are also expected to be abundant, “Global coarse grain production for 2023/24 is forecast up 11.9 million tons to 1,513.9 million… Global corn stocks, at 325.2 million tons, are up 10.0 million.” Regarding rice: “Supplies are lowered 3.5 million tons to 689.4 million with most of the reduction the result of a lower China production estimate reported by the National Bureau of Statistics. World 2023/24 consumption is lowered 2.9 million tons to 522.1 million, mainly on a reduction for China.” Soybean production is expected to be similar to last year. While production looks good, transportation can be complicated on the Mississippi, in the Black Sea, or through the Panama Canal or Red Sea to Suez. The long-range weather forecast suggests that the Southern Hemisphere’s 2024 harvest season and the Northern Hemisphere’s growing season will unfold into weakening  El Niño affects, with a possible La Niña pattern emerging in September/October/November (more).

US and global petroleum production is strong. Prices have not soared, despite several serious geopolitical challenges. US production is only slightly off record-setting heights (more). Refinery output is robust and consistent with market demand (here and here and here and here). S&P Global reports, “Growing pressure on shipowners to avoid the Red Sea took a toll on European refined product imports in the first half of January… Arrivals from Saudi Arabia, India and Kuwait have already tumbled respectively by 15%, 31% and 43% over Jan. 1-17 from December levels. For Europe, falling import volumes put diesel supplies most at risk. The continent sources about one-third of its diesel supply from the Middle East, and with Insights Global data showing stock levels 257,000 below the five-year average Jan.11, upside risk is significant. Higher imports from the US have provided some buffer. To date 237,000 b/d of diesel/gasoil supply has arrived in Europe from the US in January, down from 246,000 b/d in December but up significantly from an average of 155,000 b/d in 2023…” In a separate report S&P Global explains, “Chinese shipping and trade sources said oil flows into China have not been impacted much by the Red Sea turbulence, as few cargoes were heading to China on that route… On the export front, China’s refined oil primarily heads to the Asia-Pacific region, which implies that Red Sea tensions are having limited impact.”

LNG flows have also been disrupted and delayed by the Houthi’s Red Sea chokepoint. But Reuters reports, “U.S. LNG exports hit a record high of 8.56 million tons in December, according to Kpler, with Europe receiving 5.87 million and Asia 2.2 million, and small volumes heading to the Americas. The United States has the ability to boost shipments to Europe if required, and it may also suit to send less to Asia given the current delays affecting shipping through the Panama Canal, caused by a lack of rain leading to draught restrictions and lower shipping movements. The current situation in the Red Sea has the potential to escalate, but for the moment it’s more of a concern than a factor driving prices.” Indeed, after a brief reaction to the risks of wider war in the Middle East, the European benchmark price for natural gas (now much more dependent on LNG) has continued to fall (see first chart below). On January 8, Javier Blas commented, “Mild weather [in Europe] has induced a massive decrease in gas consumption for heating. That’s on top of greater demand reduction due to energy-intensive companies curbing production. In Germany, for example, output from energy intensive companies, such as chemical plants and metal smelters, is down 20% from before Putin’s invasion of Ukraine. As a result, stockpiles remain well above normal for this time of the winter. Granted, they started the season almost full, compared to the typical 90%. Since then, with consumption lower than normal, they have dropped to about 85%, compared to a 10-year average for early January of about 75%. Under current trends, Europe would reach the spring with more than half its underground gas storage full, versus a 10-year average of just 35%.” Natural Gas takes longer to reach EU pipelines from a different direction, but both supply and price are currently able to support sustained flows.

Where food and fuel can flow, so can much more. Freight carriers are experiencing increased demand for longer sailings, air cargo, and rail delivery (more). Continued friction at Suez and Panama cause increased time-on-task, delayed discharge, and higher costs overall. These factors allow carriers to claim higher rates. So far, higher rates have not substantially reduced demand. UBS Chief Economist Paul Donovan comments, “The additional nine days it takes to ship cargo around the Cape of Good Hope is unlikely to result in shortages, and shipping costs are a tiny part of the price consumers pay for goods.” (More)

But whenever this kind of congestion and rewiring emerges in demand and supply networks, vigilance is valuable (here). Early interventions are helpful to reopen chokepoints, decongest and smooth existing bottlenecks, facilitate alternate routing (important example here), and avoid painful bullwhips prompted by nervous — sometimes insidious — consumers and suppliers. At the start of 2024, I perceive a robust and adaptive global network contending with an amazing array of slings and arrows of outrageous fortune in a raging sea of troubles (look here).

Doubling-down on electric demand

This morning the FT is giving significant attention to the NERC Long-Term Reliability Assessment. The Financial Times summarizes, “Nerc forecasts peak winter electricity demand growth of 11.6 per cent in the decade between 2024 to 2033, compared with growth of 5.4 per cent between 2019 and 2028. Summer peaks over the same time periods are now forecast to rise by 9.2 per cent, compared with 5.2 per cent in the earlier forecast.” North American electric utilities will struggle to meet this demand. This is important news you might have missed during busy December days. So, just in case, I will point you to this blog’s December 19 post on the same issue depending on many of the same sources: Long-term grid reliability (and risk). The principal value-add in the FT coverage is to make explicit the demand implications of data-center requirements to support expanding cloud-based Artificial Intelligence applications.

+++

January 13 Update: There are near-term concerns as well. For today through Tuesday, Severe-Weather-eu forecasts, “an extensive reservoir of frigid cold air mass will begin its progress from Arctic Canada far south and spread into the United States. Temperatures will plunge into deep freeze, reaching more than 50 degrees F below average for the northern countries.” (See map below and more.) In anticipation, “NERC is monitoring the impending extreme cold weather events forecast across much of North America, starting this weekend and expected to continue through next Tuesday. This extreme weather pattern of arctic cold and heavy rain across most of the lower 48 states has the potential to create significant challenges, especially in major metropolitan areas… The MISO grid can be monitored here. The ERCOT grid can be monitored here. The Southwest Power Pool grid can be monitored here and through related links.

arctic-blast-winter-storm-gerri-snow-blizzard-forecast-polar-vortex-united-states-canada

January 18 Update: According to the New York Times, “During the past few days, renewable energy was a small but meaningful part of the energy mix that delivered electricity to Texans. But starting on Sunday, as wind chills dipped below 0 degrees Fahrenheit in some Texas cities and demand surged, especially in morning hours when residents awakened, the grid leaned heavily on gas, according to data from the Electric Reliability Council of Texas, the grid operator… In areas of Texas where temperatures dipped the lowest, it has been frigid but sunny. Solar power performed well and, overall, provided a small share of total electricity generated. In Texas, winds die down in winter and aren’t expected to contribute as much to the energy mix as in the summer, energy experts say. On Monday, for instance, wind at its highest-performing level of the day was about 28 percent of the energy mix, compared with gas at about 48 percent. In the early morning hours, however, wind was barely more than 7 percent.” KVUE explained, “The Electric Reliability Council of Texas (ERCOT) has not issued an energy emergency alert (EEA) this week as freezing weather blankets the state and the demand for power is driving higher than any other winter on record. “You had low thermal power plant outages. You had decent to very good wind depending on the time of the event. You’re looking at solar and storage. So this is where, you know, it’s a system – it’s all kind of working together,” said Doug Lewin, founder of Stoic Energy Consulting.”

Paying to eat

A few factors worth considering: During December the planet’s largest national economy was experiencing a strong labor market with higher wages during an extended holiday season featuring gift-giving, family reunions, and general partying. Weather was certainly variable, but nothing that would seriously constrain overall demand pulling supply (or push toward demand). Without knowing much more, I might guess that demand for food — especially eating-out — would be comparatively higher than just before or after.

Today’s Consumer Price Index for food-at-home and food-away-from home does not directly measure demand or supply. But the CPI does presume to demonstrate — or at least provide a credible indicator of — comparative price behavior. (See chart below.) The Bureau of Labor Statistics finds that during December the price of eating-out increased 0.3 percent from November and over the last twelve months has increased 5.2 percent. I am guessing, not claiming, that service sector wages could be implicated.

Meanwhile at the grocery store (and similar) the MOM change was 0.1 percent and 1.3 percent over the last twelve months. The supply of high volume, high velocity finished foods is, this seems to suggest, pretty much consistent with demand. The supply of more customized, thereby lower volume, lower velocity food ready-to-eat — prepared and served by others rather than self-prepared — is less well-matched with December demand and, probably, charging more to cover the wages needed to close the supply gap with demand.

People worried about inflation are less happy with these outcomes than those who want healthy supply chains for all sorts of foods and eating experiences. Especially in the food-at-home network these are great results compared with the imbalance between demand and supply — and therefore the food inflation rate — during the second half of 2021 and all of 2022.

Avoiding risk generates friction

According to a January 10 CNN report:

The US Navy shot down 21 Houthi missiles and drones launched from Yemen, according to a statement from US Central Command, in one of the largest Houthi attacks to take place in the Red Sea in recent months. The military called it a “complex attack” carried out by the Iranian-backed militants. It comes amid increasing tensions around Israel’s war against Hamas in Gaza and fears it could spill over into a wider regional conflict. The barrage, launched at about 9:15 p.m. Tuesday in Yemen, included 18 one-way attack drones, two anti-ship cruise missiles and one anti-ship ballistic missile, Central Command said. The attack was launched toward international shipping lanes in the southern Red Sea where “dozens” of merchant vessels were traveling, according to the statement. Two defense officials had earlier told CNN that the barrage included a total of 24 drones and missiles. (More and more)

Even before yesterday’s audacious attacks, increased risk had resulted in significant risk avoidance. Last week the Kiel Institute reported that about 200,000 containers per day have recently been transported via the Red Sea down from some 500,000 per day in November (see chart and infographic below). Further as the Bab al-Mandab Strait is converted from a beneficial bottleneck into a painful chokepoint, Loadstar reports:

Crowd-sourced freight rates platform Xeneta said the Red Sea shipping crisis would get worse before it got better, and shippers needed to “get their act together quickly” to secure capacity in the run-up to Chinese New Year next month.  In its latest analysis, Sea-Intelligence also warned that shippers exporting from Asia would have limited access to capacity in the coming weeks. “On Asia-North Europe, due to a combination of some services being held back in departure from Asia awaiting re-routing, and some services clearly arriving late into Asia, there is a rapid shortfall in the middle weeks of January, with a steep capacity drop expected for the week of 22 January,” explained Alan Murphy, Sea-Intelligence CEO. (More and more.)

There has been excess capacity in ocean shipping. Longer-duration sailings between East Asia and Europe are already starting to claim this capacity. But even as ships continue to go there is concern about other sources of friction emerging as many of the benefits of Suez are lost. For example, S&P Global reports:

Despite the fluidity seen from carriers to amend services, equipment shortages in the form of empty containers are expected in Asia as vessels are scheduled for longer transits on their regular loops due to rerouting around the Cape of Good Hope. According to data from S&P Global Commodities at Sea, the alternative route has increased westbound transit times for Asia-North Europe shipments by 30% and for Asia-West Mediterranean by 60%. As a result of increased fuel consumption and higher bunkering overheads, carriers have been raising charges. “Some carriers are better at managing containers than others, the lead time in getting back to Asia will be an issue as will berthing congestion, the supply chain shortages will cause some pinching to shippers,” a forwarder said. Disruptions in supply chain logistics can therefore be expected and will cause shortages in origin that will impact services. (More and more.)

In high volume, high velocity networks, a sudden slowdown in any high proportion channel will quickly result in various forms of congestion, often emerging in surprising ways and places. It is almost impossible to avoid the congestion and can be very difficult to decongest once it happens… especially if the overall network slowdown persists.

January 12 Update: The US and UK have taken military action against Houthi assets in Yemen. Reuters reports, “The strikes were carried out by aircraft, ship and submarine. A different U.S. official said more than a dozen locations were targeted and the strikes were intended to weaken the Houthis’ military capabilities, as opposed to being just symbolic. “We were going after very specific capability in very specific locations with precision munitions,” a U.S. military official said.” (More and more and more.)

January 16 Update: S&P Global reports, “More commercial shipping avoided transiting the Red Sea Jan. 15 as a Houthi missile hit a US-owned dry bulk carrier in the Gulf of Aden in the first retaliation since US-led forces struck Houthi military sites in Yemen over the weekend. The Gibraltar Eagle was struck by a Houthi anti-ship ballistic missile from Yemen at around 1300 GMT, the US Central Command said in a statement, adding that the ship reported no significant damage or injuries and was continuing its journey.”

January 24 Update: Reuters reports that Hapag-Lloyd is opening a “land-bridge” to try and end-run on the Bab al-Mandab Strait. Bloomberg has published a “Big Read” on the Red Sea crisis. I don’t see anything new or different, but it is a helpful overview with some more recent measures of continuing (growing?) constraints.

Reuters Graphics Reuters Graphics

Bad start for new year

Supply chain outcomes for the residents of Gaza have continued to deteriorate. Volumes discharged into Gaza remain well below the minimum needed 200 truckloads per day. (See chart below).

The Kerem Shalom Crossing has resumed operations. According to COGAT, “A total of 163 trucks carrying humanitarian aid, including food, water, medical supplies, and shelter equipment were inspected and transferred to the Gaza Strip yesterday (Jan. 1). 87 trucks inspected at Nitzana crossing and transferred to the Gaza Strip via the Rafah Crossing, and 76 trucks inspected and transferred to Gaza via Kerem Shalom. “

Delivery velocity inside Gaza is next to nil. According to the most recent LogCluster consultation (December 28), “There is no last mile delivery or transportation to specific locations by the Logistics Cluster as every movement of transport requires deconfliction.” There have been other attempts to make deliveries, these have often failed due to military operations or civil unrest (more and more).

On December 30 CNN reported, “In recent days, crowds of civilians desperate for food have been seen surrounding aid trucks coming into Gaza. The United Nations has warned that the humanitarian situation in southern Gaza is deteriorating and warned that the volume of aid entering the enclave “remains woefully inadequate.”…An IPC report the same week found that approximately all of Gaza’s 2.2 million residents are now facing acute hunger and the entire population of the Gaza Strip is classified in a state of crisis – the highest share of people facing catastrophic levels of acute food insecurity that the IPC initiative has ever classified.” Famine conditions have been predicted by February at the latest.

As previously explained, prior to October 7 food stocks in Gaza were much more robust than is typical of more market-oriented dense urban areas. During the November 24-30 pause in hostilities food flows mostly met the 200 truckload per day minimum. Food stocks have since fallen precipitously and are not being replenished. The opening of the Karem Shalom Crossing on December 16-17 was promising. This was the principal freight entry facility before October 7. But this restored potential has prompted no discernable improvement in either inbound volume or outbound velocity.

Upstream supply is immediately available, according to LogCluster reports 3,000 aid trucks are currently near the Al Arish port (Egypt) waiting to enter Gaza. Another 500 trucks are said to be waiting farther west at Port Said.

In catastrophic contexts supply chains are almost always caught in a narrow place between what is prudent and what is imprudently possible (and failure may be probable). From this distance, I recognize the painful pinch. I am not ready to second-guess decisions made by those whose lives are wedged in this tightly constricted time and space. In any case, each day the deadly consequences sharpen and accumulate.

+++

January 4 Update: LogCluster has posted an overview of Gaza operations through December 18 -31. The New Yorker has interviewed the Chief Economist for the World Food Program (WFP). One summary quote, “Gaza needs more food coming in. On a good day, aid groups are bringing in maybe twenty-five to thirty per cent of what they need. So, obviously, a lot more food, fuel, medicine, water need to come in. But they need to be distributed as well. They need to go to where the people are. And I don’t know how you can do that without a humanitarian ceasefire.” COGAT reports that on January 3, “Flour, sugar, salt and fuel were distributed by WFP to bakeries in the Gaza Strip. As a result, 10 bakeries resumed operations last night. Equipment for 4 WFP warehouses have entered the Gaza Strip. These warehouses are expected to be set up in the coming days and will better the logistic capacity of the organizations receiving the humanitarian aid in the Gaza Strip.”

January 5 Update: 205 truckloads were delivered into Gaza on Thursday, January 4. (More)

January 6 Update: 151 truckloads were delivered into Gaza on Friday, January 5. (More and more and more and more)

January 8 Update: 198 truckloads were delivered into Gaza on Sunday, January 7. 113 of the trucks carried food, the rest carried water, medical supplies and shelter equipment. The Palestine Red Crescent Society provides an updated operational report through January 5. (More and more and more)

January 9 Update: I am receiving conflicting information on the number of truckloads that were delivered yesterday. This has happened once before and was resolved within about one week. LogCluster has provided details on the Kerem Shalom inspection and delivery process. Following is a summary from minutes of a January 4 meeting.

  1. Manifested trucks cross from Egypt to the scanning area at Kerem Shalom. The scanning capacity is still unclear.
  2. Once cargo is scanned, all cargo is offloaded in the designated area and trucks return to Egypt.
  3. A Palestinian private transportation company loads cargo from the offloading area of Kerem Shalom to a designated offloading area for UN and INGO cargo. There is a nearby offloading area for ERC/PRCS and NGO cargo arriving from Nitzana.
  4. When all cargo is offloaded, another truck loads the cargo and transports it to the Rafah transshipment point waiting area with a capacity of 50 trucks.
  5. The convoy of trucks at the Rafah transshipment point is dispatched to various locations (Rafah, Deir al Balah, Khan Yunis, etc.).

Cargo that arrives on one truck from Egypt may be divided into different trucks when transported from Kerem Shalom to the offloading area of UN and INGO cargo. The QR code placed on Egyptian trucks is not accessible once cargo has been offloaded at Kerem Shalom after scanning, as the trucks return to Egypt and cargo is loaded onto Palestinian trucks.

Several why questions are prompted. This process clearly has several internal friction points and tight constraints… even before dealing with the complications of a huge displaced population in a war zone.

January 10 Update: 182 trucks carrying humanitarian aid, including food, water, medical supplies, and shelter equipment were inspected and transferred to the Gaza Strip yesterday (Jan. 9). 80 trucks inspected at Nitzana crossing and transferred to the Gaza Strip via the Rafah Crossing, and 102 trucks inspected and transferred to Gaza via Kerem Shalom. 153 (84%) of the trucks carried food, the rest carried water, medical supplies and shelter equipment. (More)

January 11 Update: 208 trucks carrying humanitarian aid, including food, water, medical supplies, and shelter equipment were inspected and transferred to the Gaza Strip yesterday (Jan. 10). 89 trucks inspected at Nitzana crossing and transferred to the Gaza Strip via the Rafah Crossing, and 119 trucks inspected and transferred to Gaza via Kerem Shalom.144 (70%) of the trucks carried food, the rest carried water, medical supplies and shelter equipment. (More and more and more and more.)

January 12 Update: 201 trucks carrying humanitarian aid, including food, water, medical supplies, and shelter equipment were inspected and transferred to the Gaza Strip yesterday (Jan. 11). 84 trucks inspected at Nitzana crossing and transferred to the Gaza Strip via the Rafah Crossing, and 117 trucks inspected and transferred to Gaza via Kerem Shalom. (More and more and more.)

January 13 Update: According to OCHA: “On 12 January, 178 trucks with food, medicine and other supplies entered the Gaza Strip through the Rafah and Kerem Shalom crossings. Under-Secretary-General for Humanitarian Affairs and Emergency Relief Coordinator Griffith’s stated today that… “We cannot replace Gaza’s commercial sector. Commercial goods must be let in, at scale.” The minutes of the January 11 LogCluster meeting are now available. A few interesting excerpts: “Two additional Mobile Storage Units (MSUs) have been installed in Rafah to augment the storage capacity of the Palestine Red Crescent Society (PRCS). Two MSUs will also be installed in the coming days at Kerem Shalom to increase the offloading capacity. The Logistics Cluster plans to bring in more equipment to Gaza, including MSUs, prefabs, and generators, pending pre-approval from COGAT.” UNRWA is beta testing a new dashboard to track supply flows into Gaza:

Friction slows flows

Houthi forces have continued to attack ships passing through the Bab al-Mandab strait (more). A December 31 attack was repulsed by US Navy assets. A Maersk container ship was the intended Houthi target. In response Maersk has, again, suspended operations in the area (see map below). This will result in much longer sailings between East Asia and Northwest Europe (see second map below). Maersk explains: “Following an incident involving one of our vessels, the A.P. Moller – Maersk group (Maersk) has today decided to pause all transits through the Red Sea / Gulf of Aden until 2 January… Maersk Hangzhou was among the first vessels to go through the Red Sea again following confirmation that the multinational security initiatives, Operation Prosperity Guardia (OPG), had been deployed in the area. Maersk is currently working to ascertain the full details of the incident involving Maersk Hangzhou. We are in close dialogue with the OPG naval operation and authorities to assess the security level in the area and any potential impact to our voyage plans.” (More and more and more). Many ocean carriers have indicated they will take the longer route for the foreseeable future (more). January 2 Update: Some updates from S&P Global, especially related to raw petroleum flows.

+++

January 3 Update: Bloomberg has published an extensive Big Read on the Panama Canal’s long-term options. Now and in the near-term Bloomberg reports, “The constraints have since eased slightly due to a rainier-than-expected November, but at 24 ships a day, the maximum is still well below the pre-drought daily capacity of about 38. As the dry season takes hold, the bottleneck is poised to worsen again.”

January 4 Update: Freightos is reporting surging spot rates for container shipping. See chart below.