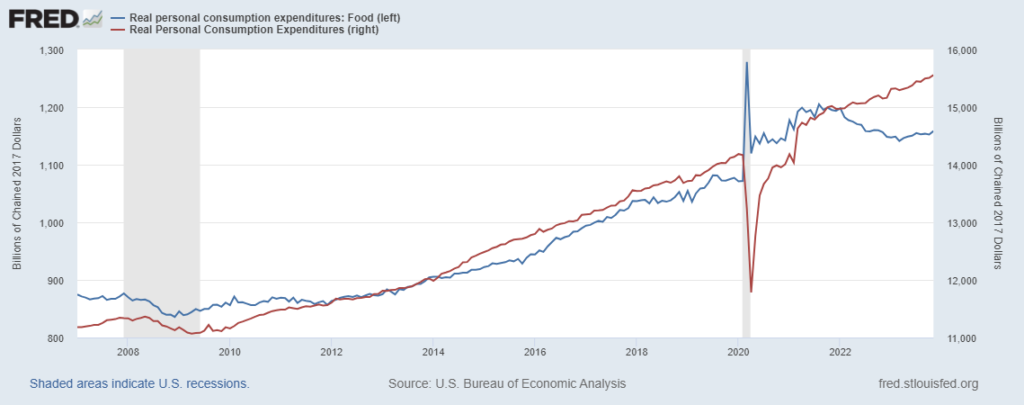
So far, retrospective data and current observations suggest that US demand and supply networks are well-balanced. The Global Supply Chain Pressure Index ended December hovering around its long-term average. The Cass Freight Index is similarly well-behaved if compared to several pre-pandemic year-ends (more and more). The Logistics Managers Index, “moved back into expansion territory in December. This movement back to growth was led by increased activity among the three warehousing metrics. Warehousing Capacity is tighter (-5.5) while Utilization (+7.4) and Prices (+1.2) are both expanding at increasing rates. Inventory Levels continued to decline at a steady pace (although they were breaking even Downstream – likely indicative of JIT practices products selling briskly).” There are credible indicators that strong US consumer demand continues at a less erratic, supply-chain-friendly pace than in recent memory. The December US Personal Consumption Expenditure report is unlikely to dramatically diverge from recent patterns (see second chart below).
Given the global context — featuring economic constraints in China and Europe and expensive chokepoints related to the Suez and Panama canals — benign or better US conditions ought not be taken for granted. How bodes the future?
Last week’s USDA World Agricultural Supply and Demand Estimates projects, “global wheat outlook for 2023/24 is for larger supplies, consumption, trade, and ending stocks compared with last month. Global supplies are raised 3.6 million tons to 1,056.5 million on higher beginning stocks and production. The increase in global beginning stocks is primarily the result of revisions for Ukraine, where beginning stocks are raised 2.2 million tons to 3.5 million on downward revisions to feed and residual use estimates since 2021 /22… Global consumption is raised 1.8 million tons to 796.5 million, mainly on higher feed and residual use for India and the EU.” Corn and other course grains are also expected to be abundant, “Global coarse grain production for 2023/24 is forecast up 11.9 million tons to 1,513.9 million… Global corn stocks, at 325.2 million tons, are up 10.0 million.” Regarding rice: “Supplies are lowered 3.5 million tons to 689.4 million with most of the reduction the result of a lower China production estimate reported by the National Bureau of Statistics. World 2023/24 consumption is lowered 2.9 million tons to 522.1 million, mainly on a reduction for China.” Soybean production is expected to be similar to last year. While production looks good, transportation can be complicated on the Mississippi, in the Black Sea, or through the Panama Canal or Red Sea to Suez. The long-range weather forecast suggests that the Southern Hemisphere’s 2024 harvest season and the Northern Hemisphere’s growing season will unfold into weakening El Niño affects, with a possible La Niña pattern emerging in September/October/November (more).
US and global petroleum production is strong. Prices have not soared, despite several serious geopolitical challenges. US production is only slightly off record-setting heights (more). Refinery output is robust and consistent with market demand (here and here and here and here). S&P Global reports, “Growing pressure on shipowners to avoid the Red Sea took a toll on European refined product imports in the first half of January… Arrivals from Saudi Arabia, India and Kuwait have already tumbled respectively by 15%, 31% and 43% over Jan. 1-17 from December levels. For Europe, falling import volumes put diesel supplies most at risk. The continent sources about one-third of its diesel supply from the Middle East, and with Insights Global data showing stock levels 257,000 below the five-year average Jan.11, upside risk is significant. Higher imports from the US have provided some buffer. To date 237,000 b/d of diesel/gasoil supply has arrived in Europe from the US in January, down from 246,000 b/d in December but up significantly from an average of 155,000 b/d in 2023…” In a separate report S&P Global explains, “Chinese shipping and trade sources said oil flows into China have not been impacted much by the Red Sea turbulence, as few cargoes were heading to China on that route… On the export front, China’s refined oil primarily heads to the Asia-Pacific region, which implies that Red Sea tensions are having limited impact.”
LNG flows have also been disrupted and delayed by the Houthi’s Red Sea chokepoint. But Reuters reports, “U.S. LNG exports hit a record high of 8.56 million tons in December, according to Kpler, with Europe receiving 5.87 million and Asia 2.2 million, and small volumes heading to the Americas. The United States has the ability to boost shipments to Europe if required, and it may also suit to send less to Asia given the current delays affecting shipping through the Panama Canal, caused by a lack of rain leading to draught restrictions and lower shipping movements. The current situation in the Red Sea has the potential to escalate, but for the moment it’s more of a concern than a factor driving prices.” Indeed, after a brief reaction to the risks of wider war in the Middle East, the European benchmark price for natural gas (now much more dependent on LNG) has continued to fall (see first chart below). On January 8, Javier Blas commented, “Mild weather [in Europe] has induced a massive decrease in gas consumption for heating. That’s on top of greater demand reduction due to energy-intensive companies curbing production. In Germany, for example, output from energy intensive companies, such as chemical plants and metal smelters, is down 20% from before Putin’s invasion of Ukraine. As a result, stockpiles remain well above normal for this time of the winter. Granted, they started the season almost full, compared to the typical 90%. Since then, with consumption lower than normal, they have dropped to about 85%, compared to a 10-year average for early January of about 75%. Under current trends, Europe would reach the spring with more than half its underground gas storage full, versus a 10-year average of just 35%.” Natural Gas takes longer to reach EU pipelines from a different direction, but both supply and price are currently able to support sustained flows.
Where food and fuel can flow, so can much more. Freight carriers are experiencing increased demand for longer sailings, air cargo, and rail delivery (more). Continued friction at Suez and Panama cause increased time-on-task, delayed discharge, and higher costs overall. These factors allow carriers to claim higher rates. So far, higher rates have not substantially reduced demand. UBS Chief Economist Paul Donovan comments, “The additional nine days it takes to ship cargo around the Cape of Good Hope is unlikely to result in shortages, and shipping costs are a tiny part of the price consumers pay for goods.” (More)
But whenever this kind of congestion and rewiring emerges in demand and supply networks, vigilance is valuable (here). Early interventions are helpful to reopen chokepoints, decongest and smooth existing bottlenecks, facilitate alternate routing (important example here), and avoid painful bullwhips prompted by nervous — sometimes insidious — consumers and suppliers. At the start of 2024, I perceive a robust and adaptive global network contending with an amazing array of slings and arrows of outrageous fortune in a raging sea of troubles (look here).