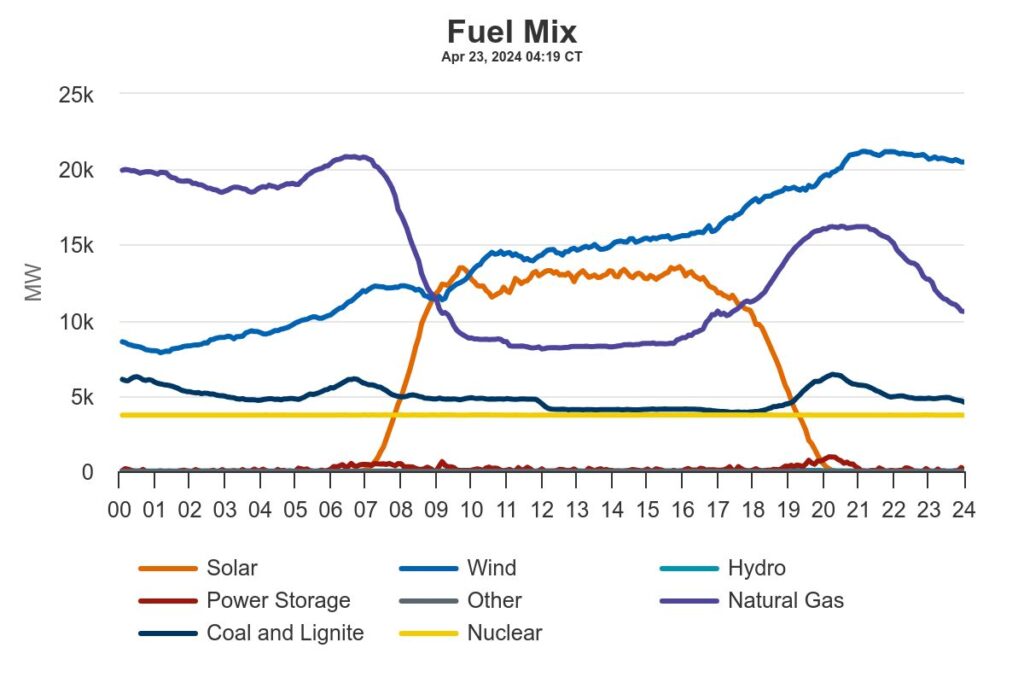
Below is yesterday’s (April 22, 2024) full-day fuel mix for the Texas grid. Proportions change seasonally and (obviously) by the time of day. But the major contributors remain the same: solar, wind, natural gas, coal/lignite, and nuclear. Other sources are very marginal, but can be vital when the grid is teetering on the edge. The proportions at play in Texas ought not be generalized. For example, in Washington State hydropower delivers almost 65 percent of electricity generation.
Let’s try to quickly trace some individual links in the Texas grid supply chain. Wires and transformers are early steps upstream from electricity consumption. We all know about wires (at least in general). Transformers are less well known. PV magazine explains, “Transformers are a necessary piece of the energy puzzle, as they manage the flow of electricity along the power grid by changing high-voltage electricity from transmission lines into low-voltage electricity before it reaches consumers.” There is currently a “shortage” of both electrical cables and transformers.
The scare quotes are meant to suggest that while there are current supply-side constraints (here and here), this is less a matter of reduced supply and much more a matter of increasing demand. A recent study by the National Renewable Energy Laboratory (NREL) found that demand is surging because of “aging infrastructure, electrification and massive growth in electricity demand, increased failure due to extreme weather events, and proactive utility resilience replacement programs. NREL preliminary analysis estimates current stock of between 60-80 million distribution transformers with upwards of 3 TW of installed capacity, and estimates the growth in overall stock capacity by 2050 will see up to a 160%–260% increase on 2021 levels.” (More and more and more.)
If we follow the different-capacity wires and transformers further upstream, we are not surprised to find more than 160 natural gas power stations operating in Texas. Texas produces more natural gas than any other state and about a quarter of national output (here). Texans also consume the most natural gas. Roughly 40 percent of electricity consumed in Texas depends on natural gas. Both Texas and the Unites States have very robust proven reserves of natural gas. But during 2021’s Winter Storm Uri natural gas connections froze. The very abundance of natural gas can also contribute to price swings that undermine consistent investment in exploration, drilling, and maintenance. Even with production cuts, recent price action has discouraged producers (more and more). This sort of volatility can narrow resilience investments at every step in the natural gas system.
About sunrise yesterday the wind picked up across Texas and so did the contribution of wind power to the grid (see blue line below). With more than 15,000 wind turbines this sector typically contributes about a quarter of total electricity generation in the state (here). But typically the wind does not blow as much in summer as winter (especially under El Nino effects). This can be a problem when Texas gets very hot (here). And sometimes even winter winds can slow. Lagging transmission network upgrades are also a constraint (here and here). Lack of skilled labor and some parts problems have complicated build-outs (see transformer note above and more and more). China is home for about sixty percent of global wind power parts and supplies. There is some sense that China gets what it can use before selling what’s left to non-domestic customers (here).
Last month Texas surpassed California as the state with the most grid-scale solar capacity. In recent years, about six percent of overall electricity consumed in Texas has originated with solar power. This is growing quickly, just as Texan’s demand for electricity is growing quickly. On some days, solar can be the source for over one-third of Texas grid output. Supply chain resilience for solar is complicated by the turning of the planet, clouds, and lack of storage capacity. But Texas is investing more in grid-related batteries than any other state (here and here). On August 24 last year I watched while a modest blip of “stored power” reinforced a highly stressed Texas grid just as the sun was setting and demand was peaking (more). Given the chart below, “power storage” is now a much more regular contributor to grid management (more and more).
Batteries, solar panels (and related), and wind turbines (and related) all have complicated, long-distance supply chains facing high demand and technological innovation (more and more and more and more). Each of these separate sectors also share a dependence on at least seventeen rare earths. Supply chain resilience is challenged by the innate rarity of these components — and, potentially, by the over-concentration of global capacity for rare earth production in China (roughly 70 percent).
Given supply chain complexities we could clearly go deeper and wider than above. A full forensic assessment of these supply chains could be an evergreen, never-ending task. But just what is outlined above is evidence of an innovative sector that is growing quickly in an ambitious effort to fulfill fast-growing demand. What this also — almost ipso facto — means is that the risk of grid failure is structural, systemic, and likely to be stubborn for the next several years (more).
April 27 Update: Yesterday afternoon “ERCOT issued an AAN (Advance Action Notice) due to a possible future Emergency Condition of reserve capacity deficiency beginning Monday April 29, 2024, HE 2000 through Wednesday May 1, 2024, HE 2100. ERCOT may Delay/Withdraw Approved or Accepted Resource Outages. ERCOT may seek up to 2,832 MW from an OAE (Outage Adjustment Evaluation) and then make the OSA (Outage Schedule Adjustment). On Saturday April 27, 2024, at 14:30 ERCOT will execute an OAE if deemed necessary.” Bloomberg explains, “Grid conditions can be tight this time of the year because early heat can increase demand while supplies are hampered by scheduled maintenance in preparation for the summer air-conditioning season. The evening hours are especially vulnerable to shortages as solar power goes offline and other supply has to ramp up.”
April 30 Update: Hot temperatures in Texas increased power demand even more than originally forecast, first chart below. With wimpy winds, natural gas draws surged — and prices did too. See April 29 fuel mix chart below. Matching supply and demand will continue to be challenging.
April 29 Demand on ERCOT Grid

April 29 Fuel Mix on ERCOT Grid

+++
May 6 Update: The Financial Times has published a “Big Read” on how to pay for the green transition. One of several potential angles reported, “Over the next seven years, capital expenditure on renewables will roughly double while fossil fuel capex will halve, according to research from RMI published earlier this year. Falling fossil fuel capex will therefore provide around half of the growth in renewable capex, it concluded.”