Month: March 2024

No flows for Gaza

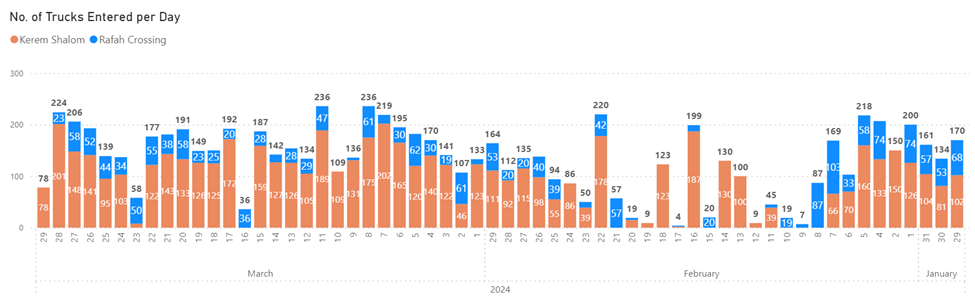
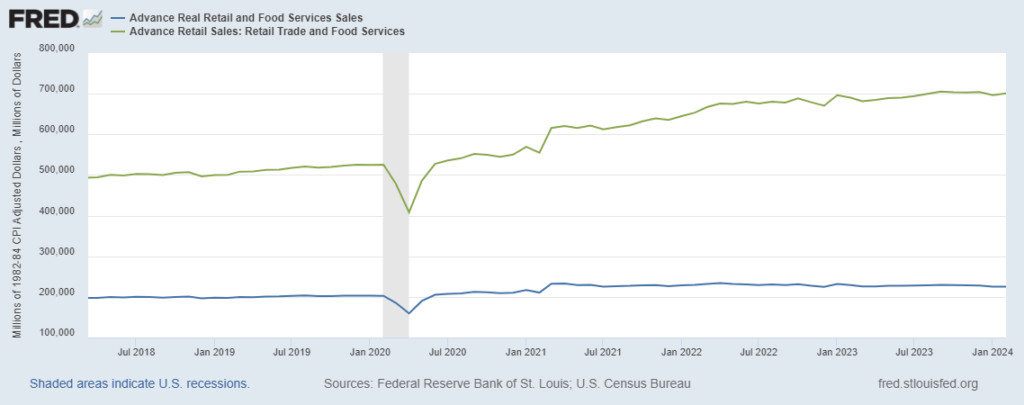
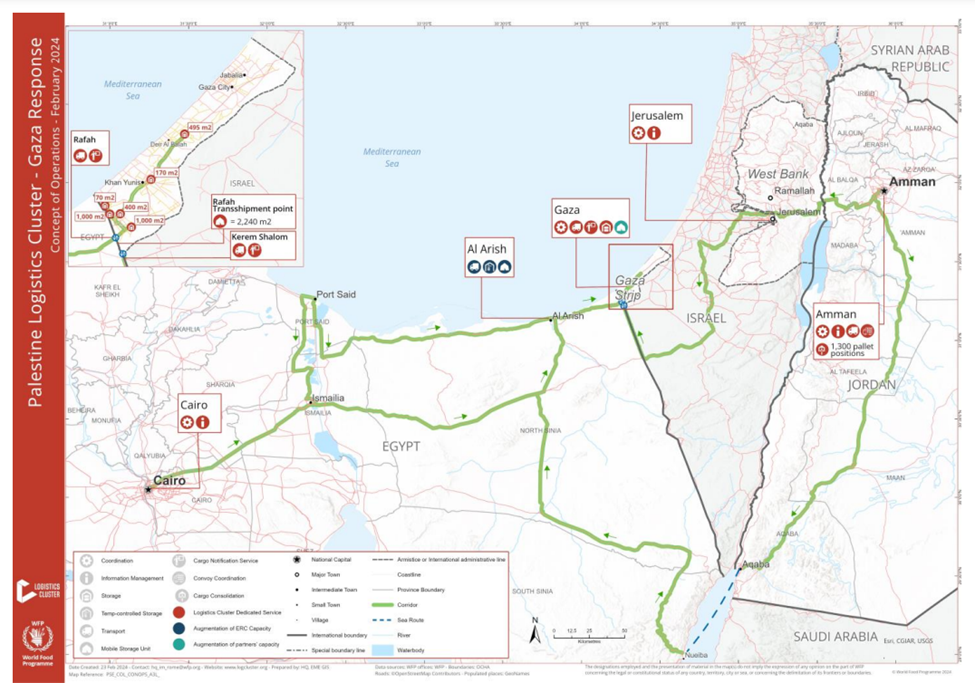
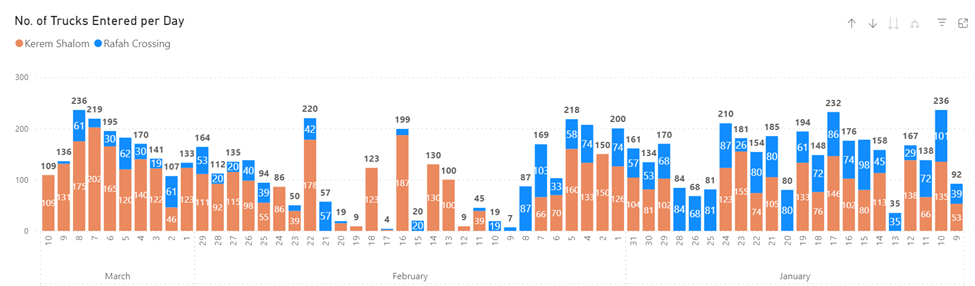
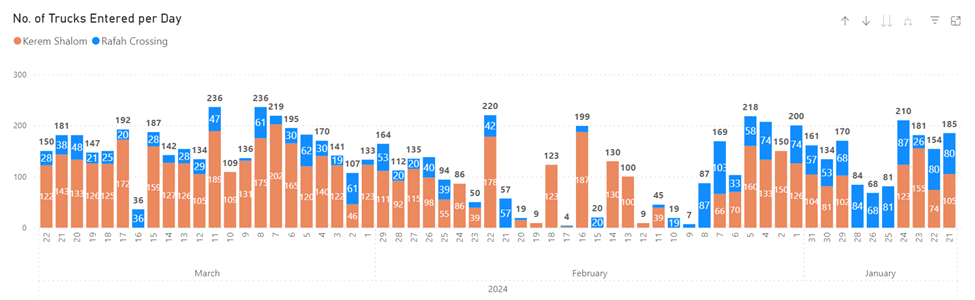
NBC News reviews persisting impediments for connecting demand (desperate need) to (plenty of) supply. Over the last week there has not been much change in actual flows since my March 24 update here (or for that matter since mid-December). Please see chart below. The Associated Press reports that, “A three-ship convoy left a port in Cyprus on Saturday with 400 tons of food and other supplies for Gaza as concerns about hunger in the territory soar. The World Central Kitchen charity said the vessels and a barge carried enough to prepare more than 1 million meals from items like rice, pasta, flour, legumes, canned vegetables and proteins. Also on board were dates, traditionally eaten to break the daily fast during the holy month of Ramadan. It was not clear when the ships would reach Gaza.” (More and more and more (and one more link from an April 1 WSJ report))

April 2 Update: The Washington Post reports, “World Central Kitchen said Tuesday that seven of its workers in Gaza were killed in an Israeli strike and that it was immediately halting its operations in the region.” Please read an April 3 essay by José Andrés, founder of World Central Kitchen, published by the New York Times.

US consumer demand

Same statistical report, three different headlines:

From CNBC — Key Fed inflation gauge rose 2.8% annually in February, as expected

From The Hill — Inflation ticker higher in February as consumer spending soared

From FXStreet — Price pressures seen broadly unchanged

Bloomberg summarized: “Inflation-adjusted consumer spending advanced 0.4%, above all estimates after a larger drop in the prior month, according to the report from the Bureau of Economic Analysis. Real disposable income, the main supporter of spending, edged lower for the first time since September.”

I like the PCE report because it includes inflation-adjusted estimates of spending. Below is a chart showing how — when adjusted for inflation — US personal consumption continues to climb pretty consistently at a level well-above pre-pandemic patterns. Meanwhile spending on food has fallen significantly since early 2021, yet food-at-home spending remains at least five percent higher than pre-pandemic. Food-Away-From-Home consumption has been even stronger.

Earlier this week the Wall Street Journal reported, “Shoppers are stretched, but discretionary spending isn’t abating as quickly as some finance chiefs and economists expected—a phenomenon economists and finance chiefs have coined “revenge” and even “doom” spending. And it has CFOs across industries—from travel to clothing, restaurants and consumer packaged goods—working to figure out what the impact is on balance sheets. Americans—for now—remain resilient and are holding on to some nice-to-have experiences and habits, and are willing to even spend on small and large extravagances…” 

The FreightWaves March Market Update strikes me as consistent with February’s personal consumption findings: “There are no signs of a strong shift in market conditions at this point. The trucking market is crawling along a floor but still appears to have seen the toughest part of the cycle. Transportation service providers are now in a waiting game, while shippers need to remain vigilant. April is typically a slower month, and the market appears to be only slightly responsive to the typical March seasonality. May will house the next see-where-we-are mile marker for the market as summer shipping kicks off and Memorial Day provides the first major holiday. The outlook until then is for more of the same for dry van, with the flatbed market being the one to watch for the most volatility and refrigeration still being exposed to a potentially disruptive harvest period.”

Spending is not hot and may even be cooling, but it is — so far — certainly persistent. This is preserving and extending current supply chain capacity.

Francis Scott Key Bridge Collapse

The Baltimore Sun reports, “Baltimore’s Francis Scott Key Bridge collapsed early Tuesday morning after a support column was struck by a vessel, sending cars and at least one tractor-trailer into the Patapsco River.” The Sun is updating here. The Washington Post is updating here. The Maryland DOT 511 Traffic Map is available here.

The Annual Average Daily Traffic count for the bridge — on Interstate-695 over the Patapsco River — has been estimated at more than 38,000 vehicles of which almost six percent have been single-unit trucks and bit less than seven percent have been combination units (here and here). Traffic is about 4-to-5 times higher on Interstate-95 and the northside routes of I-695… which will clearly absorb much more volume in the many months ahead (more).

Maersk confirms it had chartered the container ship involved the collision (here and here). The ship was departing Port of Baltimore. Several vessels are now trapped at marine terminals north and west of the bridge. There will be no incoming for an extended period. The Port of Baltimore is a leading US port for imports of cars and light trucks (more and more). Reuters has published an overview of import/export implications of long-term shut-down of port operations (more and more).

March 27 Update: There are many reports and angles on the collapse of the FSK bridge. Here are a few that, in my judgment, provide helpful resources for Supply Chain Resilience.

Bloomberg headlines, “Baltimore Bridge Disaster to Test Shock-Worn Supply Chains.” The report finishes with, “…the bridge collapse will have a limited impact on the broader economy, it “is just another reminder of the vulnerability of the nation’s infrastructure and supply chains,” said Moody’s Analytics Chief Economist Mark Zandi.”

Freightwaves reports, “Baltimore bridge collapse may cost billions, dramatically disrupt supply chains.” Included: “In the next few weeks, 107 vessels will not be able to call that port and will have to divert to other ports,” Manders said. “The question is, are other ports able to absorb that capacity? The reality is that Baltimore is an important port, but for containerized trade, it is relatively small.” (More and more and more and more.)

The Financial Times reported, “It is likely other larger US east coast ports such as neighbouring New York/New Jersey and Virginia can handle additional container imports if Baltimore is inaccessible, which may limit any impact on ocean freight shipping rates,” said Emily Stausbøll, market analyst at Xeneta, a shipping data firm. “However, there is only so much port capacity available and this will leave supply chains vulnerable to any further pressure.” 

Ms. Stausbøll is also quoted at Loadstar, “…there is only so much port capacity available, and this will leave supply chains vulnerable to any further pressure… Far East to US east coast ocean freight services have already been impacted by drought in the Panama Canal and recent conflict in the Red Sea, which saw rates increase by 150%, so this latest incident will add to those concerns.”

The BBC reported, “Marco Forgione, director general at The Institute of Export and International Trade, which represents UK businesses involved in international trade, said the suspension would have a “significant ripple effect on global supply chains… Over 750,000 cars and vehicles transited through Baltimore in the last year…” The Loadstar report adds “the global pure car and truck carrying fleet is currently in a situation of severe undercapacity, and the fact that one Wallenius vessel is now stranded in Baltimore behind the bridge will do the trade no favours.” According to The Hill, Philadelphia has a ‘roll on, roll off’ terminal that receives imports of Hyundai, Kia, and Genesis vehicles.

In its Wednesday morning opening overview on the continuing story, Reuters reports, “…economists and logistics experts said they doubted the port closure would unleash a major U.S. supply chain crisis or major spike in the price of goods, due to ample capacity at rival shipping hubs along the Eastern Seaboard. The loss of the bridge also snarled roadways across Baltimore, forcing motorists onto two other congested harbor crossings and raising the specter of nightmarish daily commutes and regional traffic detours for months or even years to come.”

One more link for today (plenty more in future days, I suspect): The Washington Post has published a piece on supply chain implications that does not break new ground, but does include very helpful — highly crystalized — visualizations of several key flow factors.

March 28 Update: FreightWaves has a good summary of serious local impacts mostly related to continued closure of the Port of Baltimore. FreightWaves quotes from a report by Project44 that includes details on very current ocean-going freight flows (more).

S&P Global Insight provides helpful details on the Port of Baltimore’s significant role in US coal exports and cobalt imports.

Bloomberg is reporting on now-contracted salvage and channel clearing operations plus some informed speculation on the time-frame needed to fully reopen the port — perhaps as soon as six weeks…

The Port of Baltimore has what should be a long-term comparative advantage for many freight flows due to its location (roughly 100 miles farther west than Port of NY/NJ) combined with robust rail connections. But the longer the port is closed, the more likely (and rapidly) these comparative advantages related to cost and speed will diminish.

March 30 Update: In a Saturday morning report, NPR’s Camila Domonoske does a great job detailing the crucial cluster of functions at the “neck of the hourglass” that serves — makes possible — the concentration of specialized flows for automobiles, small trucks, and agricultural vehicles at the Port of Baltimore. She avoids all my favorite network-science jargon, but describes the complex reality just as well — okay, even better. It is a four minute listen here (I don’t see a transcript yet).

April 1 Update: Bloomberg provides an overview of adaptations by Atlantic seaboard ports, carriers, and shippers to the loss of the Port of Baltimore. A Temporary Alternate Channel will open along the northeast axis of the Patapsco River (see map immediately below). Right now the depth of this TAC is anticipated to be about eleven feet, too shallow for large containers and most RoRo vessels. The MV Carmen currently trapped inside the Port of Baltimore has a draft of almost 27 feet. But this opening will facilitate faster and safer movement by tugs, barges, and other vessels involved in clearing the full channel. LATE UPDATE: At 3PM Eastern today the tugboat Crystal Coast was the first vessel to utilize the TAC pushing a barge with jet fuel for Dover Air Force Base (south of Wilmington on Delaware Bay) (here and here). A second, slightly deeper TAC is now also being cleared.

April 6 Update: Bloomberg has tracked where ships bound for Baltimore ended up — and how long it took them to make the change. Great example of volume and velocity adapting (or not). Yesterday the US Army Corps of Engineers announced it, “expects to open a limited access channel 280 feet wide and 35 feet deep, to the Port of Baltimore within the next four weeks – by the end of April. This channel would support one-way traffic in and out of the Port of Baltimore for barge container service and some roll on/roll off vessels that move automobiles and farm equipment to and from the port. USACE engineers are aiming to reopen the permanent, 700-foot-wide by 50-foot-deep federal navigation channel by the end of May, restoring port access to normal capacity.” (More and more.)

Map developed by Bloomberg

March (well, February) Flow Fitness

How goes food, fuel, and freight as the Northern Hemisphere pivots toward Spring?

Gaza, Haiti, Sudan, and much of the Sahel and Horn of Africa face life-threatening food disconnects. There are food-related riots in Nigeria. Mozambique seems trapped in a manic cycle of drought, flood, and civil strife. Profound drought in Brazil threatens this year’s harvest (but final yields are still pending). Many Americans complain about food inflation. (More and more.)

According to the US Energy Information Administration, global liquid fuel production in 2024 is forecast at about 102.17 million barrels with this year’s consumption expected to hit about 102.42 million barrels (more and more and more). Natural gas flows have experienced big shifts since February 2022 and big changes remain ahead (more). Most electrical grids are in the midst of a treacherous transition to non-traditional, renewable sources of power generation. On Sunday the Washington Post headlined: Amid record high energy demand, America is running out of electricity. The grid challenge is amplified in plenty of other places.

With both the Suez and Panama canals seriously squeezed, the Wall Street Journal reports, “Around the world, prices are rising for cargo owners. Daily boxship rates along routes from Asia to the Americas more than doubled in January from a year earlier, data from U.K. brokerage Braemar showed. Rates for Asia-to-Europe trips were up 67%. Trade volumes going through the Suez fell more than 40% in December and January compared with the year-earlier period, according to United Nations data.” (More and more.)

At the same time, the March USDA World Agricultural Supply and Demand Estimates includes, “The global wheat outlook for 2023/24 is for larger supplies, consumption, and trade… Supplies are projected to increase 0.8 million tons to 1,057.8 million… the forecast for rice “is for larger supplies, trade, and ending stocks but fractionally lower consumption. Supplies are raised 2.5 million tons to 692.6 million…” (More) “The FAO Food Price Index (FFPI) stood at 117.3 points in February 2024, down 0.9 points (0.7 percent) from its revised January level, as decreases in the price indices for cereals and vegetable oils slightly more than offset increases in those for sugar, meat and dairy products. The index was down 13.8 points (10.5 percent) from its corresponding value one year ago.”

On the fuel front, OPEC+ recently announced production cuts to adapt to flat demand (and alternative supplies). According to Bloomberg, “Ample supplies have anchored international oil prices near $80 a barrel this year, even as conflict in the Middle East disrupts regional shipping… Forecasts from the International Energy Agency in Paris suggest that, with growth in global oil demand slowing and new supply from the Americas soaring, OPEC+ will need to persevere with its cuts all year.” Western Europe is approaching the Spring equinox with natural gas storage facilities sixty percent full. (More) In 2023 Germany supplied more than half of its domestic electric consumption with renewables. On some days this winter over 70 percent of Texas electric consumption has been supplied by renewables. (More and more.)

On March 12 Maritime Executive reported, “U.S. imports are strong and continuing to grow with the outlook remaining positive into 2024. The disruptions in the Red Sea and at the Panama Canal have not impacted the number of containers arriving at U.S. ports with analysts reporting carriers have successfully adapted to the current challenges (more and more).  US rail volumes have bounced back from depressed January levels (more). Trucking demand is moderate or sluggish or recessionary (depending on the angle of observation). Earlier this week authors of the Cass Freight Index commented, “While seasonality remains soft in the near term… underlying volumes have shown improvement… It’s been over two years since the first y/y decline of this freight recession, and with destocking playing out and goods consumption rising, we see this improvement as an encouraging sign that a recovery is beginning.” (More and more.)

US Demand continues to surprise and pull tighter on supplies, especially for shelter and gasoline. According to the Bureau of Labor Statistics, “The Consumer Price Index for All Urban Consumers (CPI-U) increased 0.4 percent in February on a seasonally adjusted basis, after rising 0.3 percent in January…. Over the last 12 months, the all items index increased 3.2 percent before seasonal adjustment. The index for shelter rose in February, as did the index for gasoline. Combined, these two indexes contributed over sixty percent of the monthly increase in the index for all items.” (More and more.) Retail sales in Europe are flat. In China Lunar Holiday spending was healthy, but is not expected to persist (more). Japan’s consumers are well into a second year of reduced spending , “the average of monthly consumption expenditures per household for January 2024 was 289,467 yen, down 4.0% in nominal terms and down 6.3% in real terms from the previous year.”

Value pulling motivates pushing value. Demand that exceeds current supply prompts price increases. A little inflation pulls productivity forward. Too much inflation skews, subverts, and confuses authentic value creation. Too little inflation slows economic activity and over time deflation can cut value-creating capacity. A perpetual, challenging (and even fun) game of tug-of-war is where demand and supply are mostly well-matched and supply responds enthusiastically to healthy demand.

There are places where demand or supply has just about given up. It is hard to push an abandoned rope. But in most of the world the current game attracts strength on both sides.

Here’s the February Flow Fitness update

Here’s the January Flow Fitness update

Here is a 2023 year-end overview.

+++

March 15 Update: A few hours after posting the note above the February US retail sales report was released. Economic analyses of the results were mixed. Bloomberg reported, “US retail sales rose by less than forecast after a steep drop to start the year, underscoring concerns about the durability of consumer spending.” The Wall Street Journal noted, “February spending shows the consumer is still robust but not as strong as economists were hoping.” Reuters pulled some details, “Sales last month were boosted by a 1.6% rebound in receipts at motor vehicles and parts dealers. Sales at gasoline stations increased 0.9%, reflecting higher prices at the pump. Receipts at electronics and appliance outlets surged 1.5%. Building material and garden equipment store sales rebounded 2.2%.But online sales dipped 0.1%. There were also decreases in sales at clothing, health and personal care stores. Furniture store sales decreased 1.1%. Sales at sporting goods, hobby, musical instrument and book stores were unchanged. Sales at food services and drinking places, the only services component in the report, rebounded 0.4% after dropping 1.0% in January. Economists view dining out as a key indicator of household finances.” As Bette Midler has suggested, reality depends on distance and angles. In the chart below, the top green line tracks nominal (NOT inflation adjusted total sales) while the blue line is adjusted to “correct” for CPI. In either case, the sustained shift from pre-pandemic patterns is, I think, meaningful to framing and sizing the dynamics of demand and supply. Also relevant, the retail inventory to sales ratio remains lean compared to long-established pre-pandemic patterns.

Amalthea Maritime Channel

Maritime food flows from Cyprus to Gaza were a good idea when first proposed in early November (more). This idea was even more promising last December when the EU endorsed and Israel signaled a tentative readiness to cooperate. If flows had actually begun in January our current context would be much more constructive.

Maybe the idea is on the edge of becoming more than an idea after last night’s push by President Biden (more and more ). The European Commission president is in Cyprus today to accelerate the diplomatic context and enable practical progress. Innovative private-public options are being floated.

An even better idea is for preexisting overland freight flows to be regularly discharged into Gaza and effectively distributed to hungry people across Gaza. (See current capacity map below.) But it is now well past time to recognize that this better idea is susceptible to insidious delays… and an already urgent situation is becoming more desperate each day. Please see recent measures of sparse inbound Gaza freight flows in the chart below (more). By now we ought not allow the even-better to compete with the bit-better.

Upstream flow capacity currently available on or near the borders of Gaza is sufficient to serve the nutritional needs of residents. There have been two literally fatal strategic problems:

First, volumes discharged through planned bottlenecks — now chokepoints — have been constantly constrained by a wide-array of security-related frictions (please see this January 21 post for more detail and here for even more).

Second, distribution velocity from discharge points into neighborhoods has been repeatedly suppressed by recurring disruptions.

Here is how these disruptions are characterized in LogCluster’s February 26 update of their Gaza Concept of Operations.

Movement restrictions and safe humanitarian access within Gaza conflict-affected areas due to ongoing military operations, complex deconfliction processes and sporadic authorizations to operate convoys, general insecurity, damaged roads, overcrowded areas are impeding the deliveries of humanitarian assistance to affected populations… Electricity blackouts and disruption of mobile networks in Gaza have led to disruptions of communications impacting the ability of humanitarian partners to coordinate and undertake interventions.

It is not yet clear that the proposed maritime channel can avoid or effectively mitigate these two very stubborn sources of friction. Some see this update on Forward from the Sea as one way to “flood the zone” (here and here). If so, the flood gates that have been kept so tight at Rafah must not reappear in Cyprus or at the anticipated Gaza pier (Mulberry Harbor?). From what I hear — but cannot confirm — this maritime play is specifically seen as an end-run around this particular constraint. I hope so.

Suppressed distribution velocity will be much more difficult to avoid (here and here). The current combination of real physics and real fear ought not be discounted. As previously noted, serving profound need justifies profound risk-taking (here and here). But discounting or neglecting such risk is counterproductive. If impossible to avoid, how can these risks be transferred or reduced to facilitate achieving a workable level of acceptable risk?

When first proposing this idea, Cyprus named it after Amalthea (tender goddess). In ancient Greek mythology this was the goat-related foster mother of Zeus, who protected the divine child from his father (who was convinced he had successfully eaten the infant). My favorite aspect of this myth is Amalthea’s recruiting fully armed youthful male dancers (Korybantes) to noisily distract the murderous father from his vulnerable offspring. To not merely move around food, but to actually feed hungry people will require creativity, courage, and a good share of artful cunning as well.

+++

March 9 Response: Some readers are surprised by my affirmative stance regarding Amalthea. I understand; as late as New Year’s Day I might have critiqued this ambitious effort as a strategic distraction. I hope my affirmation these sixty-some days later does not neglect the ambivalences involved. I am very concerned that the two strategic problems identified above will be inherited by Amalthea.

A crucial principle of Supply Chain Resilience is to recognize our systemic dependence on preexisting capacity and flow capabilities. Here is how I explained this in a December 9 post:

Supply Chain Resilience acknowledges that contemporary high volume, high velocity flows of essential human resources serving large populations cannot be replaced, even by the most robust and best-organized relief operations. The only effective and timely way to serve large numbers of survivors is rapid restoration and adaptation of preexisting flows. The current situation in Gaza may be the exception that proves the rule. For sixteen years a huge, dense population has depended on robust, well-organized “relief” operations. Sixteen years of relief operations should have signaled an unsustainable situation requiring fundamental reform. But in the very present crisis, this humanitarian supply chain is the only “preexisting capacity” that has the irreplaceable ability to serve survivors.

So… in December and well into January I pushed for higher volume flows through channels that preexisted October 7. I pushed for innovative velocity enhancements inside Gaza to overcome profound challenges of last-mile distribution in an active war zone. I was encouraged by the mid-December reopening of the Karem Shalom crossing and related steps by WFP-LogCluster, PRC, OCHA, and many other public and private entities to deliver food to hungry people despite extreme duress.

Since mid-January it has been increasingly clear that inbound volumes continue to be insufficient and velocity — both speed and targeting — is deeply degraded. In too many places flow has simply stopped. Preexisting capacity persists. There is plenty of volume within thirty miles of Rafah. But only small volumes are being discharged into Gaza and the trickle entering at Rafah is not moving much farther north.

The sources of these impediments are, it now seems to me, innate to the reality of war (Der Krieg nicht bloss ein politischer Akt, sondern ein wahres politisches Instrument ist, eine Fortsetzung des politischen Verkhers, ein Durchführen desselben mit andern Mitteln (Clausewitz). “War is not merely an act of policy but a true political instrument, a continuation of political intercourse, carried on with other means.”) Many — including Jordan, Qatar, EU, France, US, and UK — have attempted to reverse these impediments. So far these efforts have failed. Evidence is available for the deeply rooted sources of failure. Here and here are two resonant, even tragic, examples.

There are many who continue to work to reverse the causes of these stubborn impediments. I absolutely wish them well. For the 2 million-plus people of Gaza and the flow of preexisting capacity, an authentic and sustained ceasefire would profoundly help.

But I have concluded that given ongoing probability, chance, and friction (as Clausewitz can be translated), both flow and the hungry people of Gaza are essentially being held hostage to a Waiting-for-Godot-Ceasefire.  Zweck, Ziel, und Mittel  (purpose, objective, and means) have been subordinated to achieving the ceasefire. There has been too little creative, context-specific adaptation to fulfill purposes in our current reality.  Rather than adapting our means to the current context, there has been an over-dependence on crafting a new context friendly to preferred means. 

While welcoming a ceasefire, until then we need to adapt our means to the innate reality of war. I have affirmed Amalthea not only for the prospect of additional means for achieving the purpose of feeding hungry people, but even more as signal and encouragement for further, faster adaptation of any available means.

March 10 Update:

Times of Israel: How US Military Plans to Build Floating Dock for Urgently Needed Aid

New York Times: US Military enters New Phase with Gaza Aid Operations (more)

DeutscheWelle: US Sends Ship for Gaza Aid Pier (more and more)

Financial Times: Starvation Stalks Children of Northern Gaza

International Committee of the Red Cross: Statement by the ICRC President

Canadian Broadcasting Corporation: US Aid Policy on Gaza “Absurd

March 11 Update: The BBC reports on several aspects of the Amalthea Initiative and related efforts to increase flows into Gaza. CENTCOM has released visuals of US Army assets that will be involved in building the “temporary pier” off Gaza. The Financial Times has published a concise round-up of issues and actions being taken, including, “The effects of lower levels of aid delivery have been compounded as each day’s shipments fail to compensate for previous shortfalls and the accumulated damage of the war. Most hard-hit are the estimated 300,000 residents of north Gaza who stayed as the area bore the brunt of the initial Israeli ground offensive… For north Gaza alone, 300 aid trucks per day were needed… UN and US officials said this month that a genuine solution would require “flooding” Gaza with aid, not only to help suffering Gazans but to undercut the black market. That would improve security for aid convoys by removing one incentive for looting.”

Source

March 13 Update:

The BBC reports on How the US military plans to construct a pier and get food into Gaza

Reuters reports on US, allies eye commercial maritime option for Gaza aid

The Associated Press reports on four more US Army boats depart for Eastern Mediterranean

March 15 Update: Relocating more than 1 million residents of Gaza now in and near Rafah to “Humanitarian Islands” is being discussed. The BBC reports, “Moving more than half of Gaza’s population from Rafah to the centre of the strip would take time, potentially weeks… The central part of the strip where Israel proposes to relocate them has been badly damaged by repeated ground and air attacks.” (More and more and more.) Initial reactions to this (long predicted) proposal by those currently delivering humanitarian aid to desperate people crowded in and around Rafah is understandable. “Apocalyptic,” is a common response and, no doubt, accurate description of such a horrific process and its outcomes. A long-term ceasefire remains the preferred solution — and would certainly be preferable for hungry, traumatized residents of Gaza. A thought-exercise: If we were reasonably confident that seismic activity would soon prompt an earthquake and tsunami focused on Rafah, there would be a shared urgency to relocate residents away from the impact. The relocation process and outcome would almost certainly be apocalyptic, but a utilitarian ethic would motivate collaboration and action. Instead of fictional seismic activity, the people of Gaza are threatened by current and escalating military activity. An appropriate ethical response to a natural calamity is widely perceived as immoral complicity with evil (more and more and more and much more could be linked…).

March 16 Response: A reader asks about the potential of Gaza “clan” networks providing a preexisting channel for decentralized distribution of food and other essential flows. I have been asking the same question. I hear ambivalent answers… which given the complex context is not surprising. Below are a few starter links. From a supply chain perspective much depends on flow volume and sustained velocity. If the so-called “flood-the-zone” strategy can be achieved, then the clans — and many other informal connections — should be able to enhance flow velocity to peripheral sources of demand. But the less abundant any high-value flow (the more possible it is to exclude flow in any time/space) the more likely clan leadership will compete, impede flows, and deploy flow-influence to maximize other influence.

Times of Israel (more and more and more)

Jerusalem Post (more)

Carnegie Endowment for International Peace February 2024

International Crisis Group 2007 Study

March 23 Update:

Lots of activity over the last week, but not much substantive change that I can recognize. Below is an update on trucks being discharged into Gaza (more). The Guardian has published a helpful overview of flow impediments (NYT too… nothing new for regular readers). The effort continues to involve preexisting social/family groups (clans) to distribute food (here and here). Work to open a maritime channel has begun. An international conference meeting in Cyprus considered options for increasing volumes and velocity (here and here and here). The Foreign Minister of Cyprus emphasized, ““We have to remember there are limitations in terms of the reception and distribution and the whole point is not to just stockpile aid here but about a quick turnaround so we are as efficient as possible.” The prospects for such efficiency remain elusive. Many continue to insist that the choice is limited to a sustained ceasefire or mass starvation (here and here).

March 24 Update: Quoting the UN Chief, Reuters headlines, “Only effective way to ramp up Gaza aid is by road…” (more and more and more).

Nabulsi Roundabout Turn?

Thursday’s calamity at Nabulsi continues to reverberate. There are many reports on different versions of what happened (for example, here and here and here). A March 1 report by the Wall Street Journal is most coherent with what I am hearing from other usually credible sources. (I was airborne at the time.) A Friday report in the Financial Times provides meaningful context (and independent confirmation) for details outlined by the WSJ reporters. Included in the FT’s context is an update on inbound freight (non-)flows to Gaza as shown below.

Since at least December there has been an increasingly urgent need to practically increase flows of food and other essentials irrespective of a ceasefire, even in the midst of active warfare (see here and here). Last week Israel Defense Forces began their own efforts in this regard. The food convoy at Nabulsi was the fourth such convoy organized and directly supported by the IDF. In response to this calamity the United States has now followed the lead of Jordon and France to undertake airdrops of essential supplies (here and here and here ). According to US Central Command, late Saturday afternoon (local time), “U.S. C-130s dropped over 38,000 meals along the coastline of Gaza allowing for civilian access to the critical aid” (more and more). As this suggests, airdrops are volume-deficient, but better than the current next-to-nothing. (There can be serious velocity issues too, see here.) Potential maritime deliveries could result in improved volumes and velocity — if upstream pipelines and downstream distribution are also effectively deployed. Lots of big ifs here.

The International Rescue Committee has emphasized, “Airdrops are not the solution to relieve this suffering, and distract time and effort from proven solutions to help at scale.” This is a fair and wise warning. Comments by John Kirby suggest the US government basically agrees. But since October, inbound flows to Gaza have been constrained by freight chokepoints at Rafah. The deadly dangers associated with last-mile distribution have further reduced these already insufficient flows. Several hundred-thousand hungry people have been forced to depend on a Waiting-for-Godot-ceasefire. As the IRC and others argue, a ceasefire would certainly enhance potential flows. But there is an urgent need to increase food flows ceasefire or not. Preexisting flow capacities and players are always fundamental to meaningful Supply Chain Resilience, but resilience also involves adaptation. Preexisting capacity will continue to be crucial, but modes and methods to deploy capacity need to change when capacity fails to flow.

+++

A comment reported in the FT is worth highlighting, not so much for Gaza (now four months deep into this catastrophe) but for future catastrophes. Jamie McGoldrick, a United Nations official, told the FT, “There’s so much desperation . . . for people who can’t get food regularly… If they see regular trucks [arriving], they are not that desperate — and it’s worse in the north, where that desperation really comes to the fore.” This is fully consistent with observations and research on a wide range of disasters and catastrophes. Early and persistent flows — even if insufficient — provide an essential foundation for avoiding desperation, minimizing civil disturbances, and maximizing social collaboration in response to a crisis. As a long-time supply chain guy once told me in a much less desperate context, “movement is life, stasis is death, we’ve got to keep flow going.”

Persistent US Pull

On Thursday the US Bureau of Economic Analysis reported, “Personal income increased $233.7 billion (1.0 percent at a monthly rate) in January. Disposable personal income (DPI)—personal income less personal current taxes—increased $67.6 billion (0.3 percent). Personal outlays—the sum of personal consumption expenditures (PCE), personal interest payments, and personal current transfer payments—increased $54.3 billion (0.3 percent) and consumer spending increased $43.9 billion (0.2 percent). Personal saving was $779.3 billion and the personal saving rate—personal saving as a percentage of disposable personal income—was 3.8 percent in January.”

These are all nominal — current dollar — outputs. When reported in constant dollar terms (2017 chained value), the BEA finds, “The PCE price index increased 0.3 percent. Excluding food and energy, the PCE price index increased 0.4 percent… Real DPI decreased less than 0.1 percent in January and real PCE decreased 0.1 percent; goods decreased 1.1 percent and services increased 0.4 percent…”

The economic implications — especially inflation-related implications — were summarized in this Bloomberg report:

The so-called core personal consumption expenditures price index, which strips out the volatile food and energy components, increased 0.4% from December, data out Thursday showed. From a year ago, it advanced 2.8%. Economists consider this to be a better gauge of underlying inflation than the overall index. Inflation-adjusted consumer spending dropped for the first time in five months after a robust holiday shopping season, according to the report from the Bureau of Economic Analysis. Real disposable income, the main supporter of spending, was little changed.

From a supply chain — pull-push — perspective, I tend to give extra attention to housing, food, and fuel consumption. Supply chains are sensitive and can be stressed by significant and, especially, any rapid changes in pull (as seen below in pandemic behavior). These are three categories that provide a snap-shot of supply chain fitness for core human needs.

High volume, high velocity supply chains are better able to ensure demand-fulfilling flow when there is predictably stable or incremental increases in demand. Below are the inflation adjusted personal consumption expenditures for existing housing and utilities (top red line), Food-at-Home (middle blue line) and gasoline and other energy goods (bottom green line). After significant disruptions in the first half of 2020, big picture demand shifts and rate of change have been mostly benign to positive for balancing push and pull for existing housing, food, and fuel. (Not-so-much for new housing, some rents, and eating-out.)

The general strength of consumer demand in the United States is in marked contrast to behavior in China (here and here), much of the European Union (here and here), and Japan (here and here).

Note: Real PCE — inflation adjusted — outcomes for gasoline and housing are only generated on a quarterly basis, hence the unfinished lines above. But there is no reason to expect sudden arcs up or down since the end of the 2023 Fourth Quarter.