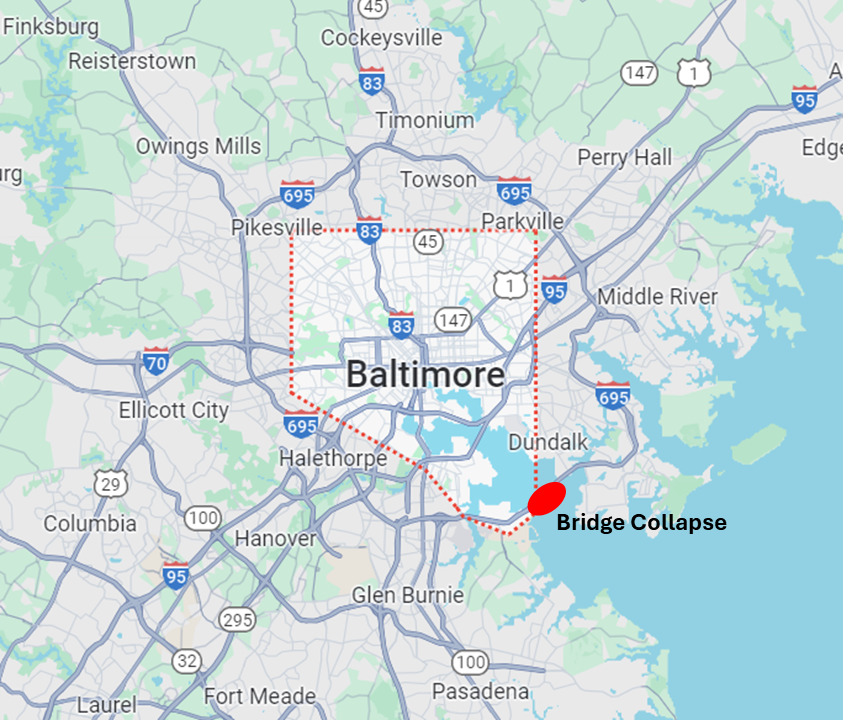
The Baltimore Sun reports, “Baltimore’s Francis Scott Key Bridge collapsed early Tuesday morning after a support column was struck by a vessel, sending cars and at least one tractor-trailer into the Patapsco River.” The Sun is updating here. The Washington Post is updating here. The Maryland DOT 511 Traffic Map is available here.
The Annual Average Daily Traffic count for the bridge — on Interstate-695 over the Patapsco River — has been estimated at more than 38,000 vehicles of which almost six percent have been single-unit trucks and bit less than seven percent have been combination units (here and here). Traffic is about 4-to-5 times higher on Interstate-95 and the northside routes of I-695… which will clearly absorb much more volume in the many months ahead (more).
Maersk confirms it had chartered the container ship involved the collision (here and here). The ship was departing Port of Baltimore. Several vessels are now trapped at marine terminals north and west of the bridge. There will be no incoming for an extended period. The Port of Baltimore is a leading US port for imports of cars and light trucks (more and more). Reuters has published an overview of import/export implications of long-term shut-down of port operations (more and more).
March 27 Update: There are many reports and angles on the collapse of the FSK bridge. Here are a few that, in my judgment, provide helpful resources for Supply Chain Resilience.
Bloomberg headlines, “Baltimore Bridge Disaster to Test Shock-Worn Supply Chains.” The report finishes with, “…the bridge collapse will have a limited impact on the broader economy, it “is just another reminder of the vulnerability of the nation’s infrastructure and supply chains,” said Moody’s Analytics Chief Economist Mark Zandi.”
Freightwaves reports, “Baltimore bridge collapse may cost billions, dramatically disrupt supply chains.” Included: “In the next few weeks, 107 vessels will not be able to call that port and will have to divert to other ports,” Manders said. “The question is, are other ports able to absorb that capacity? The reality is that Baltimore is an important port, but for containerized trade, it is relatively small.” (More and more and more and more.)
The Financial Times reported, “It is likely other larger US east coast ports such as neighbouring New York/New Jersey and Virginia can handle additional container imports if Baltimore is inaccessible, which may limit any impact on ocean freight shipping rates,” said Emily Stausbøll, market analyst at Xeneta, a shipping data firm. “However, there is only so much port capacity available and this will leave supply chains vulnerable to any further pressure.”
Ms. Stausbøll is also quoted at Loadstar, “…there is only so much port capacity available, and this will leave supply chains vulnerable to any further pressure… Far East to US east coast ocean freight services have already been impacted by drought in the Panama Canal and recent conflict in the Red Sea, which saw rates increase by 150%, so this latest incident will add to those concerns.”
The BBC reported, “Marco Forgione, director general at The Institute of Export and International Trade, which represents UK businesses involved in international trade, said the suspension would have a “significant ripple effect on global supply chains… Over 750,000 cars and vehicles transited through Baltimore in the last year…” The Loadstar report adds “the global pure car and truck carrying fleet is currently in a situation of severe undercapacity, and the fact that one Wallenius vessel is now stranded in Baltimore behind the bridge will do the trade no favours.” According to The Hill, Philadelphia has a ‘roll on, roll off’ terminal that receives imports of Hyundai, Kia, and Genesis vehicles.
In its Wednesday morning opening overview on the continuing story, Reuters reports, “…economists and logistics experts said they doubted the port closure would unleash a major U.S. supply chain crisis or major spike in the price of goods, due to ample capacity at rival shipping hubs along the Eastern Seaboard. The loss of the bridge also snarled roadways across Baltimore, forcing motorists onto two other congested harbor crossings and raising the specter of nightmarish daily commutes and regional traffic detours for months or even years to come.”
One more link for today (plenty more in future days, I suspect): The Washington Post has published a piece on supply chain implications that does not break new ground, but does include very helpful — highly crystalized — visualizations of several key flow factors.
March 28 Update: FreightWaves has a good summary of serious local impacts mostly related to continued closure of the Port of Baltimore. FreightWaves quotes from a report by Project44 that includes details on very current ocean-going freight flows (more).
S&P Global Insight provides helpful details on the Port of Baltimore’s significant role in US coal exports and cobalt imports.
Bloomberg is reporting on now-contracted salvage and channel clearing operations plus some informed speculation on the time-frame needed to fully reopen the port — perhaps as soon as six weeks…
The Port of Baltimore has what should be a long-term comparative advantage for many freight flows due to its location (roughly 100 miles farther west than Port of NY/NJ) combined with robust rail connections. But the longer the port is closed, the more likely (and rapidly) these comparative advantages related to cost and speed will diminish.
March 30 Update: In a Saturday morning report, NPR’s Camila Domonoske does a great job detailing the crucial cluster of functions at the “neck of the hourglass” that serves — makes possible — the concentration of specialized flows for automobiles, small trucks, and agricultural vehicles at the Port of Baltimore. She avoids all my favorite network-science jargon, but describes the complex reality just as well — okay, even better. It is a four minute listen here (I don’t see a transcript yet).
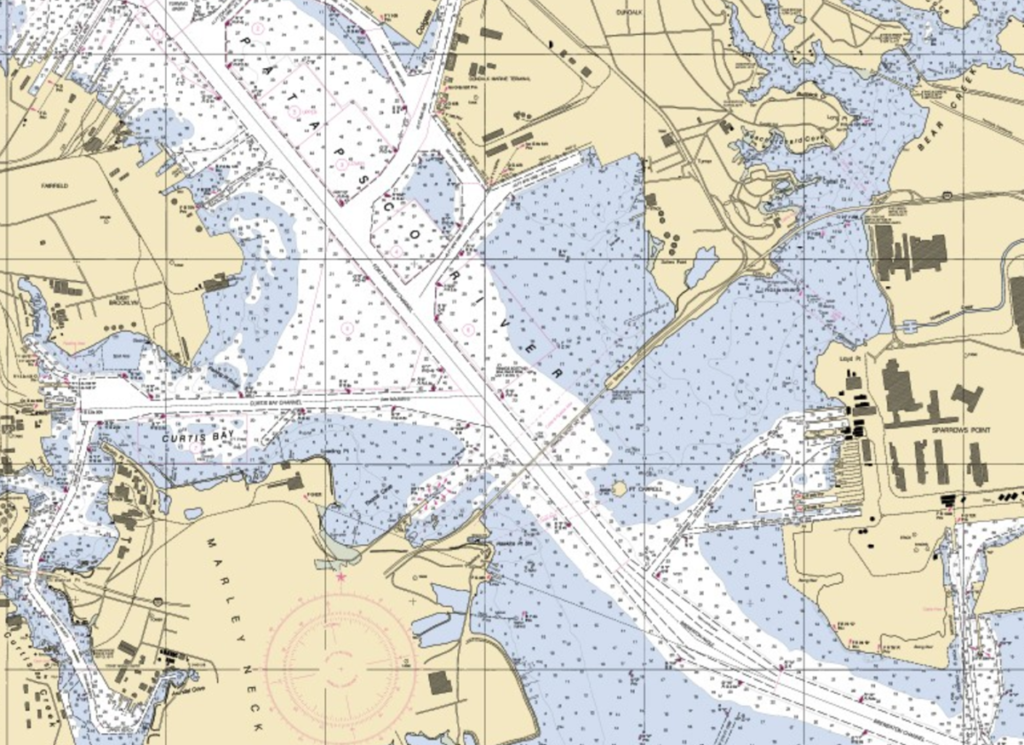
April 1 Update: Bloomberg provides an overview of adaptations by Atlantic seaboard ports, carriers, and shippers to the loss of the Port of Baltimore. A Temporary Alternate Channel will open along the northeast axis of the Patapsco River (see map immediately below). Right now the depth of this TAC is anticipated to be about eleven feet, too shallow for large containers and most RoRo vessels. The MV Carmen currently trapped inside the Port of Baltimore has a draft of almost 27 feet. But this opening will facilitate faster and safer movement by tugs, barges, and other vessels involved in clearing the full channel. LATE UPDATE: At 3PM Eastern today the tugboat Crystal Coast was the first vessel to utilize the TAC pushing a barge with jet fuel for Dover Air Force Base (south of Wilmington on Delaware Bay) (here and here). A second, slightly deeper TAC is now also being cleared.
April 6 Update: Bloomberg has tracked where ships bound for Baltimore ended up — and how long it took them to make the change. Great example of volume and velocity adapting (or not). Yesterday the US Army Corps of Engineers announced it, “expects to open a limited access channel 280 feet wide and 35 feet deep, to the Port of Baltimore within the next four weeks – by the end of April. This channel would support one-way traffic in and out of the Port of Baltimore for barge container service and some roll on/roll off vessels that move automobiles and farm equipment to and from the port. USACE engineers are aiming to reopen the permanent, 700-foot-wide by 50-foot-deep federal navigation channel by the end of May, restoring port access to normal capacity.” (More and more.)
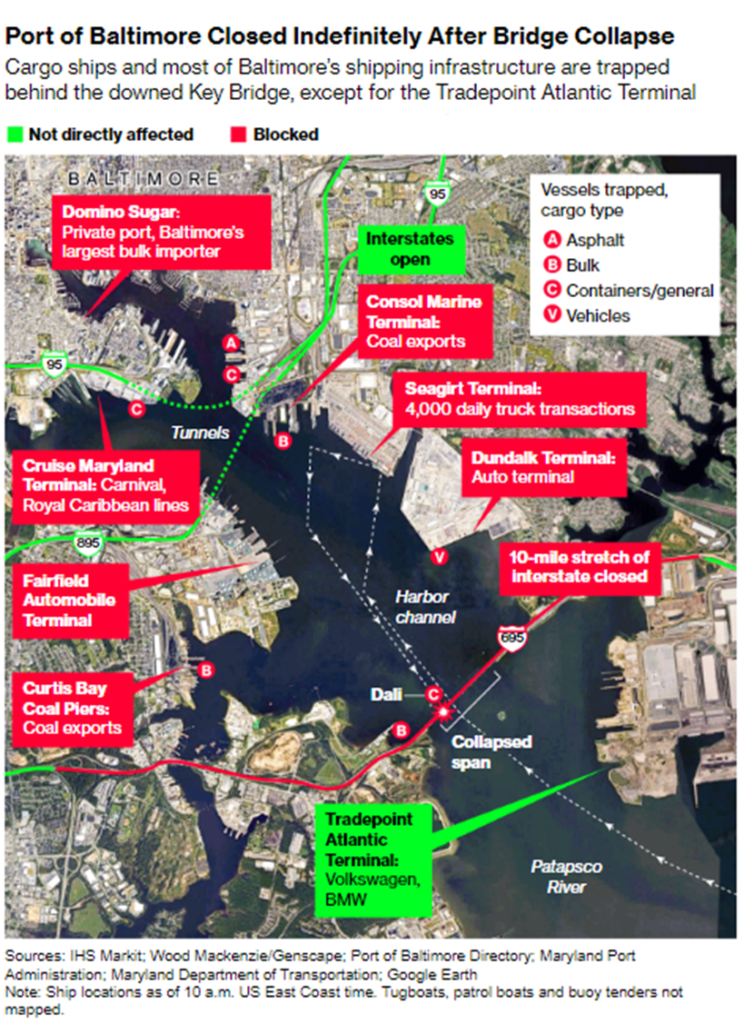
Map developed by Bloomberg