How goes food, fuel, and freight as the Northern Hemisphere pivots toward Spring?
Gaza, Haiti, Sudan, and much of the Sahel and Horn of Africa face life-threatening food disconnects. There are food-related riots in Nigeria. Mozambique seems trapped in a manic cycle of drought, flood, and civil strife. Profound drought in Brazil threatens this year’s harvest (but final yields are still pending). Many Americans complain about food inflation. (More and more.)
According to the US Energy Information Administration, global liquid fuel production in 2024 is forecast at about 102.17 million barrels with this year’s consumption expected to hit about 102.42 million barrels (more and more and more). Natural gas flows have experienced big shifts since February 2022 and big changes remain ahead (more). Most electrical grids are in the midst of a treacherous transition to non-traditional, renewable sources of power generation. On Sunday the Washington Post headlined: Amid record high energy demand, America is running out of electricity. The grid challenge is amplified in plenty of other places.
With both the Suez and Panama canals seriously squeezed, the Wall Street Journal reports, “Around the world, prices are rising for cargo owners. Daily boxship rates along routes from Asia to the Americas more than doubled in January from a year earlier, data from U.K. brokerage Braemar showed. Rates for Asia-to-Europe trips were up 67%. Trade volumes going through the Suez fell more than 40% in December and January compared with the year-earlier period, according to United Nations data.” (More and more.)
At the same time, the March USDA World Agricultural Supply and Demand Estimates includes, “The global wheat outlook for 2023/24 is for larger supplies, consumption, and trade… Supplies are projected to increase 0.8 million tons to 1,057.8 million… the forecast for rice “is for larger supplies, trade, and ending stocks but fractionally lower consumption. Supplies are raised 2.5 million tons to 692.6 million…” (More) “The FAO Food Price Index (FFPI) stood at 117.3 points in February 2024, down 0.9 points (0.7 percent) from its revised January level, as decreases in the price indices for cereals and vegetable oils slightly more than offset increases in those for sugar, meat and dairy products. The index was down 13.8 points (10.5 percent) from its corresponding value one year ago.”
On the fuel front, OPEC+ recently announced production cuts to adapt to flat demand (and alternative supplies). According to Bloomberg, “Ample supplies have anchored international oil prices near $80 a barrel this year, even as conflict in the Middle East disrupts regional shipping… Forecasts from the International Energy Agency in Paris suggest that, with growth in global oil demand slowing and new supply from the Americas soaring, OPEC+ will need to persevere with its cuts all year.” Western Europe is approaching the Spring equinox with natural gas storage facilities sixty percent full. (More) In 2023 Germany supplied more than half of its domestic electric consumption with renewables. On some days this winter over 70 percent of Texas electric consumption has been supplied by renewables. (More and more.)
On March 12 Maritime Executive reported, “U.S. imports are strong and continuing to grow with the outlook remaining positive into 2024. The disruptions in the Red Sea and at the Panama Canal have not impacted the number of containers arriving at U.S. ports with analysts reporting carriers have successfully adapted to the current challenges (more and more). US rail volumes have bounced back from depressed January levels (more). Trucking demand is moderate or sluggish or recessionary (depending on the angle of observation). Earlier this week authors of the Cass Freight Index commented, “While seasonality remains soft in the near term… underlying volumes have shown improvement… It’s been over two years since the first y/y decline of this freight recession, and with destocking playing out and goods consumption rising, we see this improvement as an encouraging sign that a recovery is beginning.” (More and more.)
US Demand continues to surprise and pull tighter on supplies, especially for shelter and gasoline. According to the Bureau of Labor Statistics, “The Consumer Price Index for All Urban Consumers (CPI-U) increased 0.4 percent in February on a seasonally adjusted basis, after rising 0.3 percent in January…. Over the last 12 months, the all items index increased 3.2 percent before seasonal adjustment. The index for shelter rose in February, as did the index for gasoline. Combined, these two indexes contributed over sixty percent of the monthly increase in the index for all items.” (More and more.) Retail sales in Europe are flat. In China Lunar Holiday spending was healthy, but is not expected to persist (more). Japan’s consumers are well into a second year of reduced spending , “the average of monthly consumption expenditures per household for January 2024 was 289,467 yen, down 4.0% in nominal terms and down 6.3% in real terms from the previous year.”
Value pulling motivates pushing value. Demand that exceeds current supply prompts price increases. A little inflation pulls productivity forward. Too much inflation skews, subverts, and confuses authentic value creation. Too little inflation slows economic activity and over time deflation can cut value-creating capacity. A perpetual, challenging (and even fun) game of tug-of-war is where demand and supply are mostly well-matched and supply responds enthusiastically to healthy demand.
There are places where demand or supply has just about given up. It is hard to push an abandoned rope. But in most of the world the current game attracts strength on both sides.

Here’s the February Flow Fitness update
Here’s the January Flow Fitness update
Here is a 2023 year-end overview.
+++
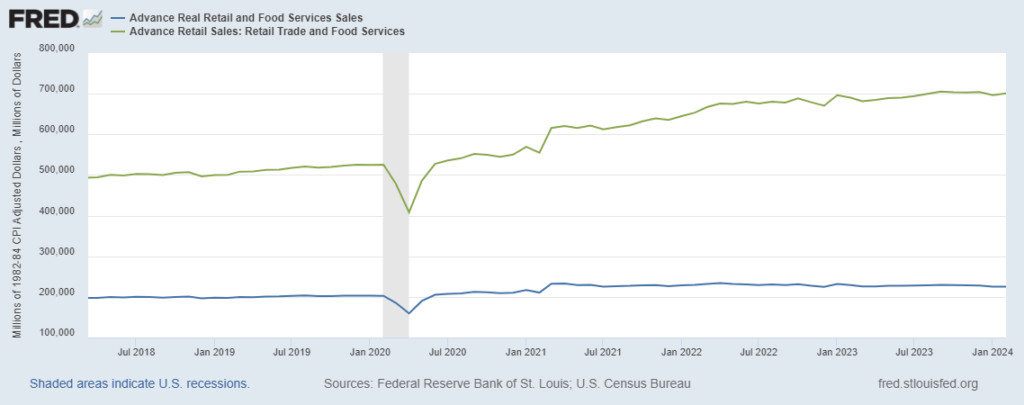
March 15 Update: A few hours after posting the note above the February US retail sales report was released. Economic analyses of the results were mixed. Bloomberg reported, “US retail sales rose by less than forecast after a steep drop to start the year, underscoring concerns about the durability of consumer spending.” The Wall Street Journal noted, “February spending shows the consumer is still robust but not as strong as economists were hoping.” Reuters pulled some details, “Sales last month were boosted by a 1.6% rebound in receipts at motor vehicles and parts dealers. Sales at gasoline stations increased 0.9%, reflecting higher prices at the pump. Receipts at electronics and appliance outlets surged 1.5%. Building material and garden equipment store sales rebounded 2.2%.But online sales dipped 0.1%. There were also decreases in sales at clothing, health and personal care stores. Furniture store sales decreased 1.1%. Sales at sporting goods, hobby, musical instrument and book stores were unchanged. Sales at food services and drinking places, the only services component in the report, rebounded 0.4% after dropping 1.0% in January. Economists view dining out as a key indicator of household finances.” As Bette Midler has suggested, reality depends on distance and angles. In the chart below, the top green line tracks nominal (NOT inflation adjusted total sales) while the blue line is adjusted to “correct” for CPI. In either case, the sustained shift from pre-pandemic patterns is, I think, meaningful to framing and sizing the dynamics of demand and supply. Also relevant, the retail inventory to sales ratio remains lean compared to long-established pre-pandemic patterns.