Reality is superabundant. Where are we looking? Over what time period? To what do we give priority? Lots of different angles to consider. Each month I try to evaluate the current condition of big flows. Here is where I landed in mid-January. Below are three gross indicators. Farther below are are few links to a bit more detail.
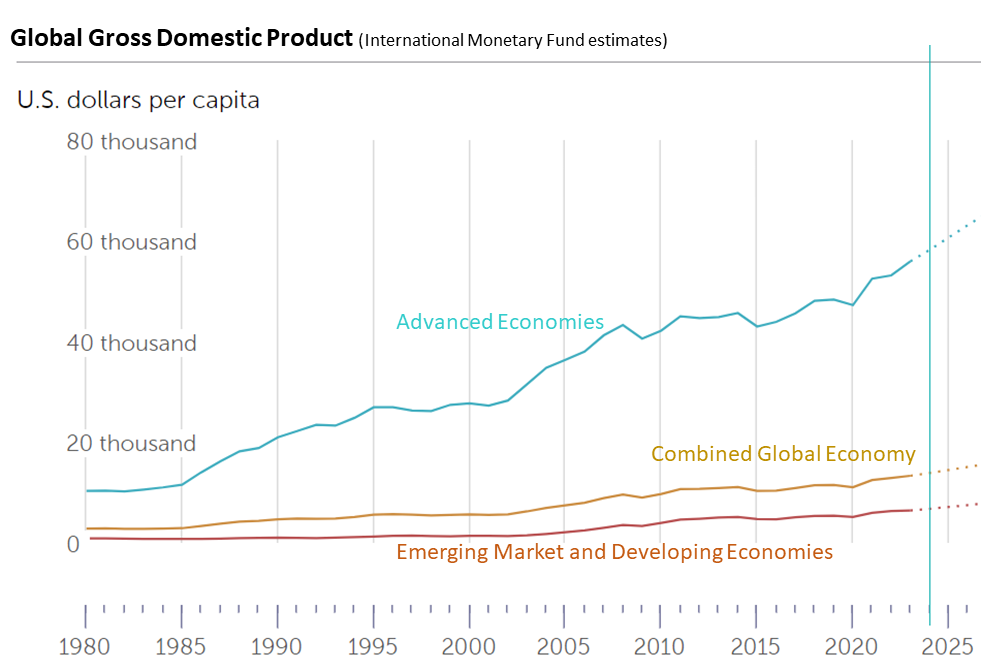
One indicator of Upstream Capacity is Gross Domestic Product. According to IMF estimates and projections, global GDP per capita is continuing to gain. The chart below is rendered per current US dollars. The growth trend is even stronger and more evenly distributed on the basis of purchasing power parity. The rate of growth has, however, recently been very uneven and in many places (e.g., EU and China) much slower than pre-pandemic. (More and more.)
Mid-stream Capacity is clearly sub-optimal. Two major global trade channels are currently seriously constrained, even evolving toward chokepoints. According to the Financial Times, “in the week to February 5, arrivals by container ships in the Gulf of Aden [transiting Red Sea] were 92 per cent down on the average for the first half of December.” Throughput for the Panama Canal is roughly one-quarter below historic averages due to low water. Add-in various trade sanctions, simmering trade conflicts, and the occasional large scale labor action and export flows are clearly choppy. There is plenty of potential for improvement (and the opposite). (More and more.) Still… aggregated flows are currently huge and well-above pre-pandemic trends (see IMF chart through, October 2023, immediately below), even with the softer growth rate noted above (more).

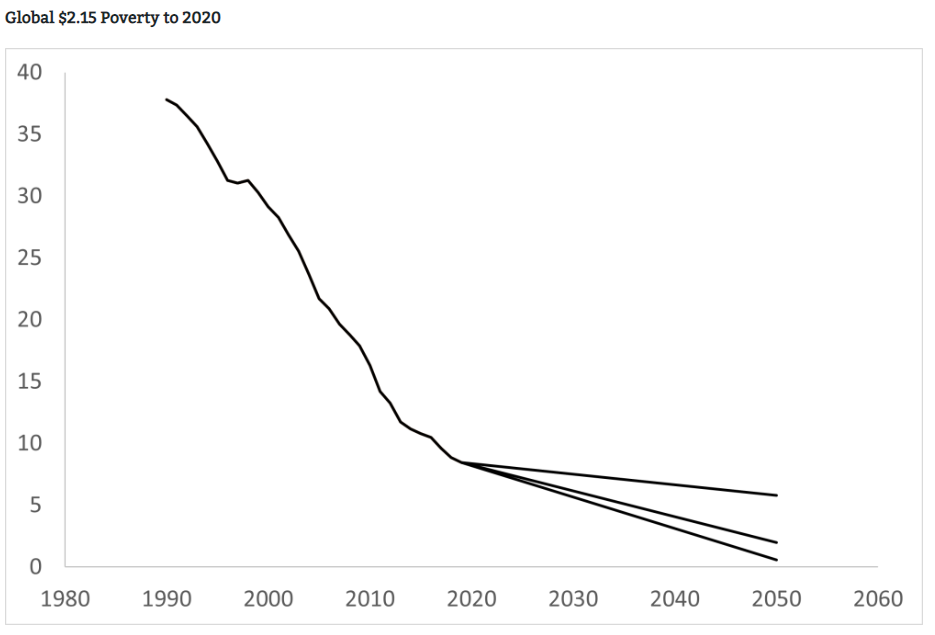
Downstream Capacity: While the population growth rate is slowing, everyday there are still more people on the planet. Given economic growth (see above), these people have an increasing ability to purchase more thereby pulling and motivating more upstream capacity. As regular readers know, I consider pull capacity to be the key to healthy high volume, high velocity supply chains. The strength of US personal consumption expenditures has continued to surprise many — and support significant domestic and global flows. This morning’s release of the January Consumer Price Index suggests this support is unlikely to dissipate soon since the gap between pull and push (once again) exceeded expectations (more). The pull capacity — demand activity (expressed potential?) — of China‘s, Europe‘s, and Japan‘s consumers has disappointed many. But from a Supply Chain Resilience perspective, I mostly perceive sustained abundance of both demand and supply. For example, according to China’s National Bureau of Statistics, “In 2023, the nationwide per capita consumption expenditure was 26,796 yuan, a nominal increase of 9.2 percent over the previous year, and the real increase of 9.0 percent after deducting price factor.” 2022 was not a banner year of China and NBS is not always a reliable source, but here’s a positive — if not stellar — growth rate (more). Just in this century the percentage of people living in extreme poverty has fallen from 3-in-10 to a bit less than 1-in-10 (more and more and more). Projections for the future are shown below. Despite — of perhaps, because of — persistent increases in demand, supply has — usually, in most places, for most products — been able to keep up. For example, even with all the midstream constraints noted above, the January FAO Food Price Index fell once again.
Complementing — and mostly reinforcing — these mega-macro indicators, the US Department of Agriculture continues to forecast strong 2024 harvests, especially for global wheat and rice crops. Despite geo-political turmoil and very material flow complications (see above), natural gas and most fossil-fuels continue to be well-supplied at affordable prices. Freight prices are higher, but this has preserved (even reclaimed) freight capacity needed to fulfill the sort of robust demand described above. Where food, fuel, and freight can flow, much more is possible too.
This is not an MRI, but these fitness indicators seem surprisingly good to me. Given very real perils all around, we ought not underestimate systemic risks. But neither should we discount the strength and agility outlined above.