[This is the second of a two-part post on proportional risks involving high volume, high velocity flows in contemporary supply chains. Please see the first part at Pfizer: proportional and functional risks.]
+++
Massimo Franceschetti — channeling Joseph Juran — makes a distinction between the “trivial many” and the “vital few” nodes in a network. I encourage similar attention to links.
Without huge effort it is usually possible to identify a small number of sources or movers (or routes) or consumer characteristics for a Pareto Proportion of demand and/or supply. Pareto noticed that there is a recurring tendency for a small portion of any distributed set to generate disproportionally high outputs for the whole set (more). Roughly eighty percent of Pareto’s peas came from barely twenty percent of his pea plants. One-fifth of all US grocery distributors are responsible for over four-fifths of grocery distribution. Only three US pharmaceutical distributors are responsible for more than three-quarters of pharmaceutical flows. Only three US maritime ports handle more container volume than all the rest combined.
An awareness of Pareto Proportions often answers important questions of who, what, and where, but in isolation these insights seldom explain the how and why of these concentrations. Some of how and why is related to characteristics of network centrality.
Origin implies movement. Destination requires movement. Nodes are usually intersections or, at least, once-upon intersections. A vertex of zero degree has no influence. An edge or arc is a boundary between, verging between, and usually both. A link is a connection, often one of many in a concatenation. Yet in network science literature an edge is typically treated as an incident of a vertex. Edges emanate from vertices. Our path emerges from one place and concludes in another place. We start here, look there, then we consider connections. We tend to focus on places more than on paths.
While this is one valid angle on reality, as a supply chain guy I am inclined to place much more emphasis on the simultaneous reality that we move. Network concentrations most often form from edges accumulated. Origin to destination is to suture steps between here and there. We close gaps between. The sometimes rough, random, ragged path that connects here to there is regularized with use. Edges can grow in magnitude and assume a general direction becoming flow channeled and vectors measurable.
Where many vectors meet, mathematicians speak of eigenvectors and eigenvector centrality (more). The German eigen is most commonly translated by the English “own”, but there is nuance in the German pointing beyond possession to being innate, essential, characteristic. Does the vertex own each vector or do converging vectors own their vertex? Jennifer Goldbeck explains:
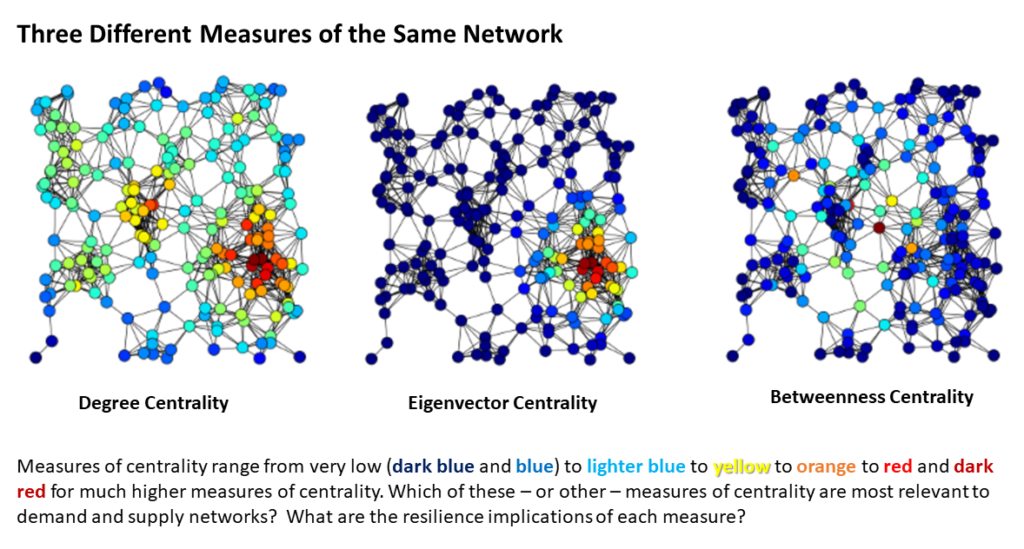
The main principle is that links from important nodes (as measured by degree centrality) are worth more than links from unimportant nodes. All nodes start off equal, but as the computation [movement?] progresses, nodes with more edges start gaining importance. Their importance propagates out to the nodes to which they are connected. After re-computing [moving? flowing?] many times, the values stabilize, resulting in the final values for eigenvector centrality. [Bracketed questions are mine, not Dr. Goldbeck’s.]
Contemporary demand and supply networks also demonstrate outcomes consistent with Betweenness Centrality, a measure of which nodes have the shortest paths between other nodes. Betweenness can reveal the most optimal hubs in a complex network. (More, including the three graphs shown below.)
When the Pfizer Rocky Mount facility — or the Abbott plant in Sturgis or the Colonial Pipeline or the Port of Jacksonville (or most ports) or the I-95 (or I-5) corridor — has a problem, my risk assessment is almost always shaped by a sense of network centrality. What proportion of flows for my network-of-concern depends on the node/channel having problems? To serve fuel flows between Atlanta and Baltimore (and Knoxville and places in-between), the Colonial Pipeline is an irreplaceable Giant Component. Within 48 hours it was clear enough that temporary loss of the Rocky Mount node would have critical product-specific consequences but in terms of the sterile injectable market (much less the whole US pharmaceutical network), even when fully operating, the Rocky Mount node would be yellow or orange (not red or deep red) on the network mapping examples below.
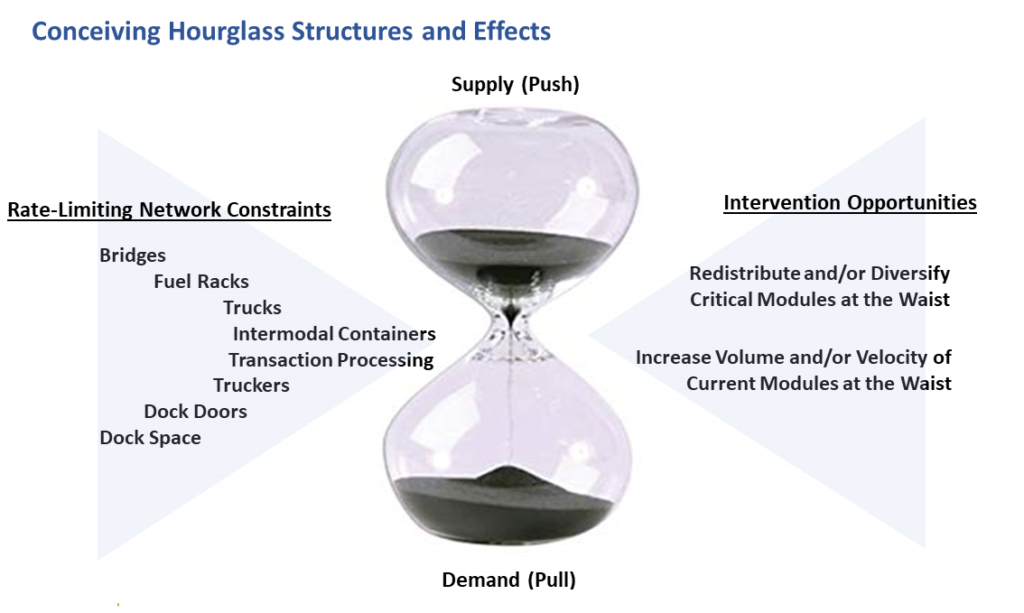
One more angle of assessment: In my experience contemporary high volume, high velocity demand and supply networks are especially predisposed to Hourglass Effects. Sabrin and Davrolis explain, “Many hierarchically modular systems are structured in a way that resembles an hourglass. This “hourglass effect” means that the system generates many outputs from many inputs through a relatively small number of intermediate modules that are critical for the operation of the entire system, referred to as the waist of the hourglass.”
I originally perceived — and still perceive — that the Pfizer Rocky Mount facility is a good candidate for hourglass effects. Various materials are gathered in a shared, quality assured space, staffed by technologists, scientists, logisticians, and others with overlapping expertise, to produce a wide variety of specific — but category-similar — outputs (e.g., sterile injectables) by applying a small set of “modular systems” across sourcing, making, and moving outputs.
These modular functions at the waist (I actually prefer: neck) of the hourglass are reasonably common in contemporary demand and supply networks. Grocery distribution centers and maritime container ports and many oil refineries are confirmed sources of hourglass effects. The modularity and adaptability of these functions are fundamental to the efficiency and (in most cases) resilience of contemporary supply chains (see the last page of Sabrin and Darvolis to learn more about why). But when these modular functions receive a direct hard hit there is also a chance that the whole hourglass may shatter (more, see page 113). Below, in the second image, are some personal notions of hourglass effects.
These three risk lenses — Pareto Proportions, Network Centrality, and Hourglass Effects — are obviously not exhaustive. These are personal prescription “safety glasses” that I keep handy in case of potential catastrophe. They help me see through smoke, flame, flood, and worse. Last Saturday when my risk assessment related to Rocky Mount suddenly plummeted from a flood alert to fixing a leaky pipe, friends and colleagues were surprised. I hope this helps explain what I perceived and why I pivoted.