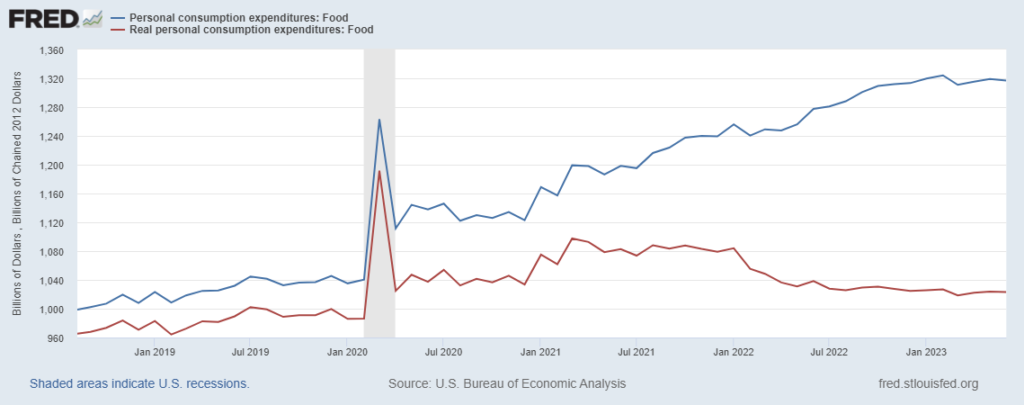
In January 2023 American consumers spent 1025.6 billion inflation adjusted dollars on Food-At-Home. In June we spent $1023.2 billion (see red line on the chart below). The take-away from May’s PCE still applies: “For most of the last year our real, inflation-adjusted expenditures for food have been flat or falling… and as a result, food supply chain dynamics have been much more predictable. Current production and distribution capacity has been well-matched with demand.”
Beyond Food-At-Home expenditures, the Bureau of Economic Analysis reports, “Personal income increased $69.5 billion (0.3 percent at a monthly rate) in June… Disposable personal income (DPI), personal income less personal current taxes, increased $67.5 billion (0.3 percent) and personal consumption expenditures (PCE) increased $100.4 billion (0.5 percent). The PCE price index increased 0.2 percent. Excluding food and energy, the PCE price index also increased 0.2 percent… Real DPI increased 0.2 percent in June and real PCE increased 0.4 percent; goods increased 0.9 percent and services increased 0.1 percent.” (More)
The Wall Street Journal offers this summary of recent economic data, “The U.S. economy grew solidly last quarter. Consumer spending, the primary driver of economic growth, rose in June for the sixth consecutive month and is increasing faster than inflation. The labor market has cooled this year compared with 2022 but remains on sound footing.” (More and more.) The Washington Post Editorial Board noticed, “Fed Chair Jerome H. Powell used the words “normal” or “normalization” nine times in his news conference Wednesday to characterize everything from supply chains to the job market.”
