Month: January 2022

Success (or avoiding the worst)

[Updates through February 17 are included below.] The US grocery supply chain continued to deliver most of what was wanted to most consumers in most places through the worst of omicron. There was significant employee absenteeism. There was increased friction in several flows. Some shelves were empty. Velocity was highly variable depending on day and place, but overall volumes were close to 90 percent of typical.

I may never see data that will confidently confirm or deny, but based on a small amount of quantitative data (mostly IRI and Federal Reserve) and what folks with eyes and ears on food flows tell me, I now perceive that grocery supply was probably most mismatched with demand between about January 12 and 19. There was (is) considerable regional/local variation. Less populated, less wealthy places farther away from grocery distribution centers generally had more stock-outs.

Demand was higher than January 2020. Depending on product category, demand was six (produce) to thirteen (bakery) percent higher.

There were (and are) sourcing and production problems. Food processors saw a significant increase in worker absenteeism. Trucking, already substantially over-subscribed, had its share of sick drivers. There were also increased delays in loading and delivering groceries because of lack of personnel on both ends of this flow.

It is my strong impression that there has been more product available than the ability to move product. This friction exists across the whole network, but has been especially difficult between distribution centers and retail outlets. Distance and square footage of moving stock is a (mostly) fixed constraint on push. But in mid-January cycle times for operating vans were extended as it took much more time to load and unload. Then add six to thirteen percent increased pull. Faster pull + slower push = more empty slots on shelves. [This bottlenecking of midstream to downstream is a recurring characteristic of network friction well beyond groceries-in-a-pandemic.]

If you have been reading this space since early December, you know I was concerned about the potential for the grocery network in some major trading area(s) suddenly shutting down (here and here). This did not happen.

Flows persisted because consumer-pull did not experience a sustained sharp-surge (e.g., more than twenty percent for eight consecutive days or more), retailers were early implementing effective demand-management methods, and the US grocery sector is a robust, resilient system that is predisposed to persist. Over the last month, I perceive that this predisposition included thousands of workers continuing on the job when they were probably covid positive and certainly when they had been exposed. Given omicron’s contagious reach (more), I find it hard to imagine most food processing or distribution center or retail workers having not been exposed. Given constraints on testing, the virus usually comes and goes without confirmation.

In December I contributed to a process to facilitate flows as safely as possible given the risk of omicron. Some positive steps were taken. In my judgment these efforts had almost no substantive effect. Timing, communication, and implementation were too ponderous compared to the speed of omicron.

What mostly kept food flowing in January has been the independent actions of millions who decided — mostly — to buy what they needed and not much more and to show up to work despite the risks. We are fortunate that omicron’s morbidity is much less than some prior variants and that substantial proportions of the population have been effectively vaccinated. We are fortunate that high volume, high velocity networks tend to be so stubborn.

+++

What happened and did not happen with food flows in January will continue to be ambiguous. I probably will continue to blog on this topic. I will also try to aggregate relevant data outputs below. I hope for some new data even later today.

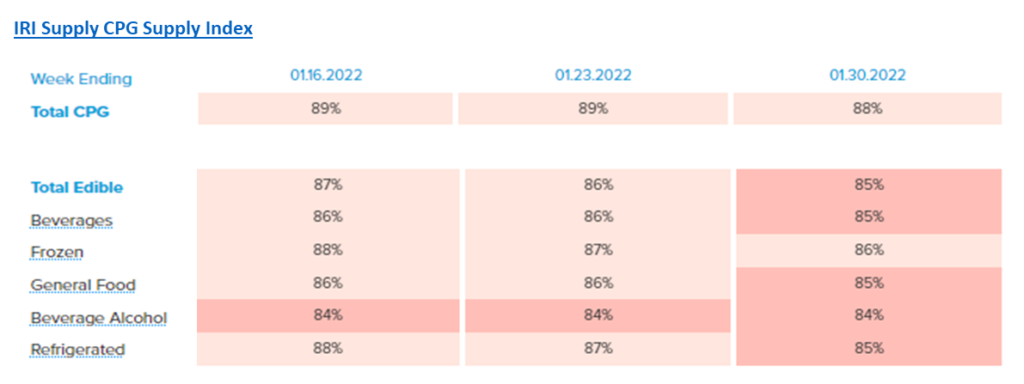
January 31 mid-afternoon update: Today IRI has released updates for its CPG Supply Index for the last two consecutive weeks (ending on January 23 and January 30). This morning I speculated that the worst grocery flows were probably experienced between January 12 and 19. IRI’s assessment finds that that in-stock levels of edible categories declined one percent each for each of the last two weeks. I could be one week off or store inventory could lag flow (but by a week seems long to me). In either case the second-half of January had slower grocery flows than anyone wanted.

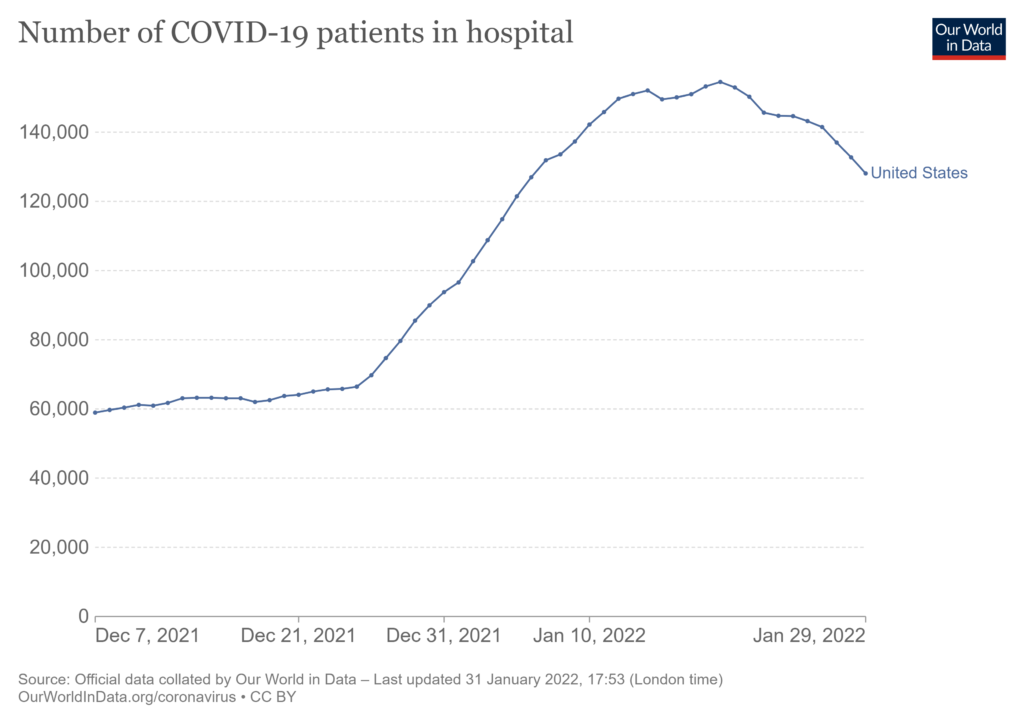
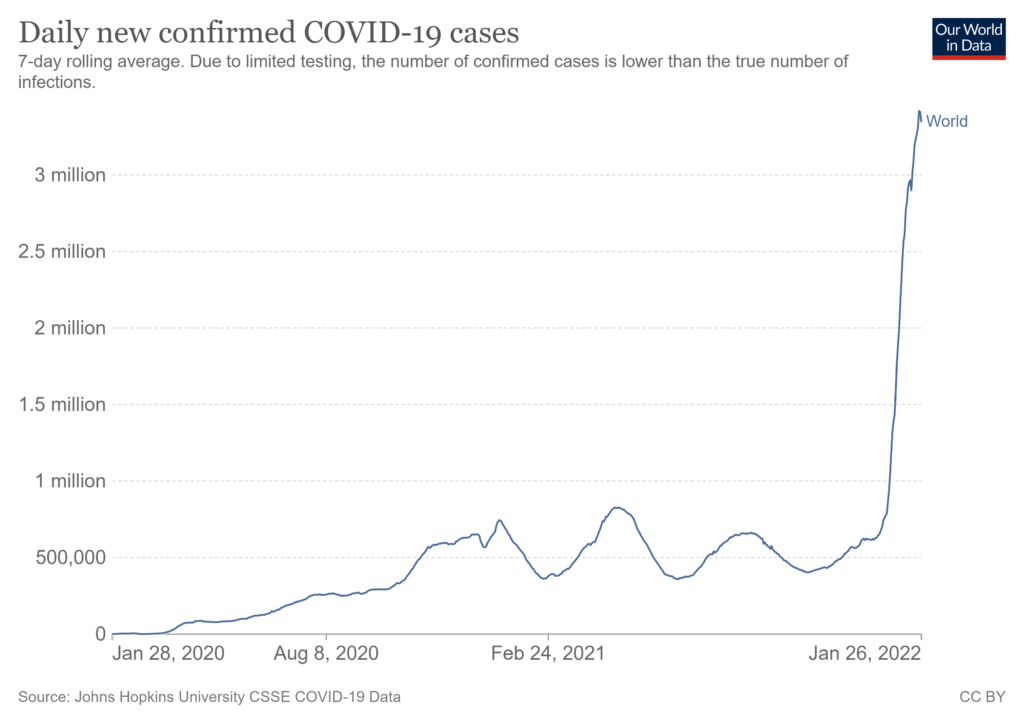
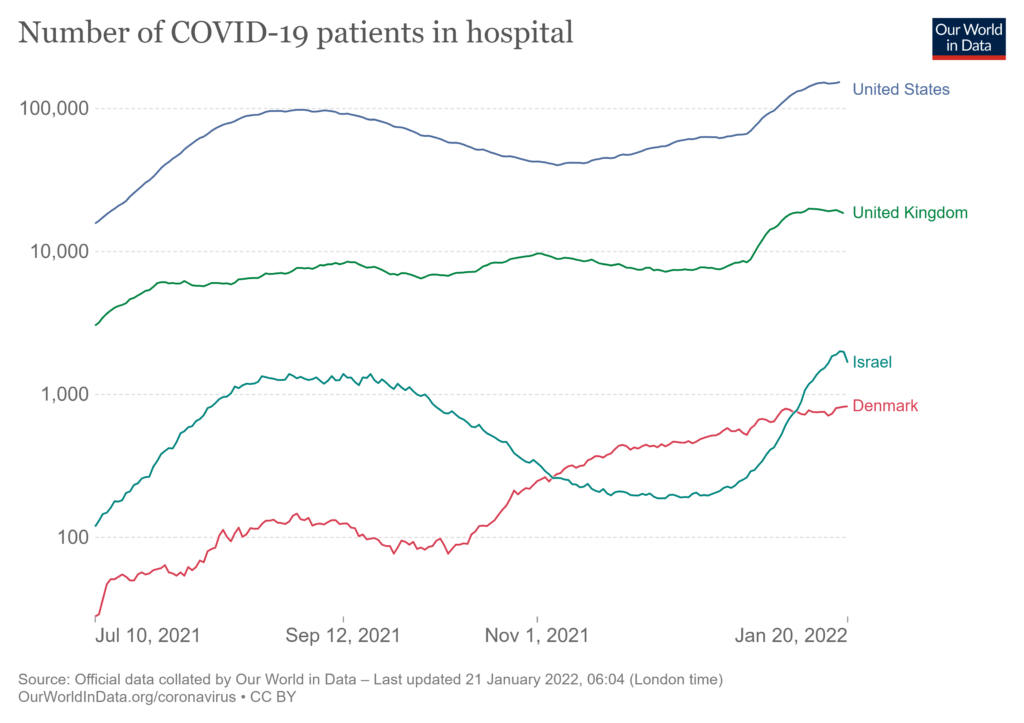
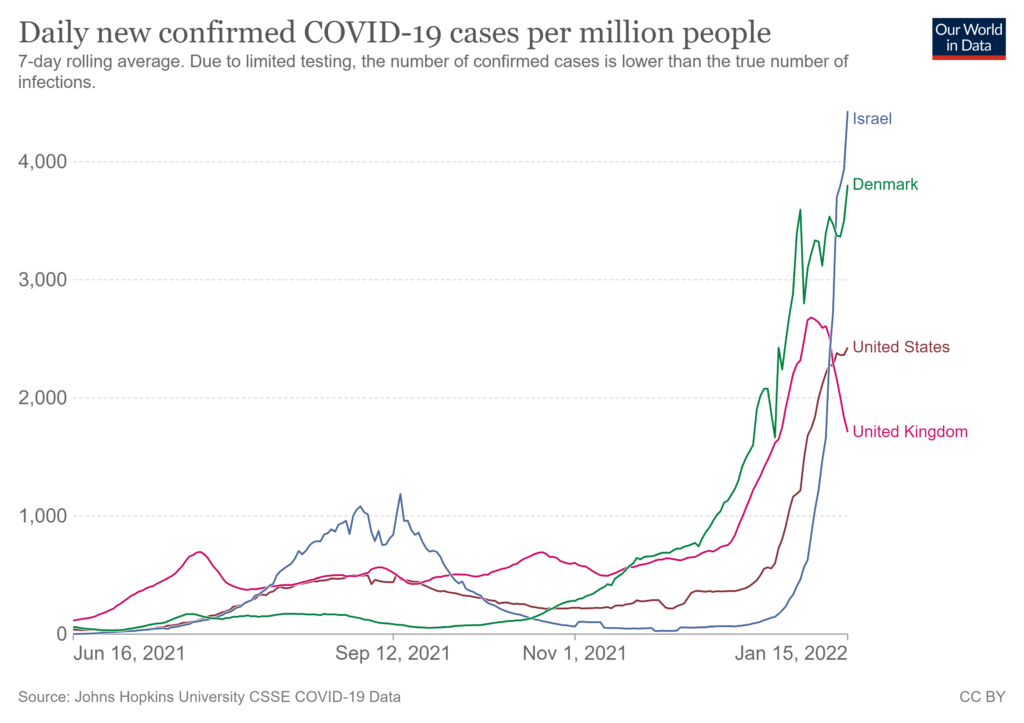
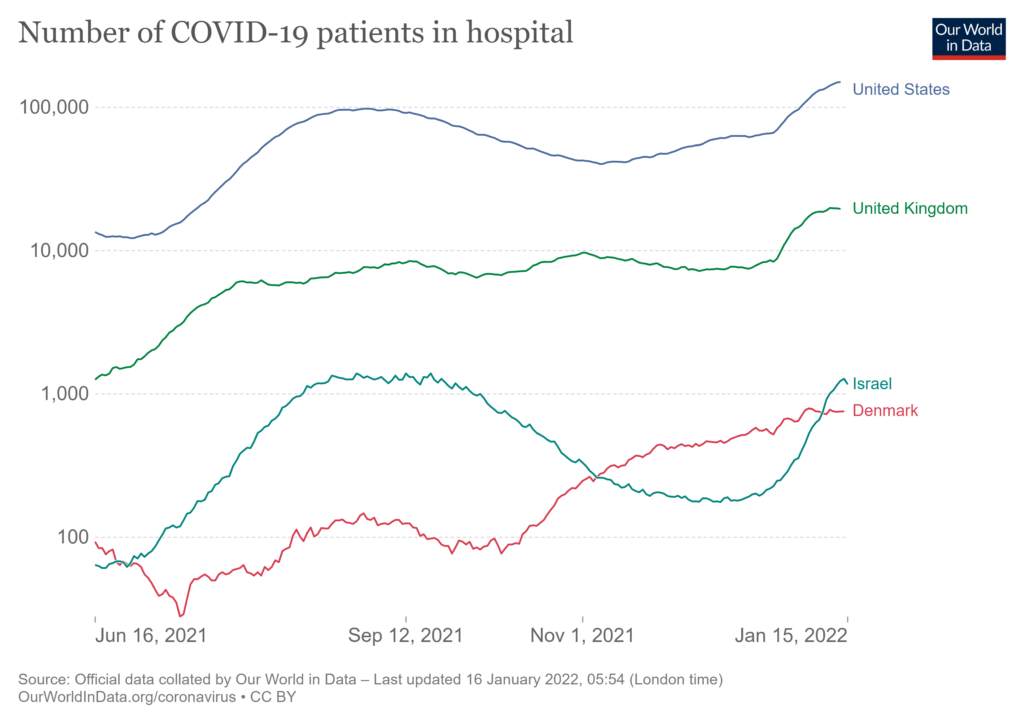
Below is the actual number of US hospital admissions for which covid has been confirmed. The omicron surge basically started with Christmas and peaked on January 19. Did workplace absenteeism coincide with or lag this indicator of morbidity?

The December job reports (released on February 4) include clues to how flows kept going in January. Job-leaving in January increased to 952,000 and 1.8 million Americans reported they were “prevented from looking for work due to the pandemic.” Given the omicron surge, these were not surprising outcomes. But despite this serious friction, new January hires were a surprisingly strong 467,000. According to the Bureau of Labor Statistics:

Employment in transportation and warehousing increased by 54,000 in January and is 542,000 higher than in February 2020. In January, job gains occurred in couriers and messengers (+21,000), warehousing and storage (+13,000), truck transportation (+8,000), and air transportation (+7,000). All four of these component industries have surpassed their February 2020 employment levels, with particularly strong growth in warehousing and storage (+410,000) and couriers and messengers (+236,000). 

Absenteeism was up (how much is still up in the air), but businesses continuing hiring. I wonder if worries over absenteeism and other workforce constraints may have actually encouraged more new hiring?

February 7 update: The Sunday Washington Post has a good piece (posted online on Saturday) with retrospective color-commentary on the workforce context during the December-January omicron surge: Despite Omicron Surge, Businesses Desperate to Find and Keep Workers.

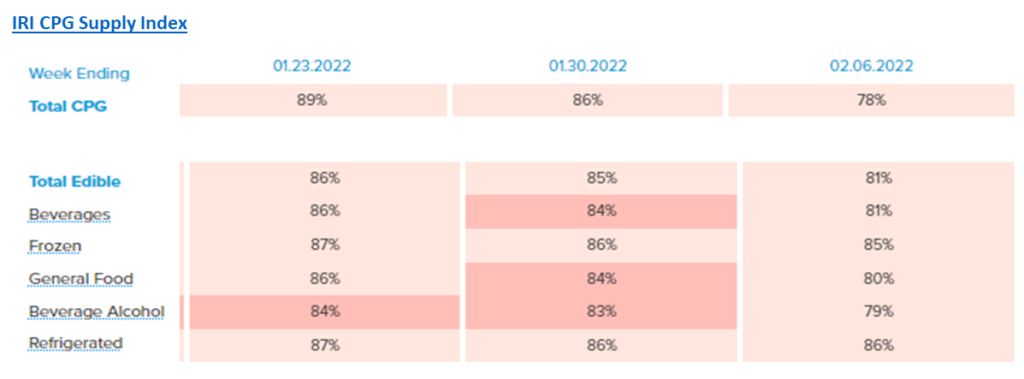
February 9 update: The IRI CPG Supply Index for the week ending on February 6 shows stock-outs continuing and, in some cases, worsening. The four percent drop in General Food was especially sharp. Stock-outs in non-edible may suggest decisions at the distribution level to use available assets to deliver food instead of beauty products (pure speculation).

Demand has continued strong since Christmas. Year-Over-Year pull for General Food has been up 7 to 8 percent since mid-January (and 2021 demand was about 7 or 8 percent higher than 2020 demand). But while demand sets the stage, during the first week in February a huge snow and ice storm impacted populations (and roads) from Texas to New England, spurring pre-storm stockpiling and slowing replenishment. Already low inventories were partially the result of omicron worker absenteeism, but the most recent plunge in available produce has a more traditional, seasonal cause.

February 15 Update: The Bureau of Labor Statistics is confirming/clarifying omicron’s impact on January flow capacity. I also comment on this in another post.

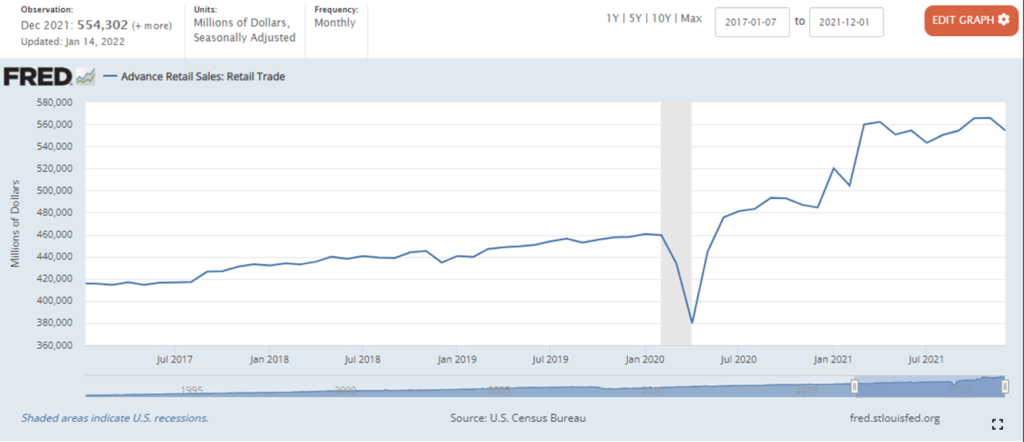
February 17 Update: The Census Bureau’s Pulse Survey (experimental) finds that during the period January 26 to February 7 a total of 7,772,708 employed Americans were not working because they were experiencing covid-related symptoms or caring with someone with covid symptoms. Another 5,049,124 were caring for children not in school or daycare. Another 3,016,462 were not working because they were concerned they would be infected or spread the coronavirus. For the period December 29 to January 10 the numbers for these three categories (in the same order) were: 8,753,923, 5,327,065, and 3,216,749. A Pulse Survey was not conducted during the two weeks January 11-January 25. I’m guessing absenteeism peaked during the intervening data-darkness. It is also worth recognizing that while increased absenteeism was constraining supply capacity, retail demand hit a new high (more). In the grocery sector, food sales did decline from December (Christmas) totals, but January 2022 sales were $70,010 million compared to November’s $68,948 million and the year-over-year comparison to January 2021 was 7.7 percent higher compared to $64,656 million. Yikes. I am just amazed at the power and persistence of grocery demand this late in the pandemic.

Strong demand persists

The Bureau of Economic Analysis estimate of personal income and outlays for December finds another increase exceeding $39 billion (0.2 percent) in Disposable Personal Income. The potential for continued strong consumer demand is mitigated by a 0.4 percent increase in the Personal Consumption Expenditure (PCE) price index. Inflation is playing its role. But, please see chart below, there are still about 500 billion more (chained 2012) dollars available to spend last month than in December 2019. Two Decembers ago, Americans spent $10,264 billion on services, $3044 billion on non-durable goods, and $1545 billion on durable goods. Last month’s expenditures were $10,759 billion on services, $3560 billion on non-durable goods, and $1988 billion on durable goods. Those proportional shifts in buying goods require similar shifts in supply chain operations. December’s level of demand is much better calibrated with supply capacity than demand expressed in the first quarter of 2021. But, still, fulfilling one-fifth to one-quarter more pull is non-trivial. It is — has been — really tough.

Related media coverage: Bloomberg, Financial Times, Wall Street Journal, and Reuters. Additional context on GDP growth and such here and here and here.

Tuesday, January 28, 2020

Two years ago this morning I answered a client’s questions about supply chain implications related to a novel coronavirus that had been identified in China. Here are some excerpts.

+++

The current epidemic in China is disrupting manufacture of products consumed in the United States.  [Client] has expressed specific concern regarding healthcare products.  There will be a substantial slowdown in Chinese manufacturing and related activity through at least February 8.  An extended period of disrupted commercial activity is possible.  While spot shortages of individual products are possible, overall US healthcare inventories should be sufficient for normal seasonal demand through late February.  If Chinese manufacturing and/or transportation sectors experience extended disruption, the United States is most likely to experience systemic shortfalls in the supply of medical consumables, followed by selected medical devices, nutritional supplements, and generic drugs.  If the novel coronavirus becomes epidemic in the United States significant disruption of demand and supply networks – including but well beyond healthcare – is likely.

According to the World Health Organization, as of January 27 there were 2798 confirmed cases worldwide.  According to DXY, a respected online physician forum in China, there have been 106 deaths associated with the disease.  Measures intended to contain the disease have suppressed manufacturing, transportation, and other commercial activities in most of China.  The target of 2019-nCoV can be characterized as all potential hosts, including all humans. The force of this coronavirus is not yet clear.  To date, impacts on demand and supply networks have been entirely the result of measures taken to control the virus, not a direct result of the virus or even the secondary effect of 2019-nCoV on the population. Official quarantine operations – combined with nervous buying and consumer hoarding – have effectively collapsed ordinary “last-mile” supply chains across much of the central Yangtze River Valley serving more than 55 million people.  There is also evidence, however, that long distance transshipment through the most impacted area is continuing by road, rail, and river.

More than sixty percent of confirmed cases continue to be located in Hubei province (especially Wuhan City) in Central China.  As of January 27, the CDC is reporting five confirmed cases and seventy-three pending cases in the United States.

It is too early to draw firm conclusions, but to date confirmed fatalities have been concentrated in individuals with significant preexisting vulnerabilities. Actual population effects will depend on the virulence of 2019-nCoV, something that is not yet fully understood.  In terms of effect on demand and supply networks, the population’s perception of virulence can be even more consequential than scientifically demonstrated effects.

US healthcare sources report that the United States is dependent on Chinese manufacture of “medical consumables” (all FDA Class I products and some Class II products). Using 2016 data, the Boston Consulting Group found that, “China dominates low-cost medtech manufacturing” with up to 78 percent of world capacity at the low-end. This includes products such as sanitary gloves, disposable syringes, surgical masks, gauze, serum collection tubes, etc. China has a strong export presence in FDA Class II medical devices, such as infusion pumps, pregnancy test kits, and catheters. The Chinese biochemical industry is a significant source of the Active Pharmaceutical Ingredients (APIs) needed to manufacture a wide range of pharmaceutical products. China is also a major source of generic drugs for the global market.

It is worth highlighting that there are structural and seasonal factors involved in the current status of US inventories for many healthcare products sourced in China.  Because Chinese products are concentrated at the lower end of value-chains they mostly utilize less expensive container shipping.  As a result, both manufacturing and transportation realities impose long lead-times on these supply chains. Further, there is a recurring annual slow-down of economic activity in China associated with the Lunar New Year.  Every year US distributors schedule procurements to reflect supply constraints associated with this holiday.  In 2020 this constraint was already anticipated for the period, roughly, from January 21 to February 1.  As noted above, this manufacturing “holiday” has essentially been extended through the first week in February.

If the novel coronavirus becomes epidemic in the United States and if mortality and morbidity rates for this virus continue to be modest, then the principal risk to demand and supply networks is likely to be unsustainable surges in demand reflecting consumer uncertainty regarding the resilience or integrity of local supply chains. This has already been observed in last weekend’s surge in demand for facemasks in New York City.  Similar behavior has been observed in central China impacting the retail food supply chain.  Nervous buying or hoarding tends to break-out in rather specific geographic – and population – clusters.  If the underlying uncertainty can be quickly and effectively countered in the initial outbreak, this can amplify wider confidence in supply chains and serve to discourage further demand surges.  But once any extended demand surge exceeds cycle-time of distribution capacity, retail shortages are inevitable, and retail shortages serve to inflame increased nervous buying and hoarding.

+++

Two years later:

The client was asking me for more after I had sent them an (unsolicited) January 24 note that included, “Hoarding has started in China.  Hoarding will crash supply chains worse than most cyclones or seismic events.” In many ways consumer behavior (demand management) has remained my “white whale for the duration of the pandemic; including earlier this month as I wondered what a combination of omicron-related absenteeism and nervous buying could do to US food flows. This month consumers were much more restrained than in March 2020.

My rhetoric is restrained. I was not explicit regarding the potential outcomes of the potential shortages in those product categories so quickly listed. Subsequent client notes assumed a more urgent tone. Within a few weeks billions of dollars were being spent to expedite flows of medical consumables and much more.

I’m not ready — and this blog is not the place — for a detailed after-action. We are not yet post-pandemic. Covid deaths continue to surge. But in the context of the early note above, network fundamentals have been clear enough. Demand leads, supply follows. Flows reflect distance and discontinuities between demand and supply. Emergent implications for flow are usually, at least strategically, clear enough.

Except that — nothing is clear to most of those who don’t work the flows day-in and day-out. Inaccurate assumptions have persisted. Decisions have been undertaken or neglected that had profound impacts on flows — typically with little or no thought given to flows. Decisionmakers (corporate, political, and otherwise) have been surprised again and again by excess demand or reduced capacity or increased congestion, all of which were predictable outcomes of their decisions. In May 2020 a colleague clearly called out diminished US freight capacity as an emerging (accelerating) cause of concern. Very little attention was given to this systemic constraint until well into 2021. The constraint was observable. The constraint was articulated. Mitigation was possible, especially with early action. Most mitigation measures were not undertaken.

There is an epistemological problem involved. We are much better knowing how-to-describe than knowing how-to-do something about what is described. In some ways, certain kinds of knowing actually seem to suppress — or at least complicate — doing. This disconnect is becoming a new White Whale for me.

(Over) Simplification of Flows

As outlined yesterday, many minds are now working to more accurately characterize supply chain flows. At the enterprise (species) level a multi-billion dollar tracking industry is well-underway. At the ecosystem level maps and models are proliferating. We have probably progressed beyond Ptolemaic methods. But we have not yet achieved (it seems to me) even the rough accuracy of Gerardus Mercator.

But because others are diving deep into complex, data-driven, algorithmically shaped “objective” forms, I can — we can — bring to these increasingly rigorous methods a self-aware reductionist discipline.

To meaningfully consume and digest the rich streams of information now being made available, it is helpful to deploy my own heuristic, my core — even simple-minded — notion of how the world works. In my experience, judgment (especially under duress or urgency) is more likely to recognize external correction, clarification, or correction when externalities are being filtered through a set of lenses for which both strengths and weaknesses are well-known.

I am interested in demand, supply, and movement that matches supply with demand. These three factors are wickedly interdependent and on a global scale beyond my capacity to precisely comprehend. But it helps if I can develop a mostly accurate sense of overall scope, scale, direction, and duration.

To anticipate US flows, I am interested in both domestic and global behaviors. There are important feedback loops each way. Monthly updates are usually the best I can get (I would prefer nearer-term). For demand I prefer financial indicators of money being spent and/or available to be spent. For supply and related movements, I prefer physical instead of financial volumes. But inflation-adjusted financial volumes are often the best I can get. I don’t expect any source of data to be entirely accurate; I am especially skeptical of China’s official data sources.

Is demand increasing or decreasing? How rapidly which way?

How well or badly is supply capacity calibrated with demand?

Are movements of goods well-calibrated with demand (or not)?

Household disposable income is a helpful measure of recent and potential flows. Here is a delayed measure for the G7 nations (from the OECD). Immediately below is the monthly US measure updated in December for November 2021. There has been considerable volatility in the weeks since. The December results should be released tomorrow (January 28). For me, this is a crucial forward leaning indicator. Supply organizes around demand.

Domestic measures of industrial production are helpful. I am especially attentive to food and beverage manufacturing. But given the significant role of global supply in satisfying US demand, I want something that tells me about total flows serving US consumers. Here’s a new quarterly measure from the United Nations Industrial Development Organization. Too generic? Too unwieldy? Potentially. But again: I want a lens that helps me contextualize other more detailed sources. Immediately below is UNIDO’s manufacturing index organized around a pre-pandemic (early pandemic?) baseline.

Yesterday I outlined the Kiel Trade Indicator. This is a great resource for assessing how well globally sourced goods are moving toward US demand (or other demand). But given my US focus, I am even more interested in the ability of trucks to deliver. There are many measures (more and more). Below is one authoritative monthly measure: the Cass Freight Index of Shipments.

Using the three “lenses” charted above, I discern that during much of 2021 US demand was much higher — even one-fifth higher — than pre-pandemic demand. Current and potential US demand remains a small percentage higher, but is now much more coherent with pre-pandemic patterns. Global supply capacity has expanded since 2020, especially in China. This supply capacity was insufficient for the early 2021 surge in demand, but is mostly sufficient for current US demand. Post-pandemic US freight capacity has not been much different than pre-pandemic capacity (even a bit less than 2018 capacity). So… 2021’s disequilibrium of demand and supply, including flow congestion and related delays makes sense. Now that demand seems to be softening flows should find much less friction, especially once current congestion is cleared. This is more a hypothesis to test than a confident conclusion. But having this over-simplified view helps assess and digest more nuanced measures being generated by more sophisticated analyses. When this simple three-factor test is contradicted by any of the multi-factor indices mentioned yesterday (and others), the divergence should help focus critical attention — and, if necessary, an informed decision — where the most good can be done.

+++

The preceding supposes a network predisposed to equilibrium. This is a fair expectation of mature networks with high volume, high velocity flows, such as most supply chains serving the United States. I also perceive that punctuated equilibrium is an equally reasonable expectation.

The pandemic has been such a punctuation. Further exclamation marks, periods, and ellipses are certain. The impact of omicron on zero-covid China could be an extended grawlix, painful for the whole world. The potential mutations emerging from the current surge of infections and re-infections is at least worth a triple question-mark. So, below is a fourth chart that I will continue to consider. Geo-political punctuations (e.g., Ukraine or Taiwan) are also possible. I don’t have a chart for those…

More on big flows

US demand and supply networks are huge. Meaningful network analysis must include flows arriving from outside the United States and departing flows cannot be ignored. Several prior posts have outlined efforts to track this domestic “watershed” (or more accurately watersheds– plural). I am happy to report that better minds (and more time) are being dedicated to this task.

Oxford Economics’ Supply Chain Stress Tracker was started in September (background) to assess US supply chains. There have been monthly updates. Below is the year-end summary picture.

On January 21 Flexport launched its Logistics Pressure Matrix. According to the authors and analysts:

This report considers eight categories of measures with a view to providing a sequential assessment of the demand for logistics services and measures of the use of logistics networks. For each we’ll provide key characteristics of the metrics, reasons for tracking them, their current values and available alternatives. On the demand side we’ll outline measures that cover aggregate, current household consumption as well as expectations from consumers and manufacturers as to the outlook for future demand. We’ll then look at retail sales and inventories-restocking of the latter is a key determinant of future international trade flows. The handling of freight—both inland and at the major seaports—can provide a direct sense of whether network usage is rising or declining. Shipping rates provide a market participant’s view of current and future congestion. Finally, we take an alternative look at Flexport’s measure for ocean shipping times to determine whether there are signs of logistics networks becoming less congested.

I am impressed. I am especially encouraged by Flexport’s attention to demand. What I see in this initial report makes me want to keep coming back for more. Here’s the link again and here is where they promise to update.

Global flows are even more complex. Many efforts are underway to map, measure, understand, anticipate, and even predict probable future flows. Flexport will build out for other regions what they have started for US flows. The Global Supply Chain Pressure Index developed by a team at the Federal Reserve Bank of New York (background) is promising, but I am waiting to see regular updates. In December Citigroup released a very useful approach to measuring supply chain stress. There seems to be an intention to provide updates (I hope so), but I have not yet seen one.

Perhaps because I love maps (and this map reminds me of a Risk gameboard), I have a particular affection for the Kiel Trade Indicator. This is less comprehensive than the measures above. It is also more output than input oriented. But these are very meaningful outputs. The Kiel Institute for the Global Economy explains:

The Kiel Trade Indicator estimates trade flows (imports and exports) of 75 countries worldwide, the EU and world trade as a whole. Specifically, the estimates cover over 50 individual countries as well as regions such as the EU, sub-Saharan Africa, North Africa, the Middle East or emerging Asia. It is based on the evaluation of ship movement data in real time. An algorithm programmed at the Kiel Institute uses artificial intelligence to analyze the data and translates the ship movements into nominal, seasonally adjusted growth figures compared with the previous month. We update the data twice a month. Around the 20th (without press release) for the current and the following month and around the 5th (with press release) for the previous and the current month. Arriving and departing ships are recorded for 500 ports worldwide. In addition, ship movements in 100 maritime regions are analyzed and the effective utilization of container ships is derived from draught information. Country-port correlations can be used to generate forecasts, even for countries without their own deep-sea ports.

Exports and imports of finished goods tend to be lagging indicators of demand, but a fair indicator of near-term supply. Raw material trade is usually an early confirmation of either recent shifts in demand or emerging constraints on supply.

Each of these measures (there are others too) offers a slightly different angle on flows that we have long known constantly change. So, it is probably significant that most of those looking and listening seem to agree: Demand for goods remains unusually high. Production and inventory are usually, but just barely (and not always) keeping up. Fulfilling demand with supply is constrained by several capacity limitations with related congestion, and there was some reduction in some supply chain stresses late in 2021.

This reduced stress is not necessarily the start of a trend. More on that soon (I hope).

WSJ: Absenteeism hits hard

This morning’s Wall Street Journal (online) gives first position to US food supply is under pressure, from plants to store shelves.

Omicron related absenteeism is blamed. The reporters explain, “some executives say supply challenges are worse than ever. The lack of workers leaves a broader range of products in short supply, food-industry executives said, with availability sometimes changing daily.”

The story was posted on Sunday afternoon. It is a helpful summary of issues this conversation has been working through since early December.

The data is not — yet — available to confirm, but as previously noted, I expect that last week and this week are likely to give the US its thinnest flows of food. When it is worst depends on where. Each where (node or channel) depends principally on disease penetration, distance from sources, and density of wealth/population (aka demand).

There are also big differences by product category. The next few weeks consumers will be reminded that fresh strawberries (and other produce) in deepest winter is a kind of miracle. Flows of refrigerated vans from Mexico will be reduced and slowed by new vaccination requirements for truckers crossing the border.

From El Paso, Texas to Boise, Idaho many of the same variables are at play. According to one research firm, for the last two months the south central United States has experienced the most grocery stock-outs. Canada seems to be experiencing even more farm to fork disruption.

While US case counts and covid hospitalizations remain very high, over the last two weeks daily rates seem to have stopped rising. If this continues, omicron-related absenteeism should soften. There are plenty of other constraints that can complicate flows. But the system-wide pressures that have been building since early December are gradually diminishing. We should already be scanning our horizon for new threats (and acknowledging our self-created vulnerabilities).

Given the serious risks that omicron presents, I am — again — impressed by the resilience of US grocery supply chains. This is a robust demand and supply network characterized by considerable diversity. It is adaptable — even agile — in a way that reflects these structural elements. The difference is noticeable in places with less diverse, less robust structures.

This adaptability also reflects a competitive, self-actualizing culture. Last week one distribution center general manager told me something like, “You know I’m a competitive cyclist. The Super Bowl is my finish line.  Everything I’ve got is focused on what it will take to deliver that surge.  If I make our marks for Super Bowl, I win.  We all win.  No distractions.  No premature push.  No swerves. No mass sickouts between now and then. I’m going to stay in the groove for Super Bowl Sunday.”

Omicron versus hot wings? Stand-by for the February 13 contest.

George Saravelos: deferred spending

The Global Head of Foreign Exchange Research at Deutsche Bank perceives that US consumers are starting to defer spending — despite the huge piles of M2 on which this conversation has recently focused. This is a credible and important alternative view. By the end of February, data should clarify any ambivalence. The interview with Saravelos begins at the 1:11:09 mark and continues for about eight minutes.

Embedding video has not worked. Please access this hyperlink for Bloomberg Surveillance, January 21.

Still leaning into omicron

Workforce constraints caused by omicron may be peaking. There is certainly plenty of evidence for ongoing friction, but also a few signs of constraints beginning to loosen.

New covid cases continue to clock-in at a very high rate (see first chart below). The United States hopes it is following the UK’s demand curve, not Denmark’s nor Israel’s (more and more).

Proportionally, the omicron variant continues to cause fewer hospitalizations than some prior strains (see second chart below). But the number of US residents in hospital with covid has never been higher. Given several benchmarks, higher US covid hospitalizations are likely still ahead. Hospitalizations are a reasonable indicator for disease penetration of supply chains.

According to an experimental U.S. Census Bureau survey (data tables) at some point between December 29 to January 10 more than 14 million employed Americans were not working because they were infected with covid or caring for someone infected or caring for a child whose daycare or school had closed (more and more). If accurate, this is serious friction. (See another Census survey of small business for interesting angles on sectoral and geographic differentiation.)

Since omicron began its surge, more US workers have also been laid-off and applied for unemployment insurance as demand fell for several retail service categories. Last week new and continuing jobless claims saw significant increases, apparently surprising many… despite dramatically increasing case counts and reduced retail activity since Thanksgiving (more).

I have asked colleagues around the country about outcomes of omicron related workforce absenteeism. In the last couple of days three front-line folks told me:

“We are seeing flash-droughts of specific upstream SKUs. If downstream customers notice reduced flows of a category leader, the whole category will be wiped out between deliveries.  Midstream can’t overcome that kind of push-pull.”

“Denver is crazy because of the Kroger strike. The Mid-Atlantic and Upper Midwest are crazy because of winter weather. California is crazy because it’s California. Volumes are high almost everywhere. Reefer madness everywhere. There’s no fat anywhere in the system.  Add absenteeism and crazy can quickly crash.”

“The big picture is ambiguous because local conditions are highly variable.  AND that local variability (call it “diversity”) is what ‘s really keeping the whole system going.”

Given omicron’s swift success at workforce subtraction, preexisting and persisting shortfalls in the number of new truckers working, and unprecedented levels of demand (our inventory of woes could continue), the resilience of US flows can inspire awe (at least from me).

Grocery is a fast-adapting example. Stresses across the sector are real: upstream, midstream, and downstream (more and more). Individual stores and neighborhoods and therefore households are experiencing disrupted flows and increased prices. But according to credible estimates, system-wide flows are mostly fulfilling stubbornly strong demand. According to the IRI CPG Supply Index at the end of last week (January 16), overall retail grocery shelves were 89 percent fully stocked (compared to pre-pandemic benchmarks). The biggest shortfalls were in the tobacco and alcoholic beverage categories (80 and 84 percent respectively). Given this week’s turmoil, I would not be surprised if stock-outs increase by another one or even two percentage points. But there is plenty of flow to feed us, even to supply our next stiff drink.

Recent grocery flows in Australia, Canada, and China demonstrate that equally sophisticated supply chains have not been equally resilient (more).

It is waaay too soon for a conclusive assessment, much less a victory lap. But here’s my working hypothesis: scale matters, diversity matters, and adaptability — especially self-organization — matters. Where and when there is more of each variable — scale, diversity, and adaptability — there will be more resilience.

It is also essential to acknowledge that the covid crisis is disrupting our networks rather than destroying our networks. We need to be mindful transferring what covid is teaching us to the destructive context of major earthquakes, climate change, high-category hurricanes, and other network-shredding forces.

A modest decline in excess demand

The Census Bureau’s report on Advance Monthly Sales for Retail and Food Services for December showed a decline in spending from November. Friday’s related headlines were uniformly gloomy, please see here, here, and here.

CNN’s headline announced, “Warning Sign for the Economy: Consumers are Getting Grumpy.” Evidence referenced, “Americans shopped less in December, causing the first drop in retail sales since the summer. Sales dropped 1.9% compared with November, adjusted for seasonal swings.”

Many reports neglected to mention that October and November retail sales were the highest ever recorded. December 2021’s total retail sales were more than 12 percent higher than December 2020 and over 17 percent higher than pre-pandemic December 2019. (Please see chart below.)

Very strong sales persist. Given cash reserves currently available to consumers (see second chart below) a sharp decline in consumer purchases seems unlikely anytime soon.

To state what’s entirely obvious, retail sales have been unusually high since Spring 2021. This followed a collapse — and enormous shift — in demand early in the pandemic. During 2020 millions of US households — especially high-earning households — accumulated savings by spending much less. Billions of dollars were also distributed to assist millions adapt to pandemic-related economic dislocation. Starting late in the first quarter of 2021 — coincident with significant vaccination roll-outs — most households accelerated spending. But even while spending increased, the personal saving rate for current income remained well elevated until at least October (e.g., in April the PSR was 12.6, only in October did it finally fall to 7.1, much closer to the normal range of the last decade).

In most product categories, production/distribution capacity did not dramatically increase between late 2019 and mid-2021. In many cases, actual working capacity has been considerably constrained by various pandemic factors. Disequilibrium between demand and supply has often increased. Many supply chains have been increasingly stressed while trying to serve this extraordinary demand with less-than-ordinary supply capacity and volatile flows. Over the last nine months of 2021 US producer and consumer prices edged higher as lots of cash chased the same amount of goods and services.

Unusual — sometimes unpredictable — supply chain stress will persist until demand pull is better calibrated with supply push.

Leaning into the worst days

Last week grocery, pharmacy, and other retail shelves were sporadically sparse. Many workers needed to make, move, and sell products were infected with coronavirus and/or seasonal flu. Many were sick. Some stayed home to protect others.

Flows slowed in several places.

There are plenty of anecdotes of workers — some vaccinated and some not — who continue to work despite mild symptoms of something flu-like. Many have purposefully decided not to be tested. For better and worse, they have been needed to maintain flows.

This week’s product flows are likely to be even more constrained than last week — in more places. In some places, such as the mid-Atlantic and New England, winter weather will further complicate delivery of goods and services.

This week or next will probably see the worst friction for US retail supply chains since, perhaps, April 2020 (potentially as nail-biting as March 2020). Most US urban centers are likely to hit peak omicron in the next ten days. Good news: It looks like NYC and New England may already be moving off their peak.

For several months this conversation has followed case-counts and hospitalizations for the US, UK, Denmark, and Israel. Below are these “demand curves” through Saturday, January 15. The UK’s dip in case counts is encouraging. Israel’s case count is a concern (but Israel’s transmission rate has started to decline). Hospitalizations (a more confident indicator for disease penetration of supply chains) will increase following peak case-counts. Omicron’s hospitalization rate and typical clinical outcomes have, however, been much lower than prior variants.

When and where Hours-of-Service waivers, suspension of delivery curfews, and lifting of other discretionary constraints are undertaken for weather-related or other causes, it would be helpful to extend longer than normal to mitigate supply chain constraints unfolding for the remainder of January.

+++

Since early December this conversation has encouraged proactive attention to reasonably obvious implications of omicron’s contagious reach and speed. I have been pleased with many measures undertaken. In this regard, I seem to be a distinct minority. Withering criticism has been the more common response (more). Lack of clarity has been an especially prominent complaint. When possible, clarity is a distinct virtue. But pretend clarity can too often be a self-interested manipulation of reality. For me, this is a meaningful working definition of evil. Reality can be — in my experience, usually is — complex. High volume, high velocity supply chains operating in a pandemic (or on most days) are complex. Embracing this complexity is a more honest and helpful stance than willful denial. Engaging complexity favors context-aware, time-sensitive, situational, provisional, frequently contingent choices. Ambiguity can be innate. Empirically demonstrated principles can be very helpful. Actively testing principled hypotheses will often move us forward. Engaging complexity favors courage. Effectively engaging complexity favors self-critical acceptance and rapid correction of error. These are the best tools for extricating meaningful clarity from emergent complexity. Since early December opportunities to extract meaningful clarity have been sacrificed at altars of pretend clarity. I regret this outcome. It is, however, an aspect of complexity that must also be embraced.