US demand and supply networks are huge. Meaningful network analysis must include flows arriving from outside the United States and departing flows cannot be ignored. Several prior posts have outlined efforts to track this domestic “watershed” (or more accurately watersheds– plural). I am happy to report that better minds (and more time) are being dedicated to this task.
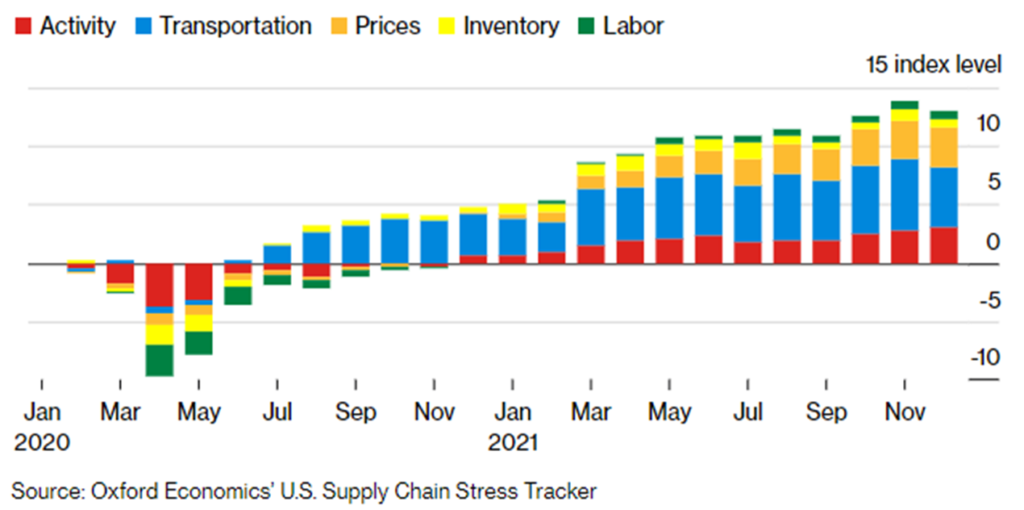
Oxford Economics’ Supply Chain Stress Tracker was started in September (background) to assess US supply chains. There have been monthly updates. Below is the year-end summary picture.
On January 21 Flexport launched its Logistics Pressure Matrix. According to the authors and analysts:
This report considers eight categories of measures with a view to providing a sequential assessment of the demand for logistics services and measures of the use of logistics networks. For each we’ll provide key characteristics of the metrics, reasons for tracking them, their current values and available alternatives. On the demand side we’ll outline measures that cover aggregate, current household consumption as well as expectations from consumers and manufacturers as to the outlook for future demand. We’ll then look at retail sales and inventories-restocking of the latter is a key determinant of future international trade flows. The handling of freight—both inland and at the major seaports—can provide a direct sense of whether network usage is rising or declining. Shipping rates provide a market participant’s view of current and future congestion. Finally, we take an alternative look at Flexport’s measure for ocean shipping times to determine whether there are signs of logistics networks becoming less congested.
I am impressed. I am especially encouraged by Flexport’s attention to demand. What I see in this initial report makes me want to keep coming back for more. Here’s the link again and here is where they promise to update.
Global flows are even more complex. Many efforts are underway to map, measure, understand, anticipate, and even predict probable future flows. Flexport will build out for other regions what they have started for US flows. The Global Supply Chain Pressure Index developed by a team at the Federal Reserve Bank of New York (background) is promising, but I am waiting to see regular updates. In December Citigroup released a very useful approach to measuring supply chain stress. There seems to be an intention to provide updates (I hope so), but I have not yet seen one.
Perhaps because I love maps (and this map reminds me of a Risk gameboard), I have a particular affection for the Kiel Trade Indicator. This is less comprehensive than the measures above. It is also more output than input oriented. But these are very meaningful outputs. The Kiel Institute for the Global Economy explains:
The Kiel Trade Indicator estimates trade flows (imports and exports) of 75 countries worldwide, the EU and world trade as a whole. Specifically, the estimates cover over 50 individual countries as well as regions such as the EU, sub-Saharan Africa, North Africa, the Middle East or emerging Asia. It is based on the evaluation of ship movement data in real time. An algorithm programmed at the Kiel Institute uses artificial intelligence to analyze the data and translates the ship movements into nominal, seasonally adjusted growth figures compared with the previous month. We update the data twice a month. Around the 20th (without press release) for the current and the following month and around the 5th (with press release) for the previous and the current month. Arriving and departing ships are recorded for 500 ports worldwide. In addition, ship movements in 100 maritime regions are analyzed and the effective utilization of container ships is derived from draught information. Country-port correlations can be used to generate forecasts, even for countries without their own deep-sea ports.
Exports and imports of finished goods tend to be lagging indicators of demand, but a fair indicator of near-term supply. Raw material trade is usually an early confirmation of either recent shifts in demand or emerging constraints on supply.
Each of these measures (there are others too) offers a slightly different angle on flows that we have long known constantly change. So, it is probably significant that most of those looking and listening seem to agree: Demand for goods remains unusually high. Production and inventory are usually, but just barely (and not always) keeping up. Fulfilling demand with supply is constrained by several capacity limitations with related congestion, and there was some reduction in some supply chain stresses late in 2021.
This reduced stress is not necessarily the start of a trend. More on that soon (I hope).