Month: January 2022

Workforce Absenteeism

Three bits this morning from Bloomberg.  First, comments from the CEO of Albertsons.  Bloomberg reporters add:

Omicron is exacerbating disruptions in food supply chains that are already stressed. Rising U.S. infections mean more workers are getting sick at farms, factories, distributors and retailers, crimping the flow of goods to shoppers just as the variant prompts people to eat at home more.

Australia is experiencing one-fifth (or worse) higher worker absenteeismwith specific impacts on the grocery supply chain.

With the virus now raging, a key industry body is warning that firms in food and logistics are reporting 10%-50% of their workers are sick or in isolation, leaving supermarket shelves empty.

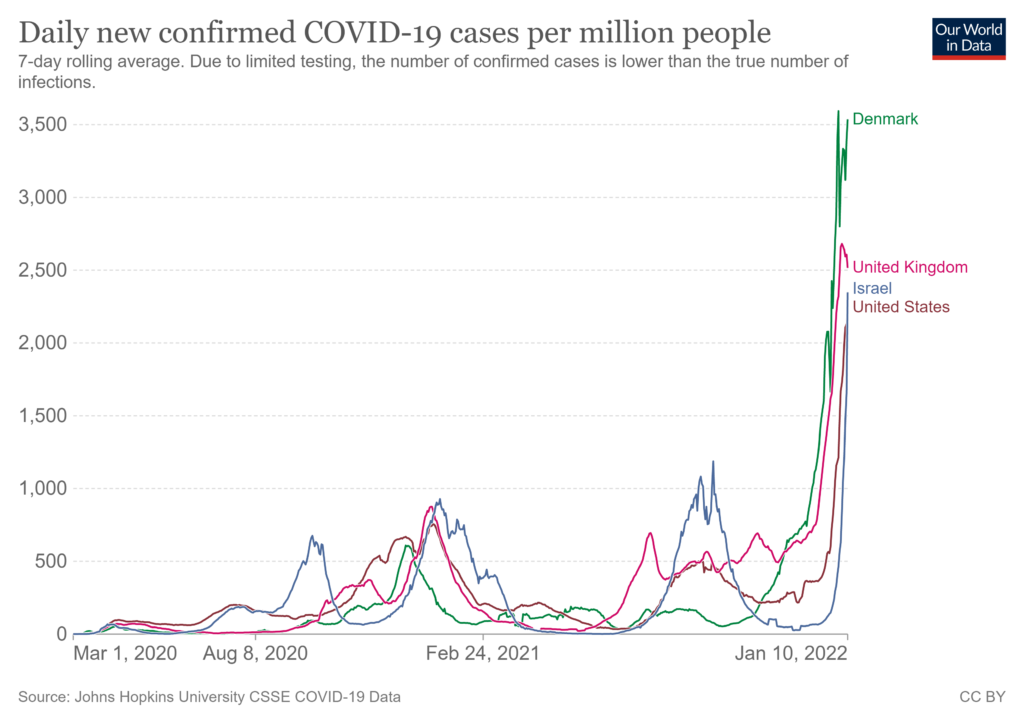
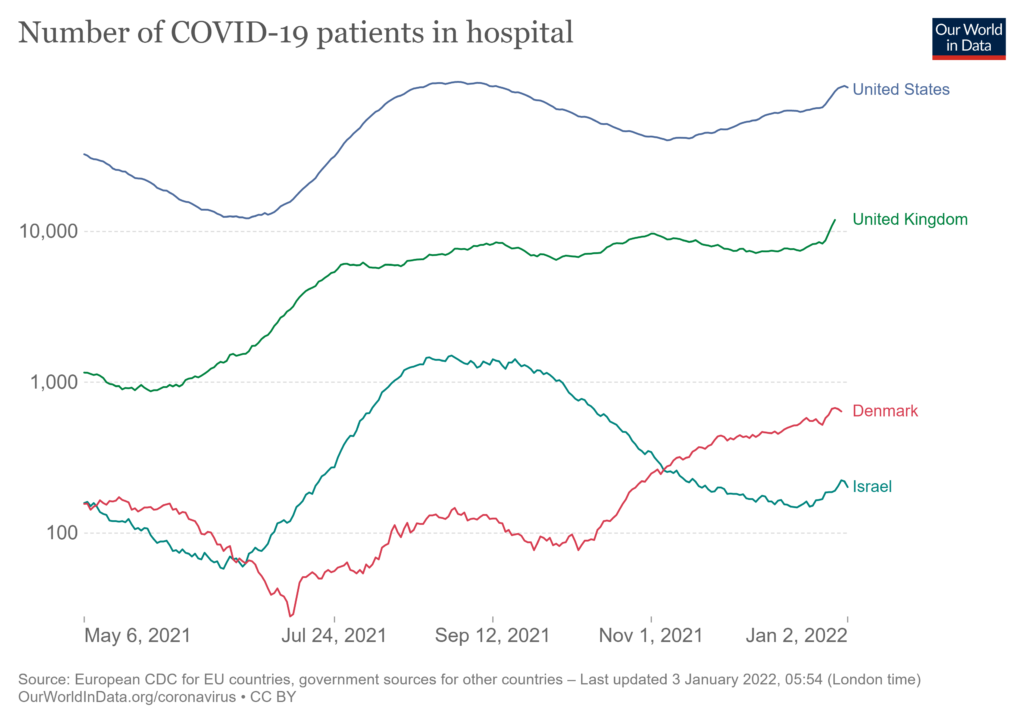
Bloomberg has run some numbers on British workplace absenteeism.  The proportion of workers not showing up spiked during the first week in January, consistent with what may have been UKs — or at least London’s — peak omicron period. 

Both Brits and Aussies test a better proportion and have had better workplace compliance with isolation and quarantine policies than the USA. So, I would anticipate US absenteeism rates could be less severe.  It is also interesting that British absenteeism in the logistics sector was lower last week than in the first week of 2021.  The dire consequences of not delivering food and other crucial freight is recognized by workers.  Logistics firms are proactive — even loss-leading — in trying to keep flows as strong as possible.

But given preexisting disequilibrium of demand and supply, it will not take much to deplete retail stocks and further slow replenishment. The Brits and Aussies are probably one to two weeks ahead of the USA in terms of peak omicron.  So… the United States is probably at least one week out, maybe a bit more, from our most constrained flows of food and more. Different US regions will be on slightly different calendars with somewhat different outcomes. There will also be flow variation in product categories.

Here’s a US focused report from the Washington Post:

In a Monday call with 27 food industry chief executives, Geoff Freeman, CEO of the industry organization Consumer Brands Association, said more employee absences were reported in the past two weeks than in all of 2020.

We have been anticipating these results since early December. In my opinion it is not too soon to implement mitigation measures that include Hours-of-Service waivers, suspension of delivery curfews, and other local and regional adjustments that can increase potential velocity of available capacity over the next two or three weeks. It is important that truck stops and rest areas continue to be operational. Supply capacity will decline as absenteeism increases.  Enhanced velocity can claw back  some of what is lost.

Record numbers

Global and US covid case counts continue to surge (see first chart below). According to Reuters, yesterday (Monday, January 10) the United States reported 1.35 million new infections. Monday counts are usually higher. The seven-day average is closer to 700,000 per day, still plenty high. Given the US testing context, even these record-high numbers are material undercounts.

US hospitalizations (a much harder number) have also hit a new high and will continue higher, exceeding the worst numbers from January 2021. Yesterday there were at least 136,604 residents of the United States hospitalized with covid (more). Some of these are not hospitalized for covid. But covid hospitalizations outside the United States (see second chart below) — and clinical challenges inside many hospitals (more) — confirm that omicron can be a serious health threat, especially for the unvaccinated. Accumulating evidence indicates that on-average omicron causes a milder version of covid. But omicron is so contagious that the numbers falling outside this average are flooding the healthcare system.

Related workplace absenteeism is increasing (more and more and more). As cases and symptoms escalate, more nurses and teachers and truckers and grocery and many other workers will become sick. The percent of cases with significant symptoms is likely to be much lower than before, but overall numbers will be as high or higher. So, flows of services and goods will slow. Shelves will not be refilled as quickly or as fully. Some nervous buying is predictable. Supply will more frequently not fulfill demand.

For how long? Please consider UK case counts on the first chart below. Counts are still high, but now declining from a peak. This mostly reflects a significant decline in metro-London’s case counts since New Year’s Eve. Some are suggesting NYC may now be approaching its peak. In much of the United States over the next two or perhaps three weeks, store shelves are likely to show symptoms of omicron.

This will be a treacherous time. Well-established, high-volume, high-velocity flows are predisposed to persist. Per evidence of the last two years, I will not bet against the creative adaptability of US supply chains. But the margin for error is as tight — probably tighter — than any period since March 2020. Local conditions, say a blizzard, week-long atmospheric river, earthquake, significant cyber-complication (you know the all-hazards drill), could suddenly transform bad into much worse.

Big Flows

Complex Adaptive Systems — like demand and supply networks — are tough to understand, impossible to precisely predict. We play probabilities and try to exploit possibilities.

Choosing our probabilities involves analysis and synthesis, data and experience, risk-avoidance and risk-taking. But reality is so super-abundant that human choice is typically radically reductionist. Some simplification is necessary. Depending on our choices (and how reality unfolds) this can be helpful or the deepest hubris. For example, last week four colleagues at the Federal Reserve Bank of New York launched a new Global Supply Chain Pressure Index (GSCPI). (More)

To avoid self-subverting choices it helps to be as clear as possible about how we try to reduce complexity. Acknowledging what is being actively (even reflexively) considered and what has been excluded facilitates self-correction. The authors of the GSCPI are explicit, “… we thus have available a data set of twenty-seven variables: the three country-specific supply chain variables for each of the economies in our sample (the euro area, China, Japan, South Korea, Taiwan, the U.K., and the U.S.), the two global shipping rates, and the four price indices summarizing airfreight costs between the U.S., Asia, and Europe.” I am looking forward to playing with and being informed by this particular reductionist angle.

I am a flows guy. My reductionist bias is to find meaningful points in the flow to monitor. I prefer discharge points, for example, volume discharged from and into ports, throughputs at manufacturing facilities, inbound and outbound from distribution centers. I find truck counts overtime on a busy Interstate fascinating. I like real-time data. I love experienced eyes-on-the-flow. I want to know someone who lives inside each flow. I want to hear what they perceive is happening.

I am more attentive to water-sheds than water-wells. I am much more an ecosystem guy than a species guy. I absolutely acknowledge the importance of each water-well and individual species (or individual product), but plenty of other folks are giving close attention to these sources. I try (and often fail) to understand wide-area interdependencies that connect tens-of-thousands of water-wells and species.

To try my best, I depend on the following indicators:

The Federal Reserve’s monthly report on Industrial Production and Capacity Utilization. I give particular attention to food and fuel figures. How do current volumes and capacity utilization compare to prior periods? For example, below is a picture of US food production compared to a 2017 base. The “total index” is suggestive (see far below). Sector-specific elements, such as for food, are even more meaningful (at least to me). Differentiating between durable and non-durable goods production has been especially meaningful during the pandemic.

The Port of Los Angeles daily/weekly report of TEU volumes received. Domestic flows are supplemented by — and often dependent upon — international flows. LA is only one port. But what happens or does not happen at LA ripples across US supply chains. Are current flows going up or down? Are flows current or is there a back-up? Is friction increasing or decreasing? Before the pandemic these data were very time-delayed. Now it is possible to have a much more current picture. There is a wide array of other maritime measures. (More)

The monthly Cass Transportation Index Report. There are a wide array of rich data angles on truck volumes and related. I am enthusiastically ecumenical in digesting as many as possible. But especially when bewitched and bewildered, I look at how the Cass Freight Index is estimating shipment volumes. Depending on what I see with trucking, I may look deeper at air and rail throughputs. (More)

The Federal Reserve’s monthly report on Manufacturers’ Shipments, Inventories, and Orders. Comparing this with production and capacity utilization (above) provides a good sense of friction in our flows, especially any sector-specific friction. For example, the 51 percent increase in November’s year-to-date shipments from petroleum refineries and 12.9 percent decrease in shipment of automobiles and 5.9 percent increase in shipments of meat, poultry, and seafood products point to important differences across the ecosystem of flows. (More)

The Bureau of Economic Analysis’ monthly report of Personal Income and Outlays. This describes demand, the consumer behavior that presumably is pulling all the foregoing. I give particular attention to the related BEA quarterly report on Real Final Sales to Domestic Purchasers. This is a reasonable expression of effectual demand being fulfilled… and it is measured in chained 2012 dollars so inflationary effects are filtered out.

Very recently I have reluctantly added attention to the Federal Reserve’s weekly report on the M2 money supply, essentially a measure of the financial liquidity available to support demand. This is an effort to 1) deal with the pandemic explosion in available cash and 2) anticipate the direction of future demand.

This leaves out a great deal. What about production capacity outside the United States? How about port throughputs on the way to LA and other US ports? Warehouse construction, workforce gyrations, technological advances, and cost/availability of capital can all have significant impacts on sector-by-sector production and fulfillment capacities. This week workforce absenteeism could have impacts for weeks to come. Obviously there is much more. Trying to reduce reality is treacherous.

But with all its limitations, regular engagement with this modest set of measures lends a sense of strategic context when rough (occasional, ephemeral, illusory?) equilibrium is punctuated by some new reality — pandemic, earthquake, hurricane, war, social evolution, cyber-something, et cetera. This water-shed view is especially valuable in making-sense of volatility… and conceiving constructive options for responding to volatility.

So… below are six sort-of current charts. Reductio ad absurdum? What do these signals suggest to you? What more do you want to know before making a judgment? What I tentatively derive is a strong sense of enormous flow emerging from a sudden collapse in Spring 2020. Current volumes are at or near prior peaks with plenty of pull still pending. Current capacity is stressed to fulfill the amazing increase in demand experienced since early 2021. Most demand is being fulfilled, but there is no substantive slack (no strategic reserve) remaining in either production or fulfillment capacities. Upstream and mid-stream are at flood stage. Downstream demand is not yet satiated. Freight is especially fraught. Implications depend on each decision-maker’s place and role in the overall system. Implications also depend on the next high impact disruption.

Sick-Call

Covid cases are climbing faster than ever before (see first chart below). These are undercounts.

While omicron-related disease is on-average less severe, its rapid simultaneous spread is finding plenty of vulnerable victims, including unvaccinated children (more). Many hospitals are packed again. Already or very soon, the January 2021 peak for covid-related US hospitalizations will be superseded (see second chart and more). Credible projections anticipate US hospitalizations will continue to increase until mid-February.

Daily deaths are also expected to increase through mid-February. As a percentage of confirmed cases or hospitalizations, deaths are likely to be well below prior peaks. But given the exponential growth in case counts, the absolute number of dead per day could close-in on the worst days of 2020.

Hospital staff, EMS professionals, food processors, flight crews, TSA screeners, and many others are calling in sick. Many more would test positive for covid, if they could find a test and were inclined to test. On January 6 Bloomberg reported, “The highly contagious omicron virus variant is disrupting already stressed food supply chains, sickening so many workers that more shortages at grocery stores are all but certain.”

Many supply chains are already constrained by a wide range of workforce dynamics (not always directly related to covid). January and February weather often complicates supply velocity in much of North America. Add a highly contagious variant into this wintry mix (and any related consumer stockpiling) and the “feels like” function for supply chains can quickly slip toward freezing. As is more widely understood today than before, high volume, high velocity demand and supply networks can be as efficient at distributing problems as products. Once bottlenecks, chokepoints, and gridlocks form, decongesting can be complicated and delayed.

On Thursday, Louisiana’s State Health Officer and Medical Director was quoted as saying, “When you’re in a surge like we are right now and Covid is everywhere — and it is everywhere right now — if you have trouble getting a test, a take-home test particularly, and you do have symptoms, the prudent thing to do is just assume you have Covid and isolate away from other people. That’s the safest thing to do right now.” This is the personal care worldview that I would want my own physician to reflect. From a supply chain perspective, I appreciate the Medical Director’s focus on people with symptoms. This is consistent with recent CDC recommendations.

But if the current exponential growth in cases continues for another 10 days or more, we will need tens-of-thousands of workers with mild symptoms to stay on the job to maintain flows of water, food, fuel, pharmaceuticals, and other critical freight on which millions depend (related). Which symptoms, how mild, with what mitigation measures? It is not too soon, actually its getting very late, to consider this treacherous possibility. Probability? The demand slopes below are not encouraging.

Do the Nosey-Pokey

Intellectually most of us accept the complexity of everyday life. Emotionally most of us prefer clarity. The tension between complexity and clarity is at the heart of most human stories — comedies and tragedies and each of our daily dramas. Integrating what we carefully discern with what we spontaneously feel and then doing something constructive can be treacherous. Below is a bit of comedy that, at least to my taste, acknowledges both what is real and our preference for something less complicated. Please listen long enough to hear Colbert sing (about 100 seconds in).

Clarifying CDC quarantine and isolation recommendations

Late Tuesday afternoon, the CDC clarified its recommendations released on December 27. The document (available here) provides more context and condition-specific detail. Accurate public health guidance — especially for a fast-moving, highly-contagious, mutating virus — will not always provide practical workplace guidance.

For most supply chain professionals, here are my reductionist interpretations for the workplace.

Vaccinated, boosted, and asymptomatic workers who come into close contact with someone with covid do not need to quarantine. For ten days after close contact, vaccinated, boosted, asymptomatic workers should wear a well-fitting mask around others.

Non-vaccinated, non-boosted workers — without symptoms — should quarantine for at least five days after close contact with covid… and then follow the specific steps set out in the recommendation before returning to work.

When anyone has symptoms of covid and/or tests positive, s/he should isolate… and then follow the specific steps set out in the recommendation before returning to work.

Vaccinated, boosted workers do not need to test-out of isolation. (The reasons outlined in the clarified recommendation are consistent with what Dr. Walensky told Colbert on Monday night.) Some states still have public health orders in place that require testing-out of quarantine and isolation. Current demand for testing far exceeds supply.

In my personal judgment, many previous good practices to reduce transmission have been overcome by events, overcome by omicron’s extremely contagious character.

If sick, stay home. If vaccinated, boosted and feeling fine, please come to work, you are needed. You will be needed even more over the next two or three weeks as the number of new infections skyrocket and many of your co-workers should not or cannot work. Given omicron’s rush and reach, you should wear a mask when working with others.

On December 27 OSHA announced changes in its stance. The Supreme Court is scheduled to hear related oral arguments this Friday. I do not expect OSHA standards to be significantly clarified prior to peak-omicron.

As stated previously (before any of the recent CDC recommendations), I am not a lawyer or epidemiologist. I am someone who wants to safely facilitate continued flow of water, food, pharmaceuticals, fuel, and other critical freight. This is never risk-free work. I recognize the profound risks involved if flows are seriously disrupted. How do I behave as a prudent person with a fundamental duty to fulfill… during a pandemic? How do I do my best to serve others with what is available? How do I square necessity with possibility?

Three week countdown

This is not the same disease as we were seeing a year ago,” according to Sir John Bell, professor of medicine at the University of Oxford, discussing the omicron variant’s impact on covid. Infections are skyrocketing (see first chart below), but symptoms are often milder and hospitalizations — while rising — are increasing at a much lower rate than with prior dominant variants (see second chart below).

The data subtext for these case counts can be treacherous. Israel and Denmark have sophisticated real-time data-streams on new cases. UK data sources are almost as good. US case counts are much less accurate, especially after a long holiday. But Denmark’s sudden surge last week reflects social behavior and easy access to testing as much as infection rates. Especially in the context of omicron, hospitalizations are a more confident comparative measure.

Risks to the healthcare system — and other crucial networks — continue to be significant. While hospitalization rates are much lower, infections are much higher. The lower rate can still generate significant new admissions. Many US hospitals are already short-staffed. Several key supply chains have been struggling to keep and recruit sufficient workforce levels before omicron emerged (more). Strict adherence to isolation and quarantine guidance could decimate flow capacity.

Widespread omicron contagion can now be assumed. Spread and depth of disease is still to be seen. Cascading impacts on supply chain capacity should roughly track disease penetration across the population. Watching how, when, and where constraints on flow emerge may provide helpful hints on potential mitigation measures. This is what I will watch and update here over the next three or so weeks.