Complex Adaptive Systems — like demand and supply networks — are tough to understand, impossible to precisely predict. We play probabilities and try to exploit possibilities.
Choosing our probabilities involves analysis and synthesis, data and experience, risk-avoidance and risk-taking. But reality is so super-abundant that human choice is typically radically reductionist. Some simplification is necessary. Depending on our choices (and how reality unfolds) this can be helpful or the deepest hubris. For example, last week four colleagues at the Federal Reserve Bank of New York launched a new Global Supply Chain Pressure Index (GSCPI). (More)
To avoid self-subverting choices it helps to be as clear as possible about how we try to reduce complexity. Acknowledging what is being actively (even reflexively) considered and what has been excluded facilitates self-correction. The authors of the GSCPI are explicit, “… we thus have available a data set of twenty-seven variables: the three country-specific supply chain variables for each of the economies in our sample (the euro area, China, Japan, South Korea, Taiwan, the U.K., and the U.S.), the two global shipping rates, and the four price indices summarizing airfreight costs between the U.S., Asia, and Europe.” I am looking forward to playing with and being informed by this particular reductionist angle.
I am a flows guy. My reductionist bias is to find meaningful points in the flow to monitor. I prefer discharge points, for example, volume discharged from and into ports, throughputs at manufacturing facilities, inbound and outbound from distribution centers. I find truck counts overtime on a busy Interstate fascinating. I like real-time data. I love experienced eyes-on-the-flow. I want to know someone who lives inside each flow. I want to hear what they perceive is happening.
I am more attentive to water-sheds than water-wells. I am much more an ecosystem guy than a species guy. I absolutely acknowledge the importance of each water-well and individual species (or individual product), but plenty of other folks are giving close attention to these sources. I try (and often fail) to understand wide-area interdependencies that connect tens-of-thousands of water-wells and species.
To try my best, I depend on the following indicators:
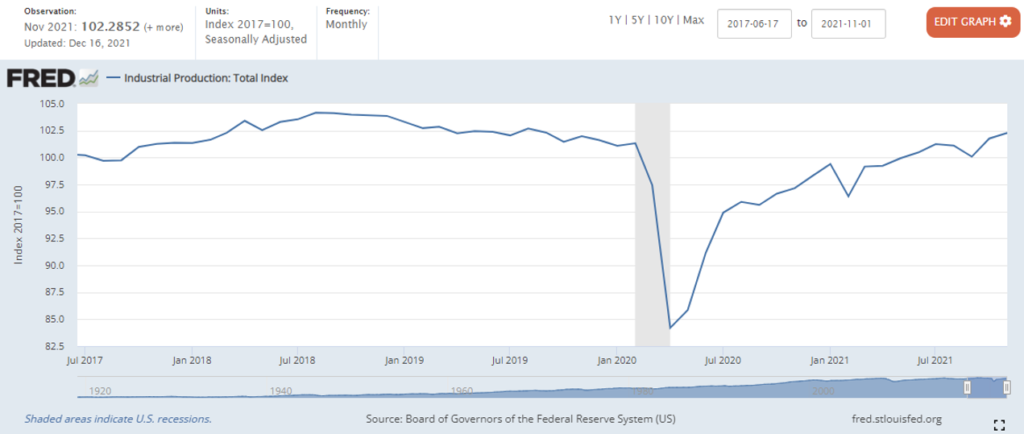
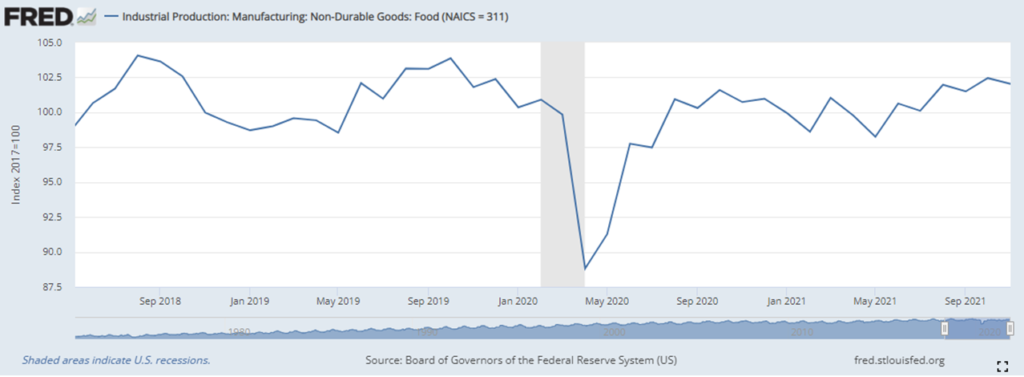
The Federal Reserve’s monthly report on Industrial Production and Capacity Utilization. I give particular attention to food and fuel figures. How do current volumes and capacity utilization compare to prior periods? For example, below is a picture of US food production compared to a 2017 base. The “total index” is suggestive (see far below). Sector-specific elements, such as for food, are even more meaningful (at least to me). Differentiating between durable and non-durable goods production has been especially meaningful during the pandemic.
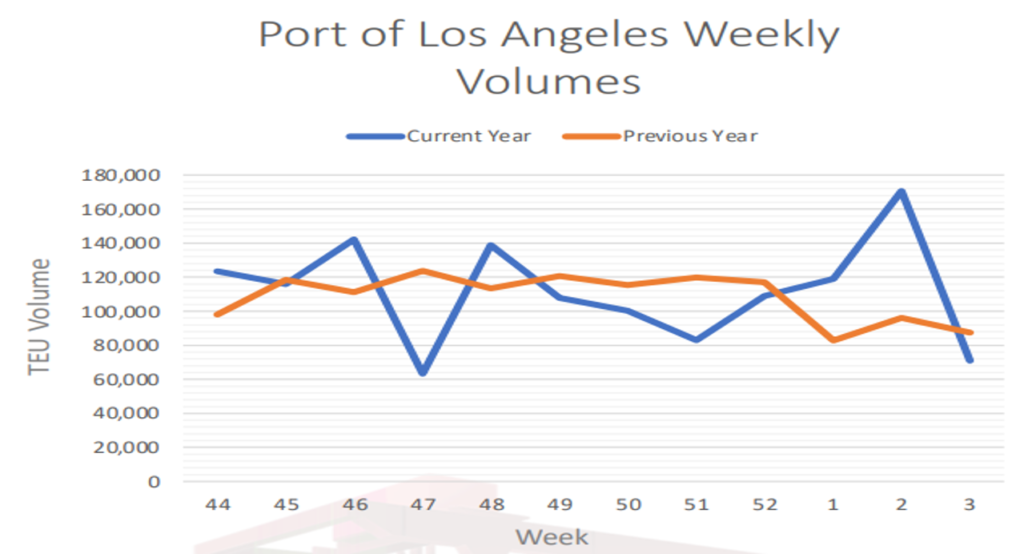
The Port of Los Angeles daily/weekly report of TEU volumes received. Domestic flows are supplemented by — and often dependent upon — international flows. LA is only one port. But what happens or does not happen at LA ripples across US supply chains. Are current flows going up or down? Are flows current or is there a back-up? Is friction increasing or decreasing? Before the pandemic these data were very time-delayed. Now it is possible to have a much more current picture. There is a wide array of other maritime measures. (More)
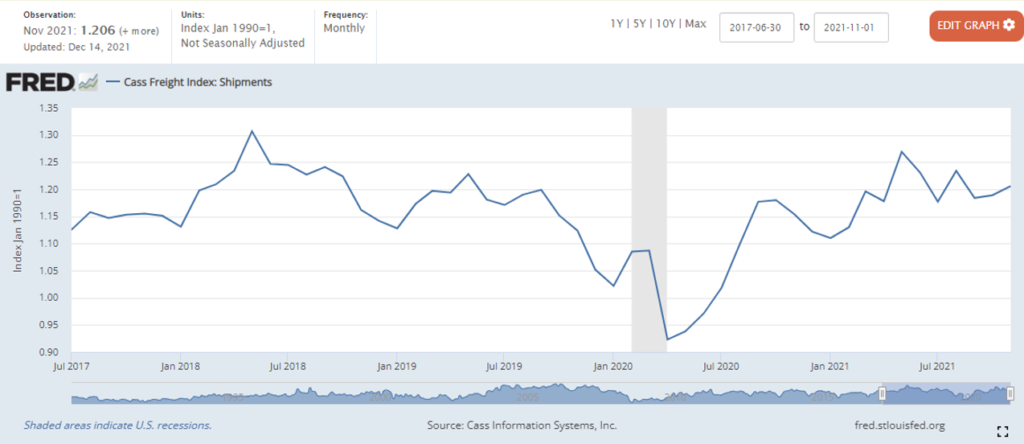
The monthly Cass Transportation Index Report. There are a wide array of rich data angles on truck volumes and related. I am enthusiastically ecumenical in digesting as many as possible. But especially when bewitched and bewildered, I look at how the Cass Freight Index is estimating shipment volumes. Depending on what I see with trucking, I may look deeper at air and rail throughputs. (More)
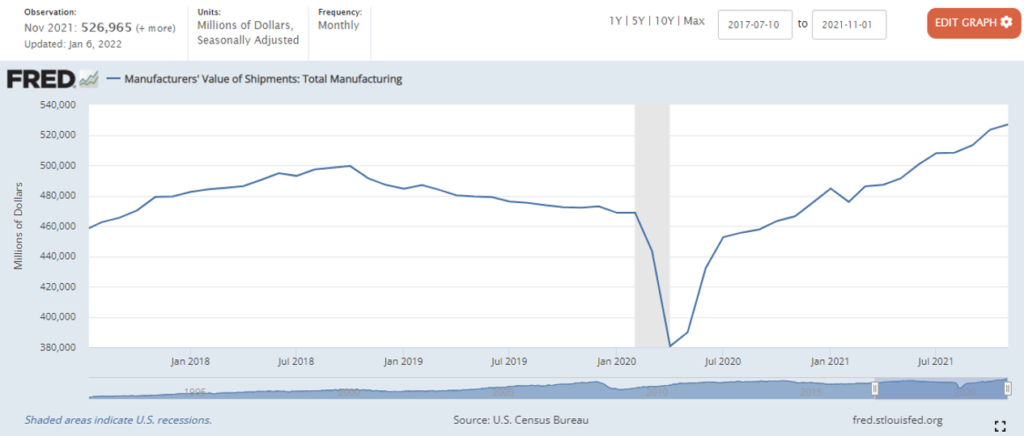
The Federal Reserve’s monthly report on Manufacturers’ Shipments, Inventories, and Orders. Comparing this with production and capacity utilization (above) provides a good sense of friction in our flows, especially any sector-specific friction. For example, the 51 percent increase in November’s year-to-date shipments from petroleum refineries and 12.9 percent decrease in shipment of automobiles and 5.9 percent increase in shipments of meat, poultry, and seafood products point to important differences across the ecosystem of flows. (More)
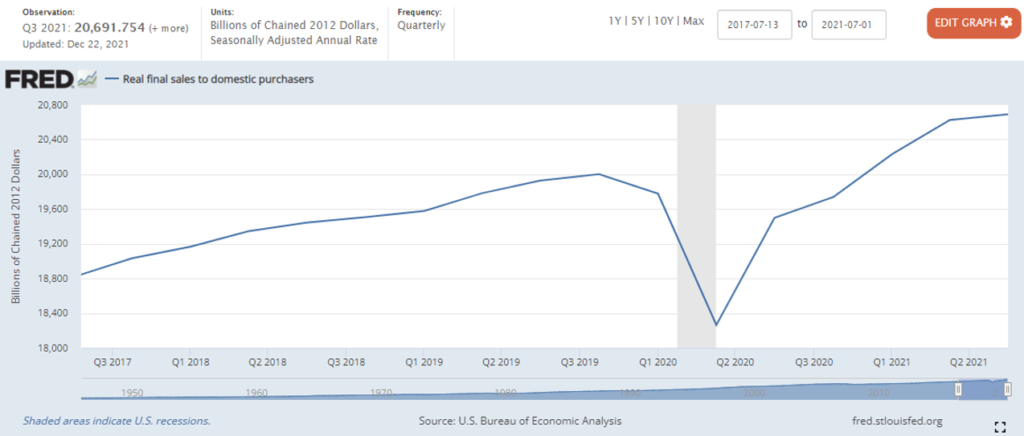
The Bureau of Economic Analysis’ monthly report of Personal Income and Outlays. This describes demand, the consumer behavior that presumably is pulling all the foregoing. I give particular attention to the related BEA quarterly report on Real Final Sales to Domestic Purchasers. This is a reasonable expression of effectual demand being fulfilled… and it is measured in chained 2012 dollars so inflationary effects are filtered out.
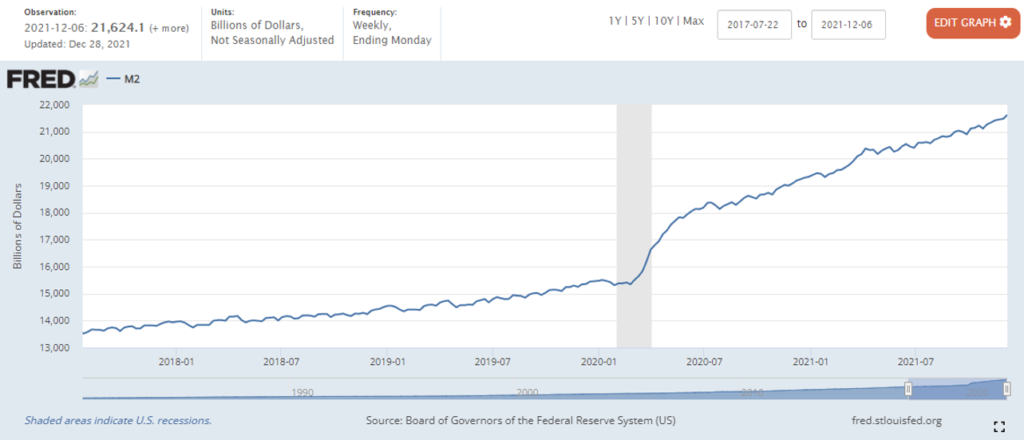
Very recently I have reluctantly added attention to the Federal Reserve’s weekly report on the M2 money supply, essentially a measure of the financial liquidity available to support demand. This is an effort to 1) deal with the pandemic explosion in available cash and 2) anticipate the direction of future demand.
This leaves out a great deal. What about production capacity outside the United States? How about port throughputs on the way to LA and other US ports? Warehouse construction, workforce gyrations, technological advances, and cost/availability of capital can all have significant impacts on sector-by-sector production and fulfillment capacities. This week workforce absenteeism could have impacts for weeks to come. Obviously there is much more. Trying to reduce reality is treacherous.
But with all its limitations, regular engagement with this modest set of measures lends a sense of strategic context when rough (occasional, ephemeral, illusory?) equilibrium is punctuated by some new reality — pandemic, earthquake, hurricane, war, social evolution, cyber-something, et cetera. This water-shed view is especially valuable in making-sense of volatility… and conceiving constructive options for responding to volatility.
So… below are six sort-of current charts. Reductio ad absurdum? What do these signals suggest to you? What more do you want to know before making a judgment? What I tentatively derive is a strong sense of enormous flow emerging from a sudden collapse in Spring 2020. Current volumes are at or near prior peaks with plenty of pull still pending. Current capacity is stressed to fulfill the amazing increase in demand experienced since early 2021. Most demand is being fulfilled, but there is no substantive slack (no strategic reserve) remaining in either production or fulfillment capacities. Upstream and mid-stream are at flood stage. Downstream demand is not yet satiated. Freight is especially fraught. Implications depend on each decision-maker’s place and role in the overall system. Implications also depend on the next high impact disruption.