Month: February 2022

The future of supply chain resilience

Here is my — our? — supply chain resilience problem to be solved:

In a large-scale catastrophic context, how can continued flows of water, food, medical goods, and pharmaceuticals be best assured? How can sourcing, processing, and production of sufficient volumes be achieved? Given available capacity, how can the freight velocity of inputs and outputs be maximized? Answers to these three questions always raise related questions of energy and fuel supplies. There is considerable consensus regarding these key issues.

I am persuaded (others are not fully persuaded) that fundamental to finding successful answers for the foregoing is preserving or quickly reestablishing a population’s ability to express demand. In large, advanced economies the velocity of supply reflects accurate measurement of demand. For thirty-plus years this has increasingly been done by tracking and sharing transaction details via telecomputing networks. Typically this depends on the electric grid and the cell network; both of which are lost or seriously degraded by anything worth calling a catastrophe. Without well-targeted demand, it is not possible to effectively deliver available volumes. With well-targeted demand, supply volumes and velocities have demonstrated rather amazing adaptability.

In most catastrophes there is a surviving strategic capacity to produce sufficient volumes of food, medical goods, and pharmaceuticals. This reflects the geographic distribution typical of these production capacities. Water can be more problematic. Very high volumes need to be locally distributed for human sanitation and fire suppression. A sudden onset loss of water systems serving a large population (for example, caused by a seismic event or long-term grid failure or contamination) can quickly present deadly threats related to human hydration.

But if water can continue to be locally accessed, other life-critical products can almost always be supplied with enough freight movement — usually meaning trucks and fuel — going to the right places at the right time. Even water system complications can be mitigated if trucks can quickly deliver repair equipment, back-up pumps, and fuel for emergency operations. The interdependencies can get very complicated. But even in catastrophes, sufficient flows can usually be restored if:

Demand can be accurately sized and located,

Demand can be effectively accessed by trucks,

Refueling is available for trucks and emergency electrical generation (e.g., water pumps, cell towers, digital transaction systems…).

It may still be tough and treacherous, but if these priorities are effectively achieved, time and opportunity expands.

On Thursday the White House released six reports — well, at least five reports — directly relevant to the problems set out above. USDA has generated a report on production and distribution of agricultural products. The Department of Health and Human Services looks at the public health supply chain. Department of Commerce and Department of Homeland Security focus on information and communications technology (by which demand is expressed and measured). The Department of Transportation reports out on freight and logistics. The Department of Energy offers analysis that has important implications for fuels.

These five reports, plus one more from the Department of Defense, are the result of a presidential directive released last February. Here are the opening lines of that Executive Order:

The United States needs resilient, diverse, and secure supply chains to ensure our economic prosperity and national security.  Pandemics and other biological threats, cyber-attacks, climate shocks and extreme weather events, terrorist attacks, geopolitical and economic competition, and other conditions can reduce critical manufacturing capacity and the availability and integrity of critical goods, products, and services.

This national need is broader than my problem, but my problem is relevant to — and depends upon — how this need is achieved. I agree that Supply Chain Resilience is best approached from a strategic, capabilities-based angle, rather than a tactical, threat-based position. Over the next two weeks I intend to take on each sector-specific report and try to discern a coherent cross-sector strategy.

During the twelve months these reports were being developed the United States and the world arguably experienced the most far-reaching supply chain challenges ever, certainly in the thirty-some-year history of contemporary supply chains. These reports reflect influential expert interpretations of this shared experience. Over time these written reports could contribute to our collective interpretation as much as our direct experiences… for better or worse, even better and worse.

It is also possible that emerging experience has already superseded these efforts. Supply chains have morphed considerably since the Executive Order — are morphing dramatically this morning (more and more) — and there is plenty of potential for new realities still unfolding.

In any case, as I complete each related consideration I will also link each below.

Agricultural Production and Distribution (March 1, 2022)

Public Health Supply Chain (March 2, 2022)

Freight Flows (March 7, 2022)

Fuel Flows (March 10, 2022)

Information Flows (March 14, 2022)

Demand and Supply Dialectics (March 18, 2022) Seeking synthesis
PCE pulls even harder

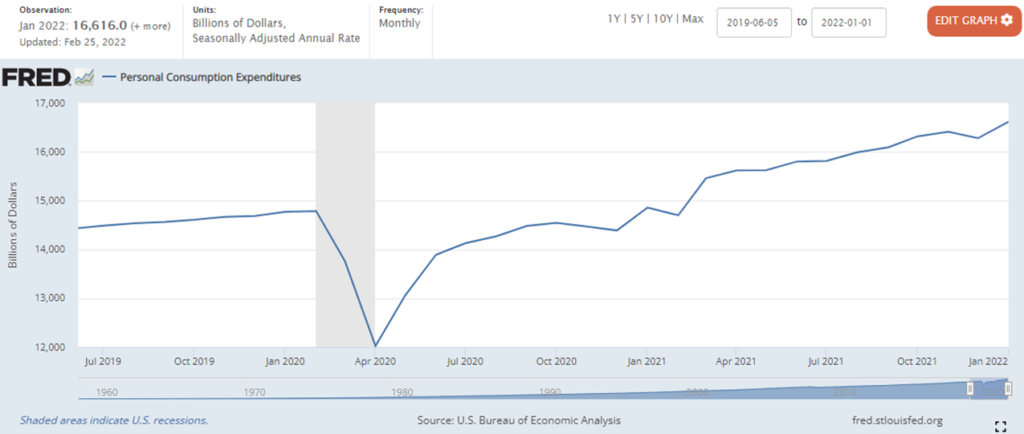
Personal Consumption Expenditures increased in January. As indicated by the chart below, we spent $16,616 billion. In January 2020 Americans spent $14,770 billion.

Our demand for durable goods in January was higher than ever before, even exceeding the Spring 2021 spending frenzy. In January 2020 Americans spent about $1,551 billion on durable goods. Last month we spent more than $2,281 billion. Purchases of non-durable goods increased from $3,015 billion in January 2020 to $3,645 billion in the first month of 2022.

These huge proportional increases in demand over such a condensed period of time explain most of our supply chain friction and occasional failure. This far-above-prior-trend pull for “stuff” exceeds existing processing, production, and transportation capacities. Operating on the outer edge of flow capacity has caused congestion to emerge (especially at the most influential nodes), adding new (often morphing) constraints to existing capacity.

For most product categories, the last twelve months’ demand for goods has been considered non-sustainable: a temporary flux prompted by reduced services spending, accumulated savings, and other pandemic-related punctuations. There are very few goods producing firms investing in capacity to fulfill one-fifth to one-third higher demand. Even with all the troubles, what I find amazing is how well and how quickly most supply chains have adapted to these dramatic shifts in purchasing patterns within the constraints of preexisting capacity.

Last month Americans spent almost $10,790 billion on services compared to $10,205 billion in January 2020. This level of services spending arguably recovers the pre-pandemic trend. To achieve this level of services spending in the midst of a significant omicron surge and related workforce gyrations is meaningful evidence of service sector recovery. Low earning Americans are spending more on basics due to price increases. Higher earning Americans are saving much less than one year ago. There are accumulating reasons for pull velocity to gradually diminish.

I continue to look for signs of push and pull edging toward greater equilibrium. As more pull capacity is focused on services and “excess reserves” are spent down, push capacity could benefit from improved predictability and more flexible supply chain capabilities. In some sectors this can already be discerned. But according to these January PCE outcomes, the pull-push dynamic continues to be unbalanced and potentially volatile.

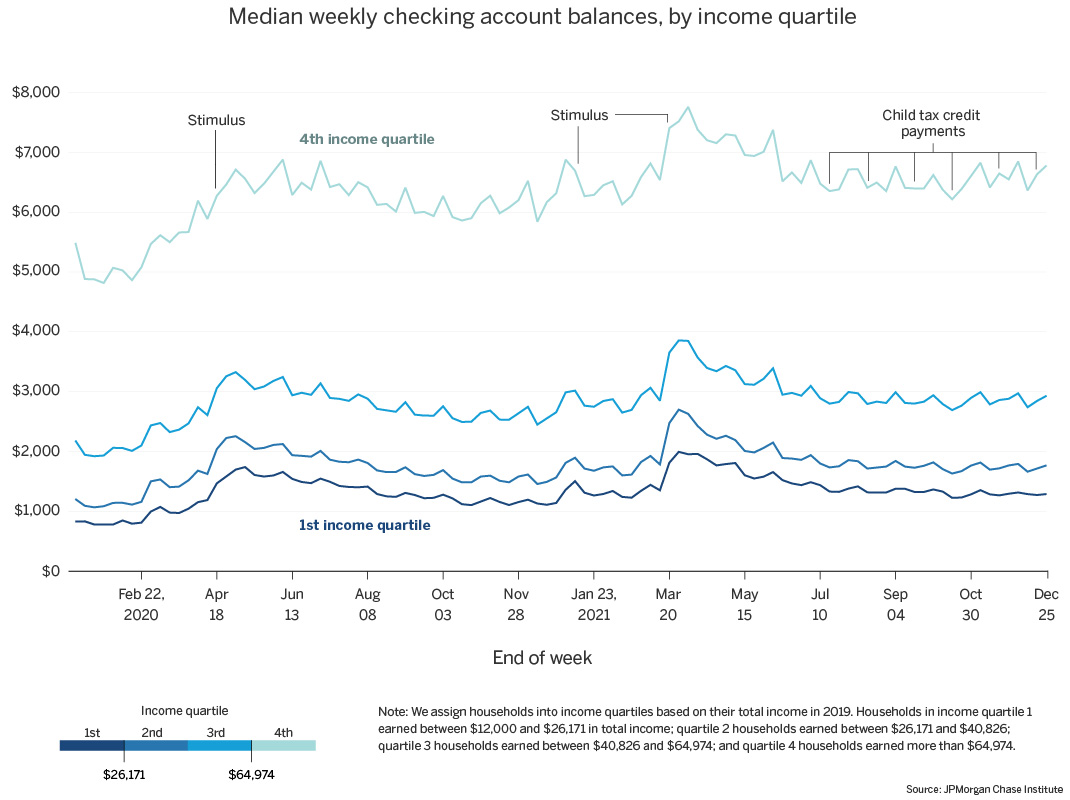
February 28 Update: A couple of related reports that I did not see until after writing what’s above. The Washington Post reports, “Americans are sitting on $2.6 trillion in extra savings…” The Post report also highlights several findings by the JP Morgan Research Institute, including the following measures:

Pulse plots figure 1

Six Supply Chain Assessments

Yesterday the White House released six assessments ordered up one year ago by Executive Order 14017. A capstone report is also provided.

Here are links to each of the individual reports:

Transitioning to Clean Energy

Transportation: Freight and Logistics

Agriculture: Production and Distribution

Public Health and Biological Preparedness (I have not yet found a PDF for the complete report)

Information and Communications Technology

Defense Critical Supply Chains

You can listen to Brian Deese, director of the National Economic Council, give context and his own highlighting at Bloomberg’s Odd Lots podcast.

I am still digging through.

I will, however, confess that my first-blush impressions are less than enthusiastic. I don’t — yet — see a coherent concept of demand and supply networks. Perhaps as a result, there does not seem to be much attention to policy integration across the six reports. I don’t see much attention to meaningful private-public collaboration. I do see plenty of evidence for a government-centric approach.

But… trying to read and think while the Russian military invades a neighbor — while answering lots of related questions — is not fair to the authors of these assessments. More soon, I hope.

Demand potential softening?

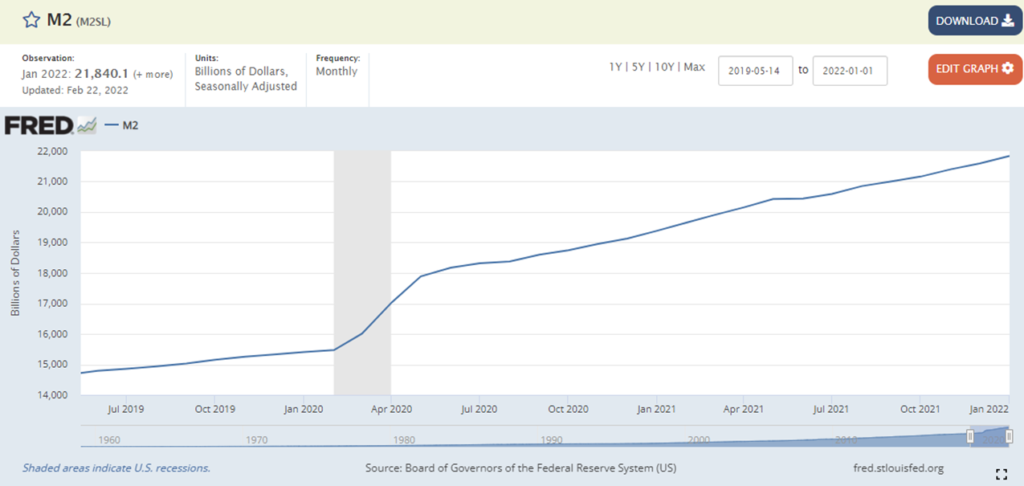
Yesterday the Federal Reserve released an updated measure of the money supply. Liquidity continues to be very high, at least one-quarter above pre-pandemic levels. For many — especially higher earning — Americans this suggests a significant buffer against (cause of?) inflation and support for continued high levels of consumption.

Demand inconsistent with pre-pandemic patterns has (in combination with other factors) challenged global and US production and transportation capacity needed to fulfill demand. Demand increases partly reflect pandemic-related shifts, for example buying more groceries to eat at home instead of eating out at restaurants or buying durable goods instead of traveling. Since Spring 2021 consumption patterns have also reflected pent-up demand embedded in a much higher than ordinary US personal saving rate.

Because most of these demand patterns are unlikely to persist, investment in expanded capacity has often not been sufficient to fill the structural gap (and non-structural adjustments have often been unstable). In cases where significant capacity expansion is underway (such as semiconductors) the additional throughput is not yet not happening — or just beginning to happen.

I have expected supply chain stress to persist until we see more equilibrium in the purchase of “services” versus “stuff” and pent-up demand is spent-down. During the second half of 2021 the US experienced significant recovery in several service-oriented sectors, but the omicron wave disrupted this progress. Still, if coronavirus infections, hospitalizations, and (many) other risks cooperate, this Spring could, even should see significant service-sector expansion.

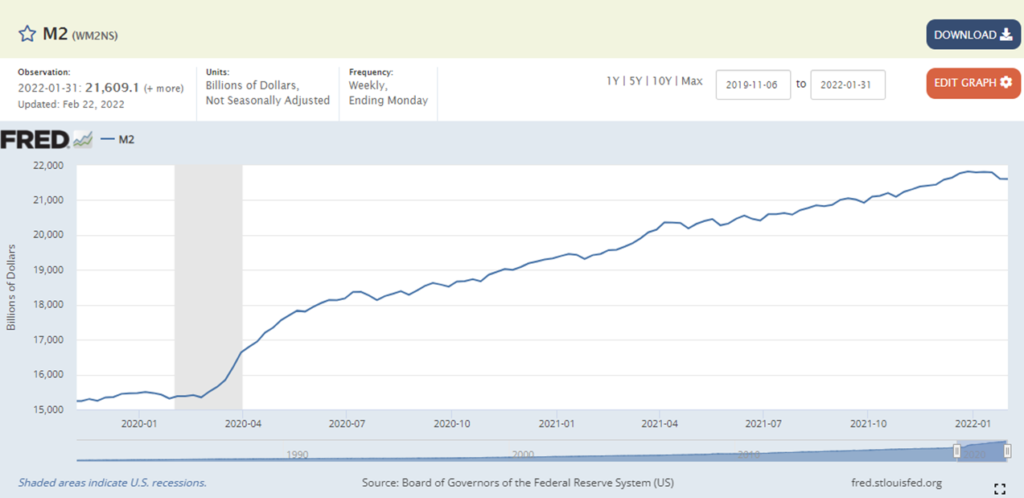
What about pent-up demand? Many economists are skeptical that the US money supply can be meaningfully measured. While I am sympathetic to the issue, the extraordinary expansion of the last two years (and potential implications) cannot be blithely ignored. Recognizing some innate limitations, below are two angles on the M2 money supply. The first chart (M2SL) shows what the Federal Reserve considers its most valid measure. The second chart (WM2NS) is a legacy measure that the Fed still reports, but considers even more troublesome than its sufficiently troublesome M2SL measure. (Here is an explanation of the difference between the two measures.) For personal — perhaps age related — reasons, I have been watching the legacy measure more closely than the other.

I like what I see in January outcomes as reported by the second chart. This is the kind of gradual spend down of cash reserves that would be best for most supply chains (and probably for the US economy). Is it happening or not, given the first chart’s continued upward curve? Well, what is measured by the second chart is happening. The first chart showing the Fed’s revised measure is “correct” given its angle of measurement. Both can be correct. Which angle is most meaningful given our current situation? That will take time to tell.

This Friday there will be an update on January Personal Consumption Expenditures. If we see the overall November-December curve continue into January, I will feel better about my nostalgic embrace of the legacy M2 measure… and the real possibility of a meaningful diminishment of demand’s unsustainable pull on supply chains. Given omicron, I don’t expect much rebalancing between stuff and services for the January PCE. But there are also tantalizing signs that the bounce-back from omicron that started in January could now be accelerating.

Demand AND Inventories Increase

American consumers spent much more in January than ever before. According to the Federal Reserve (see first chart below), November’s previous record was $569,560 million. January retail spending was $577, 740 million for what is usually a comparatively slow month.

For good reasons, commercial enterprises, economists, politicians, and many more prefer strong US consumer spending. But from a supply chain perspective, this persisting pattern of very high demand has been problematic. We have essentially been on flood-watch — and taking flood mitigation measures — for most of the last year.

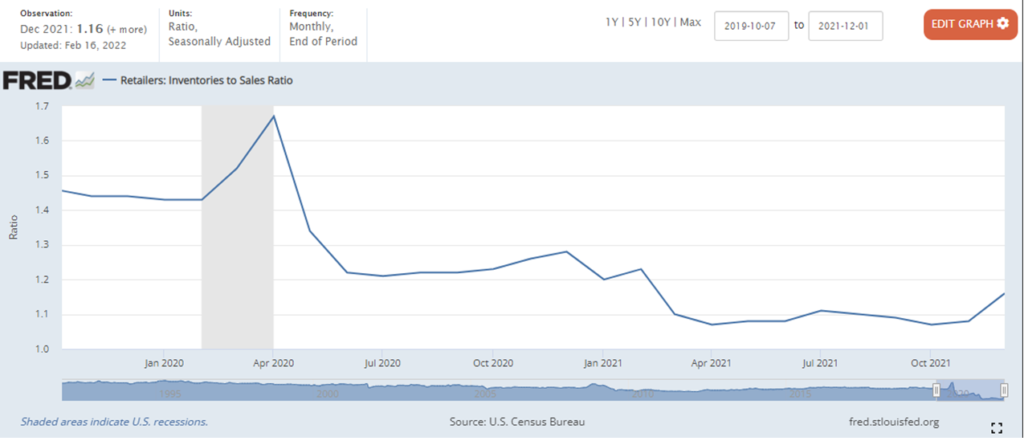
New data, however, also offers some tantalizing evidence that the adaptability and creativity of these mitigation measures may be paying-off (more and more and more). In December we also saw a significant increase in inventories (see second chart below). If we can continue to build inventories, then by summer the disequilibrium of supply and demand could be significantly reduced in most product categories. At the end of 2021 we were at an overall inventory-to-sales ratio of 1.16 (up from 1.07 to 1.08 for most of 2021). A ratio closer to 1.4 has been historically healthy.

The January Producers Price Index can also be read to suggest strong upstream behavior to fulfill anticipated strong downstream demand. (Less sanguine readings are also possible, but this morning I am apparently positively inclined.)

Next Tuesday, February 22, there will be an update on the M2 money supply for the month of January. The last week in December reported a (recently) rare softening in the ultra-high supplies of cash available. If there has been continued gradual softening over most of January, I would take this as good news. From a supply chain perspective, if there is strong demand (sales) and there is reasonable evidence that strong demand can persist (cash reserves available to consumers) and inventories are being rebuilt, then our networks are moving toward a more sustainable, predictable, much less volatile flow pattern.

Omicron absences

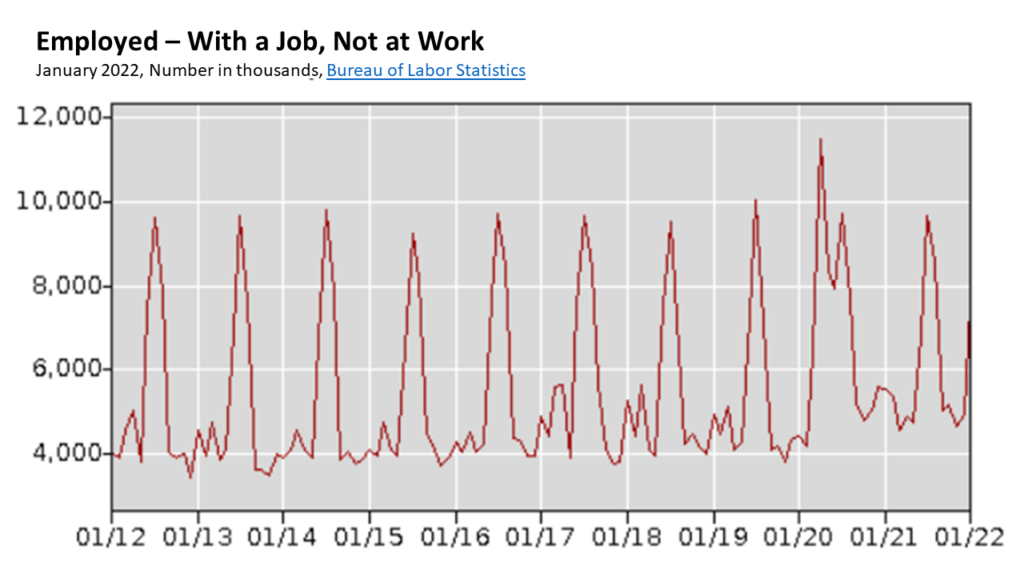
The Bureau of Labor Statistics reports that in mid-January US workforce absenteeism surged on January 19-20 (see chart below). Last month had overall rates of absenteeism higher than any time since last summer’s Delta surge and is the worst month for January absenteeism on record with 2 to 3 million more employed people not at work in the first month of the year than in non-pandemic years. January’s 7.6 million employed people not working is, however, much less than the pandemic peak of 11.5 million in April 2020. Average monthly absenteeism in 2019 was about 5.3 million workers.

BLS surveys found extended illness caused more absenteeism than usual. According to Bloomberg, “The 2.3% of employed Americans not at work because they were ill for the entire mid-January jobs survey reference week was the highest such percentage since the Bureau of Labor Statistics started keeping track in 1976, and by far the highest in recent years.” Childcare complications also contributed, especially on January 20 and later. Data is still being crunched for the last week in January, but trends suggest personal illness continued to climb as the cause of not going to work.

I was worried that omicron-related absenteeism would be higher and extend longer. I was especially watching grocery flows, which seemed to experience the most absenteeism (and/or other stresses) between about January 12 and 19. From soft-soundings (even less rigorous than “qualitative data”) it is my impression that many workers were probably infected with mild symptoms and still came to work — sometimes because they perceived they were especially needed. Justin Fox at Bloomberg offers other reasons.

While stock-outs did increase during January’s second-half, grocery flows were well above 80 percent in every category and every region even in the face of strong demand. Another example of profound resilience or another bullet-dodged? Probably some of each.

Covid Demand Curves

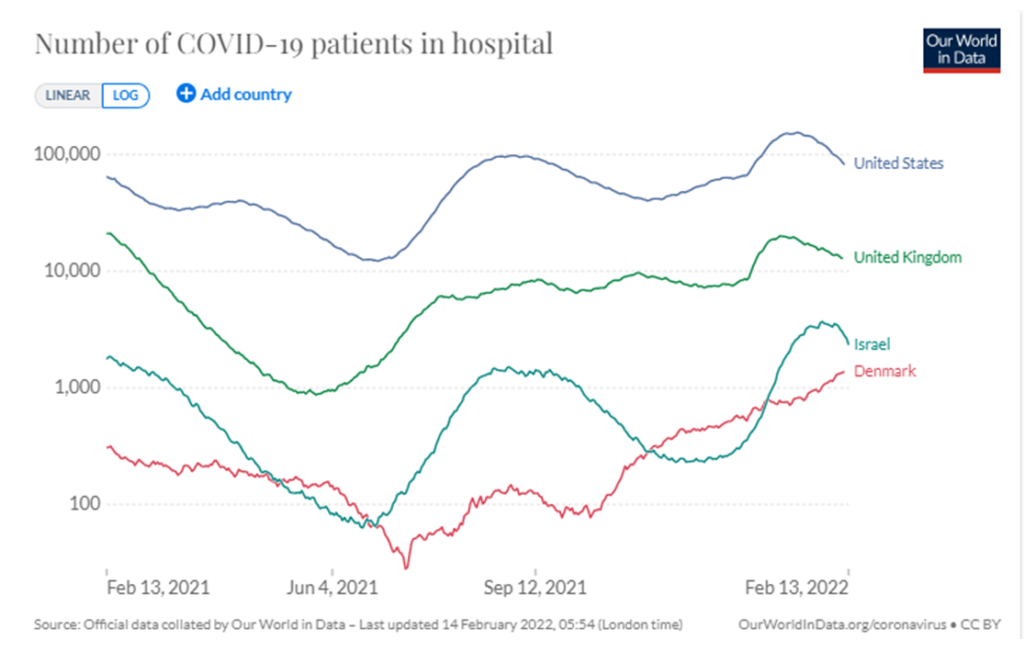
Since last summer this conversation has used comparative change in covid hospitalizations to assess the demand implications of the pandemic. I treat hospitalizations as the most consequential “pull” factor — certainly on the health care system, but also on economic life. Hospitalization is also a leading indicator for deaths.

I have focused on four demand curves: United States, United Kingdom, Denmark, and Israel. I live in the United States as do most of my readers. The other three nations have health surveillance systems considerably more comprehensive and integrated than the United States. So far in the pandemic, one or more of these three nations has served as an accurate bellwether of where demand curves in the United States (and elsewhere) will go in another few weeks.

Below is the comparison as of February 13 (and over the last twelve months). All four nations currently have some of the highest hospitalization counts since the pandemic started. Three of four, however, appear to be undergoing a sustained reduction in hospitalizations. The fourth, Denmark, still has increasing hospitalizations, but has decided there is sufficient health-care supply for the current level of demand. The omicron wave has killed tens-of-thousands, but has also presented a less deadly proportional threat per total transmissions. Most nations now report declines in hospitalizations. But Denmark is not alone, Japan is now at least seven weeks into a surge of covid cases and hospitalizations.

What comes next with covid is unknown. Vaccinations and prior infections are constraining viral effects. Improved therapeutics are reducing morbidity and death. Mutation is ongoing. History demonstrates that pandemics can persist or recur for decades. The context for covid is unprecedented. The global population for the 1918 pandemic was less than 2 billion. There were still fewer than 3 billion for the 1957 pandemic. There are now about 8 billion people and we are much more mobile than ever before. Humans now provide much higher potential velocity for mutations and infections.

We are probably conditioned by evolution to discount risks that are less than imminent. So, as the most recent covid wave fades (slightly, per the chart below), there is clearly a desire to “get-back-to-normal.” This preference is understandable and related behavior can even be constructive. As a mind-set or risk-management strategy, however, such preferences are at least premature and potentially dangerous.

Here’s just one scenario that suggests remaining vigilant: The comparative success of China’s zero-covid strategy (more and more) could, paradoxically, increase its vulnerability to future coronavirus mutations. Given the size of China’s population and the key role the nation plays in the global economy, what goes wrong in China does not stay there.

CPI: Tug of War

The Wall Street Journal headline and sub-head tell the story:

US inflation rate accelerates to a 40-year high of 7.5%: Strong consumer demand and pandemic-related supply constraints continued to push up prices in January.

In January the overall Consumer Price Index (see chart below) demonstrated an accelerating rate of change not seen for a generation.

The volatile food and fuel categories were up again.

Food prices surged 7%, the sharpest rise since 1981. Restaurant prices rose by the most since the early 1980s, pushed up by an 8% jump in fast-food prices from a year earlier. Grocery prices increased 7.4%… Energy prices rose 27%, easing from November’s peak of 33.3%, but a jump in electricity costs was particularly sharp when compared with historical trends.

The Bureau of Labor Statistics provides details on price increases by category. Meat price increases have been a major contributor to overall increases in the food index (12.2 percent January to January for the meats, poultry, fish category).  But there is considerable variation by category.  For example, uncooked beef roasts have increased 19.2 percent while frankfurters have increased 2.1 percent.  Fresh fish and seafood have increased 12.7 percent while shelf-stable (usually canned) seafood has increased 0.8 percent. 

As I scan the variation within several food categories, I wonder – hypothesize – about the cost differentiation in terms of “industrial” versus “craft” processing and merchandising.  More craft-oriented approaches require more workforce investment at a time when covid-related absenteeism has been disruptive and labor markets have been volatile.

Both used and new cars have experienced significant price increases due to both high demand and constrained supply. New cars and trucks cost about 12 percent more than one year ago. Used vehicles are up 40 percent. Car and truck rentals are up almost 30 percent. Housing rent is up over 4 percent. Increases for most of the measured categories are running at four percent or less. But there are enough categories with much higher increases to drag the average for “core inflation” to 6 percent since January 2021.

Petroleum prices have a significant spill-over on fuel, chemicals, fertilizer, plastics, and freight costs. A tight labor market is generating wage increases. As noted again and again, there continues to be plenty of money in the pockets of millions to support high levels of demand. I don’t anticipate demand growth ahead. It is already plenty high. But I do expect demand to become more evenly distributed across sectors and categories. Can core inflation be tamed — to something under 4 percent per annum — by more balanced consumption? Will pent up demand (and available cash) continue to support high employment and even some wage gains? How much push? How much pull?

Semiconductors and the digital dance

The world is not making enough semiconductors to fulfill demand. The disequilibrium of supply and demand is especially troublesome in certain categories. While usually skeptical of “shortage” talk, I recently acknowledged that current automotive production is constrained by a shortage in supply of legacy semiconductors.

But step just a bit upstream from the inventory bins of automotive manufacturers and the demand aspect of this shortage emerges. (Good overview.)

In spring 2020 many automobile manufacturers anticipating sales would crater canceled existing orders for semiconductors. Freed from this commitment to lower margin products, semiconductor manufacturers converted production to higher-margin categories… at the front end of a surge in demand for higher-end categories that started in the second-half of 2020. Automobile manufacturers gave away their place in line.

Since 2020 demand for all-things-digital — and therefore the semiconductor muscles of the digital dance — has done nothing but grow. To reclaim the parts they need, automobile manufacturers are paying more and developing creative work-arounds.

The fundamental challenge, it seems to me, is to reclaim time and space for automobile chips in an ecosystem where demand-pull is surging and supply-push is expensive and time-consuming to grow. Semiconductor manufacturers are expanding capacity. But in the meantime choices are being made about how to maximize current returns and longer-term strategic advantage.

Tuesday GlobalFoundries (one of the planet’s top-five manufacturers of semiconductors) released its 2021 fourth quarter financial results. For the full calendar year shipments were up 17 percent. Revenue was up 36 percent. Implying the ferocity of demand? Two other bits from the report are explicit regarding demand dynamics:

GF entered into 30 significant long-term customer agreements that provide assurance to our customers and provide revenue visibility to GF.

GF and Ford announced a non-binding strategic collaboration to advance semiconductor manufacturing and technology development within the US, aiming to boost chip supplies for Ford and the US auto industry. (more)

When there is a pinch, where do you suppose supply will flow — toward “long-term customer agreements” or “non-binding strategic collaboration”?

Supply organizes around demand.

Maersk perceives smoother sailing ahead

Early this morning (Danish time) A.P. Moller-Maersk, the global shipping giant, released its annual report and 2021 fourth quarter flash summary. Most of the headlines (more and more) point to supply chains “easing” and even normalizing over the course of 2022.

Here are excerpts from page 15 of the annual report, starting with a retrospective on the 2021 market:

Consumer demand for goods was supported by economic policy and the ability to make purchases online, while services demand such as tourism and restaurants remained subdued in the first half of the year. At the same time, the supply side of the logistics industry continued to be disrupted by COVID-19 and capacity shortages, where container availability and air capacity remained tight, and wait times for vessels outside of ports remained lengthy given the bottlenecks in landside transportation and warehousing. Strong demand combined with supply shortages led to sharp increases in cost of logistics services…

That summary of the past year’s outcomes contrasts with a much less confident anticipation of the year ahead:

Going forward, the global growth outlook remains strong for 2022, led by expectations of robust business investments, strong demand, rising wages and relatively cheap capital. Moreover, inventory replenishment will support goods trade well into 2022, and the channel shift to e-commerce is likely to persist. But risks to the outlook are increasing, most clearly for China and Brazil, and with headwinds building for the USA and European consumer. It is highly uncertain if goods consumption will continue to drive up container demand. In the USA, consensus forecasters project fairly flat consumption profiles from current high levels. Purchasing Managers Index (PMI) is also softening in key countries, and the fiscal impulse will start to turn negative in 2022 in many economies. Finally, households’ appetite for services, such as travelling, could begin to take up a larger share of the wallet than usual if the pandemic dissipates during 2022, and the degree of e-commerce penetration remains to be seen.

If goods consumption declines — either from overall diminished consumption or due to a shift in proportional demand for services — then supply chain congestion should dissipate (disappear?). Maersk expects demand to be more evenly distributed across time and product lines by the second half of 2022.

And, of course, risks persist.