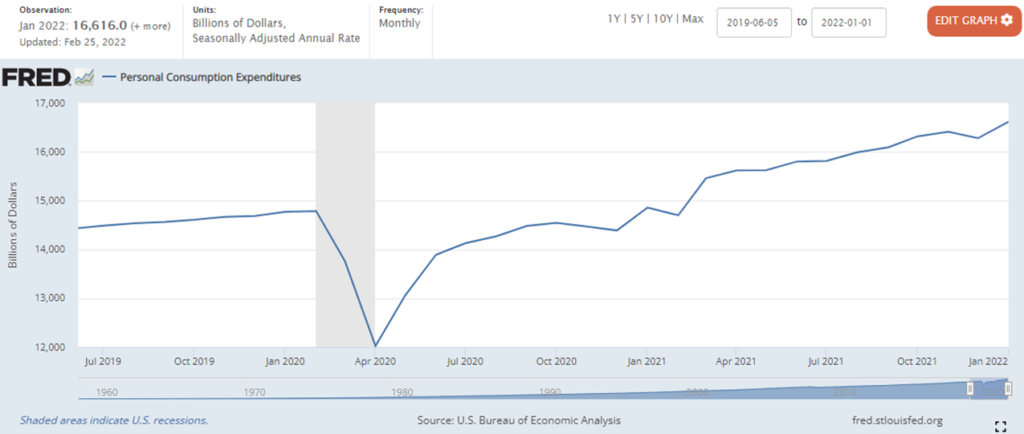
Personal Consumption Expenditures increased in January. As indicated by the chart below, we spent $16,616 billion. In January 2020 Americans spent $14,770 billion.
Our demand for durable goods in January was higher than ever before, even exceeding the Spring 2021 spending frenzy. In January 2020 Americans spent about $1,551 billion on durable goods. Last month we spent more than $2,281 billion. Purchases of non-durable goods increased from $3,015 billion in January 2020 to $3,645 billion in the first month of 2022.
These huge proportional increases in demand over such a condensed period of time explain most of our supply chain friction and occasional failure. This far-above-prior-trend pull for “stuff” exceeds existing processing, production, and transportation capacities. Operating on the outer edge of flow capacity has caused congestion to emerge (especially at the most influential nodes), adding new (often morphing) constraints to existing capacity.
For most product categories, the last twelve months’ demand for goods has been considered non-sustainable: a temporary flux prompted by reduced services spending, accumulated savings, and other pandemic-related punctuations. There are very few goods producing firms investing in capacity to fulfill one-fifth to one-third higher demand. Even with all the troubles, what I find amazing is how well and how quickly most supply chains have adapted to these dramatic shifts in purchasing patterns within the constraints of preexisting capacity.
Last month Americans spent almost $10,790 billion on services compared to $10,205 billion in January 2020. This level of services spending arguably recovers the pre-pandemic trend. To achieve this level of services spending in the midst of a significant omicron surge and related workforce gyrations is meaningful evidence of service sector recovery. Low earning Americans are spending more on basics due to price increases. Higher earning Americans are saving much less than one year ago. There are accumulating reasons for pull velocity to gradually diminish.
I continue to look for signs of push and pull edging toward greater equilibrium. As more pull capacity is focused on services and “excess reserves” are spent down, push capacity could benefit from improved predictability and more flexible supply chain capabilities. In some sectors this can already be discerned. But according to these January PCE outcomes, the pull-push dynamic continues to be unbalanced and potentially volatile.
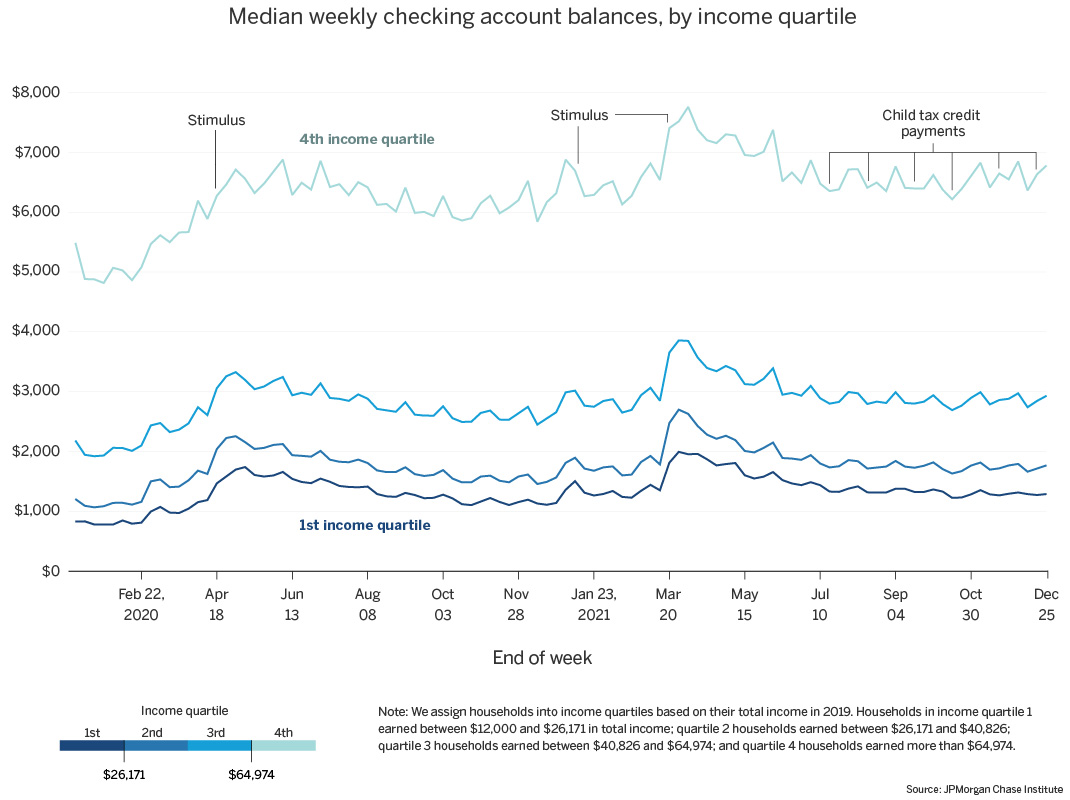
February 28 Update: A couple of related reports that I did not see until after writing what’s above. The Washington Post reports, “Americans are sitting on $2.6 trillion in extra savings…” The Post report also highlights several findings by the JP Morgan Research Institute, including the following measures: