Month: May 2022

Demand: self-restrained strength?

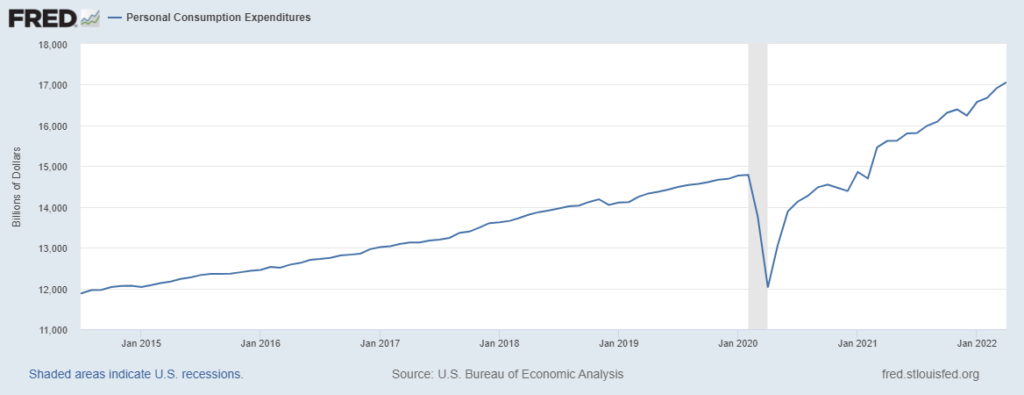
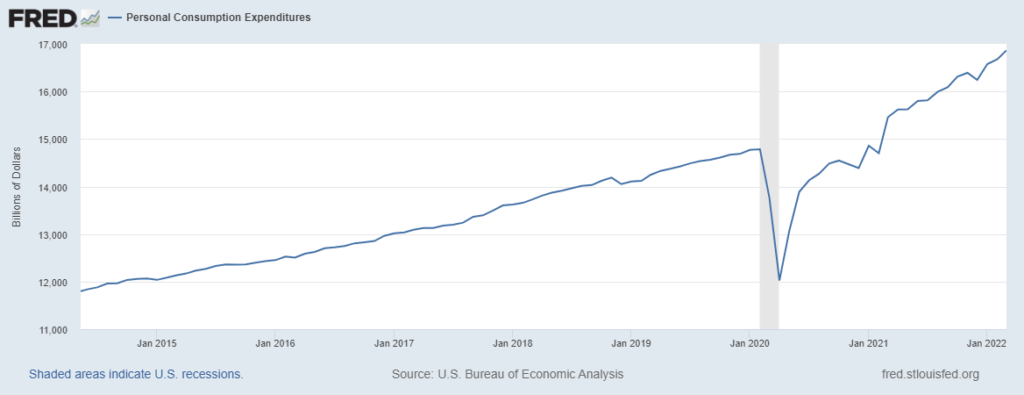
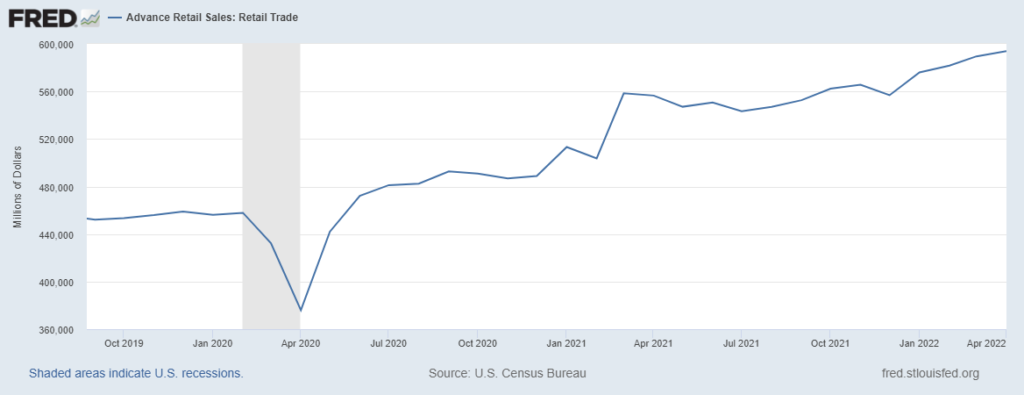
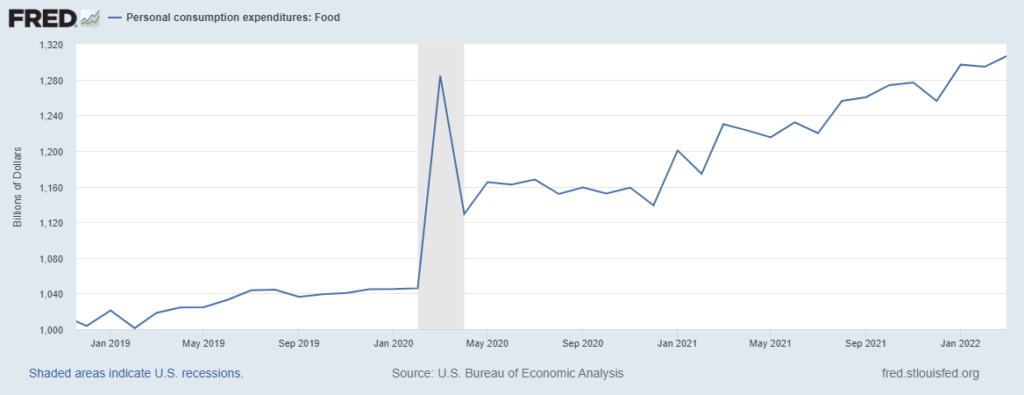
The report on April Personal Consumption Expenditures requires much more time than I can give it this morning. As the chart below indicates, American consumers continued to spend at unprecedented levels. And at least in April… the rate of increase seems to soften while what we buy continues to shift. Rebalancing? Reuters reported:

Goods spending increased a solid 0.8%, driven by new motor vehicles, clothing, footwear, recreational goods as well as furnishings and household equipment. Demand for goods remains strong even as spending on services is picking up. Services outlays rose 0.9% as consumers frequently dined out and traveled. There was also increased spending on housing and utilities, and recreation services… Personal income rose 0.4%, with wages accounting for the bulk of the increase. The saving rate dropped to 4.4%, the lowest since September 2008, from 5.0% in March. That suggests households have been tapping into the more than $2 trillion in excess savings accumulated during the COVID-19 pandemic. The reduction in savings could mean slower consumer spending down the road, especially given the rising borrowing costs.

Without the time to dig deeper into the data, I will offer a story — perhaps an analogy, suggesting a very imprecise hypothesis that will guide my eventual data review. As a junior in high school my football locker was next to one of the biggest, toughest tackles on the team. We were each changing after practice when the freshman quarterback appeared. Just his scrawny presence trespassed on varsity territory. Then, with pathological glee, this thin tiny boy-child purposefully goaded the 200 pound-plus offensive tackle to my right. I was not targeted, still the gratuitous harassment prompted my own bio-chemical reactions. The 6 foot something boy-man totally ignored the interruption.

But once the twerp had disappeared, my neighbor said to me: “I wish he weighed twenty pounds more so I could have smashed him to the floor.” Even at seventeen he understood the need for — and value of — symmetrical response. Given all the treacherous tensions impacting global flows of essential supplies (and the sometimes adolescent volatility of US demand patterns) it is easy to assume the worst and act accordingly. But I wonder if — hope that — there is a chance for some surprisingly mature self-restraint on spending that threads us through this explosive scrimmage between pull and push, demand and supply, inflation and recession.

This will seem a naïve or simply strange narrative for many readers. But in self-defense, it is possible to hear something similar emerging from the most recent CBO economic projections.

Next time: less narrative, more data… I promise.

Persistent but perhaps diversifying pull

I am focused on flows that fulfill demand. When persuasive (my preferred term is effectual) pull signals are received, I want push to deliver what is wanted, when and where it is wanted.

For too long these targets have not been consistently achieved. Flows have been enormous. Delivery has usually happened. But too often demand has not been fulfilled in a timely way. In some cases, demand remains unfulfilled.

Each failure has its own story, but this plot’s principal antagonist is well-above typical demand. Below is our recent run-of-show ala Personal Consumption Expenditures. The new April numbers will be out on Friday, but I will be flying then and may be off-line for a few days.

As previously outlined (here and here), I perceived some easing of supply chain stress in December through late February. But data and chatter have been less clear since Russia invaded Ukraine and Beijing shut-down Shanghai. Now some data-informed observations seem to confirm increasing supply chain stress (here and here).

Does this additional stress reflect increased supply-side problems? There are plenty such problems, even more since late February. But for US-focused flows most of the evidence still implicates demand as most influential.

On Monday, CNBC interviewed Brian Moynihan. The Bank of America CEO tells us this about his customers:

[Their] balances continue to be stable and continue to grow year over year for the broad base of consumers. More importantly, the spending levels in May for the first few weeks are up 10 percent last May, and that is not as high as it would otherwise be because last May people paid taxes, so it actually — it’s a bigger base to grow from. So year to date, they’re up 17 percent fairly standard. In May they’re up 17 percent. The consumers continue to spend. In the balances of our customers, they have more money in April. Their balances were up in March and they grew over all way back to mid last year. So the notion that people are spending the stimulus down isn’t happening yet. It may happen but it hasn’t happened yet.

Significantly higher food prices have not (yet) reduced overall demand for groceries or eating out. The even sharper increase in gasoline prices has (so far) not noticeably impacted demand (though what I see as flat, others perceive as seasonally softer than usual) (plus more and more). Walmart, Target, and other retailers recently reported considerably increased consumption. During the first quarter consumers spent about three percent more at Walmart and the company expects 3.5 percent more in the current quarter. Demand for air travel has increased in May and Deloitte predicts a strong summer travel season.

Since at least October (here), I have expected some sustained softening of pull. This has not happened. American consumers have mostly continued to increase spending (one exception here). Push capacity is often more symmetrical than one year ago because pull is less concentrated. But otherwise demand continues to exceed production and/or transportation capacity for several products and even product categories (e.g. new cars).

Given other indicators, I will be surprised if Friday’s PCE totals do not continue recent upward angles. But it is important to see what is being consumed: the proportional mix of expenditures. Moreover, how much of any nominal increase is obviated by inflation? Are US consumers really pulling more or mostly pulling close-to-the-same at higher prices? For demand and supply to be better balanced, pull needs to be more diversified than over the last two years. Pull also needs to be more consistent with push capacity that accurately reflects fundamental demand, rather than a fun-house mirror of volatility.

Faltering Flows

[Updates Below] Flows of fossil fuels — especially diesel — are much more viscous than usual. Sources of many manufactured products in China have been cut-off or slowed. Disequilibrium has deepened (again) between demand and supply for semiconductors. Flows of easy credit are being purposefully curbed. The specialty formula debacle has unnerved many who are not involved in feeding infants. Food and related — such as wheat, fertilizer, sunflower and palm oil — are stuck behind enemy lines or maritime blockades or defensive walls of export controls.

In each of these cases the cause is not a loss of core capacity or even — yet — lack of abundant supply. Rather, government actions intended to mitigate plague, war, inflation, or hunger are complicating or curtailing flows from going where they would often otherwise go.

In most cases, the policy intentions are unimpeachable (Putin’s excepted). Execution is innately complicated and too often can be clumsy, contradictory, and even self-subverting (Putin’s Ukraine policy is a fair example). Recent outcomes are prompting concern or alarm or, in some places, panic. For many of these flows, current risks have been amplified by a long series of choices — both public and private — that have concentrated supply or demand or both, pooling risk in fewer places and players. The resulting structure tends to amplify both good and bad. Just now, bad seems ascendant.

Time, space, and cost constraints are fundamental in each of these flows. Some of these flows — ultimately, all of these flows — are interdependent. Taking on one problem can cause two more. As always, there is a risk of the urgent obscuring or fatally delaying opportunities to engage what is most important.

The time-dimension of growing food pushes me to give food flows strategic priority.

For the highest volume global food producers, agriculture is seasonal. Crops must be planted in different places encompassing enough space within a particular time-frame or yields will suffer. Sufficient water and fertilizer must be applied in a timely way or yields will suffer. Harvesting must be completed within narrow seasonal constraints or yields will suffer.

Once the harvest is gathered other time-and-space factors accumulate, but these tend to be much less austere than the planting-to-harvest temporal “bottleneck”. There is cause to perceive that China’s manufacturing capacity will be reengaged whenever policymakers decide to get out of the way. Carbon extraction and fossil fuel production are not seasonal. Meanwhile, wheat or corn or barley is produced this season — or not.

Too much food — especially too much wheat and sunflower oil — is currently trapped in Ukraine (more). There are roughly 22 million tons of last year’s harvest still in storage across Ukraine. With Odesa, Kherson, and other major Black Sea ports blocked, these stocks are seeking other routes. For example, the Romanian port of Constanta is less than 300 miles south of Odesa and familiar to Black Sea carriers (more). These innovative flows have near-term implications for feeding millions in the Middle East, Horn of Africa, and South Asia. As of mid-May Ukraine’s grain exports are only about one-third of last May’s volume.

Moving last-year’s harvest is also necessary to make room for this year’s harvest. In early May it was estimated that even in the midst of war Ukraine’s farmers may be able to plant about 11 1/2 million hectares — about one-fifth to one-quarter less than usual. In recent years Ukraine’s proportion of global grain exports has been a bit more than ten percent overall, but well over half for specific markets such as Egypt, Indonesia, and Pakistan (more). The United Nations World Food Program has also purchased significant amounts of Ukraine’s grain for emergency food assistance. Depending on yields and flows from other grain producers, losing two percent or marginally more of international grain exports ought not be catastrophic.

But as of mid-May only about one-third of Ukraine’s lower-than-usual number of hectares had actually been planted. Fuel and fertilizer shortages in Ukraine are complicating planting (more). It is reasonable to assign a risk premium for harvesting whatever is finally planted. As a result, Ukraine’s reduced food output is causing a price surge in several food commodities, especially wheat. There are other risks: Russia is usually a major grain exporter too, but its exports are complicated by sanctions. Due to drought, this year’s US winter wheat yields were well below normal. Heavy rains decimated China’s winter wheat harvest. Below is a chart that provides one angle on wheat futures contracts since the beginning of the year. (More.)

Even with price controls, in Egypt bread costs at least one-quarter more than one year ago. It is getting more difficult to find bread to buy in Lebanon. (More and more and more). Many countries do not have sufficient dollar reserves to buy enough higher priced grain to fulfill local demand.

Some key food supplies are tighter than typical just now. Given what is not happening now, supplies could be even tighter next Spring. In some places that typically depend on food flows from Ukraine and Russia, delays and uncertainty are prompting pull signals (price increases) to fill the gap between demand and supply with flows from other places. While this stronger pull is motivating the emergence of new push channels, some downstream prices now exceed the local ability to pay. Demand persists, but an increasing proportion of demand cannot be effectually expressed and is essentially being excluded from pull and push (see Yemen, Somalia, Sri Lanka, etc.).

As the links above and this week’s UN Security Council special meeting demonstrate, the problem with food flows is well-recognized. It is not, however, claiming the priority required to make practical progress. Disrupted Ukrainian food flow is a problem that will get worse without sustained, significant action starting now. Key steps should include:

  1. Maximize and optimize the Constanta Corridor for discharge of Ukraine’s food exports.
  2. Increase deliveries of fuel, fertilizer, and other key inputs to Ukraine’s farmers.
  3. Reinforce effectual food demand for people in places where pull signals have encountered the most interference due to currency gyrations and physical disruption of preexisting supplies.

Ukraine is an important preexisting node in global food flows. Reassuring markets that these flows are likely to persist will reduce price volatility for everyone. Focusing on preexisting network capacity and players is the most efficacious means for doing this. Providing effective mechanisms for expressing real demand will target flows and reduce misdirection caused by consumer hoarding or market manipulation or dependence on relief programs.

Global networks of demand and supply are morphing in response to Ukraine’s flows and future possibilities. To the extent upstream push can be more confidently anticipated and downstream pull can be better balanced, midstream rapids or portaging can be minimized. And… famine threatening hundreds-of-thousands can be avoided.

+++

May 24 Update: Bloomberg reports: “Russia has continued to ship its wheat at the now-higher price, finding willing buyers and raking in more revenues per ton. It is also expecting a bumper wheat crop in the next season, suggesting it will continue to profit from the situation. Global wheat prices have risen by more than 50% this year, and the Kremlin has collected $1.9 billion in revenues from wheat export taxes so far this season, according to estimates from agricultural consultant SovEcon.” While this is unwelcome in terms of sanctioning Russia’s invasion of Ukraine, it is good news for flows and fulfilling demand. Bad can sometimes unveil good. The reverse is also possible. The full Bloomberg report is helpful to read.

May 25 Update: Reuters reports: “Russia is ready to provide a humanitarian corridor for vessels carrying food to leave Ukraine, in return for the lifting of some sanctions, the Interfax news agency cited Russian Deputy Foreign Minister Andrei Rudenko as saying…” (more and more and more and more). LATE ON WEDNESDAY: Bloomberg reports: “Russia’s Defense Ministry said it’s opening two sea corridors for international shipping from seven Ukrainian ports, after growing international criticism of an unfolding global food crisis triggered by a Russian blockade.” (More)

May 26 Update: Bloomberg reports: “The Netherlands would consider joining an alliance to send warships to escort grain supplies stuck in Ukrainian ports but would need assurances from Russia and, ideally, involvement from Turkey, according to the Dutch defense minister. Estonia and Lithuania have been calling to establish a coalition of the willing to send naval escorts for grain freighters, as European officials decry Russia’s effective blockade of Ukrainian ports that’s left Kyiv struggling to get grain shipments out.” (More)

Above in my original post I focused on the Constanta Corridor — instead of Ukraine’s Black Sea ports — because I considered the prospect of Russia cooperating to be scant. The Constanta Corridor should still receive priority attention. But the last two days suggest a slightly improved possibility of restarting flows from preexisting nodes using preexisting channels… which would certainly be the most effective and expeditious means of reclaiming prior capacity. There is also an urgent need to address the second priority noted in the original post: supplying Ukrainian farmers who are currently planting the fall harvest. Their fuel supplies are very tight and tightening.

May 27 Update: Bloomberg offers a concise update on Black Sea flow options for grain, including the following map. Constanta Romania is about 260 miles by road or rail south of Chornomorsk (more and more). S&P Global also reports on potential social instability related to food price increases. (More channel options in this very helpful May 29 report by Bloomberg. The report includes, “For now, the most realistic solution remains Romania, Constanta and the Sulina Canal that links the Black Sea with the Danube.”) (Related S&P report on sunflower oil.)

May 29 Update: The Financial Times reports on a Saturday phone call: “Putin, Scholz and Macron discussed whether a negotiated solution could be found to open Odesa to allow grain exports to leave Ukraine, according to an Elysée briefing after the call. The French and German leaders “noted the Russian president’s promise to allow ships to access the port to export grain without it being used militarily by Russia — if the port was demined in advance”, according to the briefing. Berlin said the call lasted 80 minutes and was “devoted to Russia’s ongoing war against Ukraine and efforts to end it”. These negotiations with Putin are not supported by all European leaders (more and more).

April US retail sales

US consumers continued to spend more than ever before (see chart below). But there may be some signs of cooling demand. For example, grocery store sales were up 8.6 percent from April 2021, but were slightly down from March 2022: $68,286 million compared to $68,560 million (not adjusted for inflation). Spending at food service places increased from March to April: $86,421 million compared to $84,643 million. Are we finally seeing Food-At-Home better balanced with Food-Away-From-Home? As you may have noticed, answering this question has been a personal preoccupation. (More and more)

Price improves pull prospects for diesel

During April, diesel volumes via the Colonial Pipeline declined. Mid-Atlantic diesel inventories saw sharp drawdowns (more). US Gulf Coast refiners diverted flows toward higher prices in Latin America and other markets (more and more).

During the last week in April the price of diesel delivered into the New York Harbor market increased from $4.27 per gallon to $5.16 (see chart below). US diesel prices have mostly continued to climb (more). The second chart below is for June futures contracts on NY Harbor diesel.

Meanwhile, Latin American demand has softened. After the end of the trading day on Friday, May 13, S&P Global reported, “Latin American diesel prices are fading from record highs… Waterborne premiums also were falling in the US Gulf Coast, the main source of diesel for the region, and plunged May 13. The premium paid for barges and cargoes compared with the more liquid pipeline assessment had risen to 13.45 cents/gal by mid-April, the highest level in at least seven years. But it was tagged May 13 at pipeline plus 3 cents/gal. Market sources from both sides of the Atlantic attributed the waterborne decline to less USGC cargo demand from Latin America.”

Refining capacity is tight for all products. Global demand is strong for refined product — especially diesel. The US Energy Information Administration recently predicted that US refineries will operate at up to 95 percent of operating capacity for the summer driving season (with about 31 percent of capacity dedicated to diesel). Given constrained capacity, the tendency for push to follow the highest-priced pull is especially strong. New York is much more attractive this week than three weeks ago.

Attractive enough to pump more diesel volume into the Colonial Pipeline?

It is possible to track flows of natural gas in Ukraine’s pipelines (even in war time). Flows of refined product from Greensboro, NC to Linden, NJ and in-between are not as transparent. Colonial typically transports about 100 million gallons of fuel per day. Several have claimed that late April pipeline flows were well below this capacity. How much? I don’t know. I have talked to three old friends who focus on the fuel market everyday. None of them are sure if more is flowing today. But they each independently expect (one offered to bet) that we will all know by Memorial Day. Two of the three perceive that the increased price into NY Harbor will pull enough to meet demand — and even rebuild inventories a bit.

If I was in a different position — say, the Governor of North Carolina’s chief-of-staff, the CEO of a mid-Atlantic chain of truck stops, the Executive VP of a national trucking firm, staff with the National Security Council — I probably would be calling my friends in Alpharetta with some questions. And if I did not have any friends in Alpharetta, I would decide it was time to make some new friends.

New York Harbor diesel price through May 9

New York Harbor June Diesel Futures as of May 15

+++

Special Note: On May 13, S&P hosted a podcast focused on tanker market dynamics since the Russian invasion of Ukraine. Sanctions on Russia have complicated and at least marginally reduced flows of Russia’s diesel into the European market. This disruption and related uncertainties have created new opportunities and widespread volatility, especially for midstream transportation providers. The podcast’s discussion does a good job of framing this context and (for better or worse) allowing outsiders to listen-in while insiders talk through some rather arcane midstream realities.

Mind the gap (between demand and supply)

Inflation measures the rate of price increases over time.

Surrounded by demand and supply networks, I experience price increases when demand exceeds supply. The greater the gap between demand and supply, the faster and sharper the rate of price increases.

Mind the gap.

Some inflation is helpful. An emerging gap signals where demand is going. Closing that gap — per time and/or space and/or content — spurs creativity, productivity, investment — the wise effort of consumers, enterpreneurs, and great enterprises.

Narrow gaps suddenly crumbling into yawning chasms are dangerous.

During the pandemic’s first year rapid demand-destruction permanently closed almost 80,000 restaurants, over 10 percent of the sector. Supply far exceeded demand. Early in the pandemic’s third year, high speed swerves in demand have opened sink-holes for some who did fine that first year (e.g. Peloton). Even steep price discounts cannot always stop the slide.

If prices for food, fuel, or other fundamentals rapidly exceed an ability to pay, such vulnerability can unfold into fear. If the gap continues to widen, fear can become hunger. The gap can prompt violence. The more who are unable to cross the chasm, the more suffering… the more fear… the more potential for violence.

Please see the Global Report on Food Crises (2022). Please listen to or read this interview with the CEO of Feeding America. According to the Bureau of Labor Statistics food prices since last April have increased 9.4 percent, the largest 12-month increase since the period ending April 1981.

Even when the threat is not as existential, a quickly widening gap between demand and supply can depress consumption. From a systems perspective, inflation can be understood as a warning signal of excess demand: consumption exceeding production capacity.

But despite a high inflation rate in March 2022, US Personal Consumption Expenditures continued strong and even grew a bit. Personal expenditures on food were the highest ever recorded (see chart below), even higher than March 2020 hoarding. That March 2020 spike, also known as nervous buying or pantry stockpiling, emerged from the run-up and aftermath of mandated lock-downs. The sustained increase in food expenditures over the next many months reflects increased purchases of Food-At-Home, making up for folks not eating out nearly so much during 2020.

By Spring 2021 Americans started spending about as much on Food-Away-From-Home as we had pre-pandemic — and, yet, our spending on groceries continued to grow (more and more). Subtract food inflation from the overall increase in food expenditures and we still have a double-digit increase one year after we restarted full-scale eating out.

I am surprised. I don’t understand why Food-At-Home consumption has not fallen back to something much closer to pre-pandemic patterns. But, whatever the cause, these data help explain the persistence — even escalation — of food inflation. Sure, there have also been — and will be — supply-oriented inflationary influences. Drought, labor shortages, diesel prices and such have nudged up costs. Increased fertilizer prices will impact this year’s food prices. But a two year ascent in aggregate demand is the principal cause of the gap between demand and supply for food.

Food production capacity has also expanded. The United States is processing more food than ever before. But growth in demand has been even more abundant than growth of supply (more). I assess that today we have a “normal” gap of roughly five percent plus another one-tenth caused by the persistent increased demand for Food-At-Home.

The April Consumer Price Index reports that the rate at which US overall demand exceeded overall supply was the narrowest in twelve months — about one-fourth as fast as March 2022. Is this a trend or just an example of volatility?

The answer will depend mostly on current and near-term US consumer behavior. Many Americans still have an unusually large amount of savings. Employment is very close to its pre-pandemic peak. Wages continue to grow. There are at least 11 million unfilled jobs. This context is receptive to continued strong demand… and an expanding gap between demand and supply… in other words: more inflation.

There is, however, the possibility — unlikely as it may be — that consumers could slightly cut back food expenditures for three or four months. If high earning, well-fed Americans would spend (only) about ten percent more than they were spending in 2019, food inflation would flatten. Demand and supply would approach equilibrium. The gap would narrow. The chasm would almost close. No one would need to lose their food industry job. No one would need to sacrifice taste or even calorie counts. Price increases would slow and might even stop. Similar consumer behavior in other high-demand categories could have similar results.

Prospects for this happening are so improbable, it may seem delusional. But I notice that near the close of the inflation-fighting “Volker Recession” of the early 1980s, food expenditures peaked in October 1982 and then fell for five of the next six months just as record-breaking interest rates fell and the nation pulled out of recession. This sharp turn in food expenditures is unusual both in depth and duration, but the four decade old precedent supports the possibility

May 12 Update: Overnight a reader sent me this link to Martin Wolf’s Tuesday column in the Financial Times. I had missed it. She comments, “The two of you are looking at the same behavior and perceive similar patterns. You emphasize a positive that is possible, but unlikely. He acknowledges the positive possibility and explains why it is unlikely. The complex adaptive system is self-organizing to create equilibrium. Which will win: your “wise effort” (sammā-vāyāma?) or gluttony?” I very much appreciate the link… and such a careful reader (even between the lines). She asks a meaningful question. The choice she offers would seem to favor Mr. Wolf’s assessment…

Watching ocean horizons

[Updates below] This morning there are 111 vessels at the Port of LA with at least sixty-seven on the way, according to MarineTraffic (see chart below). This is less crowded than last fall, but still plenty congested compared to any pre-pandemic day. On Friday the Executive Director of the Port of LA said April cargo volume had been the second highest on record (last year was higher). He does not see dramatic changes in vessel traffic heading his way from China (more and much more).

Covid-related lockdowns in China have decimated domestic demand, imports are down from oil to soybeans (more). Production is down and very spotty. For example, take steel exports, according to S&P, “In the first four months of 2022, China shipped 18.156 million mt of finished steel, 29.2% lower on the year.” Transportation to and from many major ports is deeply disrupted (very helpful link). Flows between China and North Europe are clearly declining (so is European demand). Prices for trans-Pacific transport are softening (more and more). Upstream drought will eventurally reduce downstream discharge.

And… where there is pull there is often push. So far, Americans are continuing to buy. Purchases of imported consumer goods during 2022’s first quarter were higher than 2021 and well above pre-pandemic patterns. Most of these goods originate in China. Despite crazy covid constraints, steel is still being shipped. China’s aluminum production is strong and exports have increased. While Shanghai is locked-down, Shenzhen has reopened. Over the last month, the number of vessels arriving and departing Shanghai has typically ranged between 1200 and 1500 per day; nearby Ningbo is running about about 600. Yantian (Shenzhen province) serves fewer — but very big — vessels and has seen comparatively normal come and go. Some sources see China’s port congestion slightly easing… There is a drought, but the well is not yet dry.

There are profound problems with China’s recent economic productivity. Prospects for early improvement seem to be dissipating. What started as short-term delays are edging toward systemic demolition of some flows. There have been and will be implications for US consumers (and more). But what will be impacted when and where — and how badly — are not yet clear to me. I absolutely perceive a demand and supply network under severe duress, but I also see surviving demand, surviving capacity, and considerable adaptation. It is plausible to lean toward worst cases. A bit more analytic restraint — and patience — may, however, be prudent.

Totals through midnight on May 8, 2022

+++

May 14 Update: In a long-form detail-rich assessment of China’s economic slowdown, the Wall Street Journal concludes, “The amount of drag China puts on the global economy will depend on how severe the country’s downturn gets. Fortescue Metals and Rio Tinto both said they are optimistic that Chinese demand will recover and some economists are hopeful that ebbing caseloads and government stimulus will propel faster growth later in the year. With Western demand easing, supply-chain strains may not get as bad as they were last year, some analysts say.”

May 15 Update: A Financial Times “Big Read” joins us in looking closely and trying to discern what is happening inside China and with outbound flows. The FT reports profound problems across China, but — so far — reasonably responsive flows still emerging from China. Please see chart below. Shanghai is especially troubled, yet cargo is still being loaded and shipped. Shanghai is important, but there are other — less troubled — ports in China that continue to receive and discharge flows. Other East Asian ports are operating close to normal. The disruption of domestic demand and supply in China does have dramatic consequences for China’s consumers, producers, and mid-stream providers. There are accumulating constraints on fulfilling global demand. Impacts differ category to category and product by product. For what it is worth (and probably not much), I currently perceive that US consumers are unlikely to experience generalized short-falls in China-sourced flows until September-October with the stock-build for Christmas. How big and troublesome these gaps could become will reflect demand and supply variances that I cannot yet confidently predict.

Financial Times and project44 as of May 12

May 16 Update: Economic data released today confirms a contracting China economy. According to Reuters: “Retail sales in April shrank 11.1% from a year earlier, the biggest contraction since March 2020, data from the National Bureau of Statistics (NBS) showed on Monday, a steeper decline than forecast in a Reuters poll. Factory production fell 2.9% from a year earlier, dashing expectations for a rise and the largest decline since February 2020, as anti-virus measures snarled supply chains and paralysed distribution.” (More and more and more.)

May 17 Update: Helpful report on trans-Pacific flows from Bloomberg, including excerpts from an interview with the Executive Director of the Port of LA. Gene Seroka said, “Freight is “finding its way through to the Yangshan deep-sea port and if not, it’s going down to neighboring port Ningbo, which is up 25% over this past two months,” the L.A. port chief said. “We’re watching day and night, but so far, the cargo flows seem to be very consistent.”

May 18 Update: The Financial Times provides a concise overview of demand destruction in China. The unanswered question is: how much does this domestic demand destruction bleed into disrupted global supply capacity? Time-and-space factors are especially unclear. Given calendar and context, is capacity relocating? How much, how quickly? How sharply can capacity rebound? How gradually will capacity rebound? Does cratering demand in China reinforce softening demand in other markets?

Drilling into diesel demand

[ May 13 update below.] Russian refineries typically sell a significant portion of their diesel fuel to European customers (more). Early-stage European sanctions related to the Russian invasion of Ukraine complicated, but did not stop this flow (also see second chart below). The complications and partial constraints did, however, increase prices. For example, the chart immediately below shows the average Euro price of a liter of diesel sold in Germany since the end of January. In the last few days the price has increased again as an oil-specific set of EU sanctions may be implmented (more and more).

Facing current complications and future uncertainty, diesel buyers in Europe turned to North American, Middle East, and Asian refineries for increased diesel flows (see chart below). Especially since global prices escalated, refiners have been motivated to sell. In the case of US Gulf Coast refineries the atypical European demand coincided with increased diesel demand from established Latin American markets (more and more). In late April, according to Bloomberg, “Waterborne diesel exports out of the U.S. Gulf Coast have climbed to 1.04 million barrels per day so far this month, on track to hit the highest level since August 2019, according to estimates from oil-analytics firm Vortexa. Volumes to Europe have seen the biggest jump in the period to 84,700 barrels per day, on course for an eight-month high.”

Given solid international diesel demand and higher prices, over the last several weeks many US refiners have sold inventories and increased diesel production (constrained by fixed capacity, probably the most important link in this post). According to the US Energy Information Agency, as of the end of April US diesel inventories were less than half 2021 same-time levels in New England and the Mid-Atlantic and about one-fifth lower along the Gulf Coast and the lower Atlantic. Since the invasion of Ukraine, diesel imports (typically an important part of the mix in New England and the Mid-Atlantic) have fallen from over 400,000 to barely 100,000 barrels-per-day. Meanwhile US diesel exports have increased almost 50 percent since early March.

US domestic diesel demand has been mostly within recent seasonal averages and slightly lower than last year. As a result, even though the US average retail price for diesel has also spiked (see chart below), there has been an incentive to serve displaced demand in Western Europe and nervous demand in Brazil. Part of the risk calculus — and related urgency — has included the possibility of an early end to the invasion of Ukraine restoring full-speed Russian diesel flows and lowering prices. [Late on this Victory Day, the “risk” of an early end seems considerably reduced.]

The reduction in diesel inventories has been especially pronounced in US east coast markets served by the Colonial Pipeline. Colonial’s Line 2 moves diesel from Gulf Coast refiners to Greensboro, North Carolina. Line 4 delivers diesel from Greensboro to Linden, New Jersey. It typically takes at least two weeks and up to twenty-four days for refined product to move end to end. In the current market environment, this means diesel in the pipe is more or less creeping inventory. According to several market sources (more and more), since early March Colonial has loaded much less diesel than usual. S&P interviewed an official with the largest US refiner:

Brian Partee, Marathon’s head of clean products, said that increased distillate exports have tightened the US Atlantic Coast market, which is seeing lower European imports as well as lower flows up the Colonial Pipeline, the main conduit of refined products from the USGC refiners to New York Harbor. But this is a function of timing, and the “run-up in the prompt front end of the cycle,” he said, allowing Marathon to capture current high diesel prices immediately through export rather than waiting for the time it takes diesel to move up the Colonial Pipeline.

At the end of April there was a significant price surge for diesel contracts in the New York Harbor market (see chart below). According to Bloomberg on April 26:

Diesel futures trading in New York surged to the highest level in records going back to 1986 as global demand for the fuel remains robust in the wake of Russia’s invasion of Ukraine.  Nymex ultra-low sulfur diesel futures settled at $4.4679 a gallon on Tuesday, exceeding the prior record on March 8, when the U.S. formally sanctioned Russian oil. Since then, diesel has become the world’s most in-demand fuel as buyers in Latin America, Europe and within the U.S. compete for supplies as fast as refiners on the U.S. Gulf Coast can make them. 

This additional pull should attract additional push up the Colonial Pipeline. You can follow the price and futures action here.

New York diesel futures settle at a record high as stockpiles drain

May 10 Update: According to the Financial Times and others, European Union and G7 efforts to develop oil-specific sanctions on Russia are faltering. “Brussels has shelved its plans to ban the EU shipping industry from carrying Russian crude as it struggles to push through its latest sanctions package because of anxiety among some member states about the economic impact of the measures.” Other potential oil-specific sanctions — while still being negotiated — have also encountered resistence from EU member states. S&P reports, “Crude oil futures were sharply lower in mid-morning Asian trade May 10, extending steep overnight declines, as recession fears, hurdles to an European Union-ban on Russian oil and the ongoing spread of COVID-19 in China saw sell-offs across the financial markets.”

+++

May 13 Update: The Wall Street Journal reports, “… the price for the diesel fuel that is crucial to industrial business has continued going up. That has added to rising costs in supply chains and to inflation pressure on things from housing construction to deliveries of consumer goods. The costs are hitting smaller trucking fleets that make up the bulk of the highly fragmented U.S. trucking market particularly hard, worsening cash flows for businesses that tend to be lightly capitalized with little cushion to absorb sharp changes in costs.”

Fuels find flows

{May 11 update below] Russia’s natural gas suppliers continue to pay Ukraine’s pipeline operators to transport product to paying customers farther west (please see map below). As shown in the chart, bookings and flows have been roller-coastering, but recent volumes often remain within range of early 2020 and most 2021 levels (more from Reuters and S&P and NYT). Russia’s oil outputs have been harder hit by Western sanctions (more from the BBC). But at the right price, buyers can still be found. Quick price hikes for global fossil fuels following Western sanctions have been contained by China’s economic slowdown… and the potential of lower global demand (more). More stubborn demand equals more stubborn supply. Less stubborn can also generate symmetries.

May 11 Update: According to Bloomberg: “Ukraine’s gas network operator said late Tuesday it would stop receiving Russian fuel through the cross-border Sokhranivka station at 7 a.m. local time because it can’t control the infrastructure in the occupied territories. Russian gas giant Gazprom PJSC said it can’t reroute supplies to another entry point, Sudzha, because of how its system currently works.  The development marks the first time the war in Ukraine has disrupted gas deliveries to Europe via the country. Russian gas had been flowing normally through both entry points despite the conflict, although most of the time at lower rates than the transit deal envisages.”

Logistics Managers Index eases

The LMI focuses on the growth of US domestic flows. Slower growth, faster growth, or contraction is measured for a set of eight data indicators. Writing for the team of analysts, Zac Rogers provides this summary of April outcomes:

Inventory and Warehousing metrics remain elevated, but Transportation has clearly slowed. Whether this slowdown will result in recessionary pressures or is simply the market moderating towards more sustainable levels, remains to be seen… Aggregate Prices hit their all-time high in March, reading in at 271.3. In April they were down (-23.9) to 247.4. As with many of the metrics in April, this is down slightly from historic, and likely unsustainable highs, but still well above the all-time average for the metric, which in this case is 223.9. The logistics industry is slowing down, but it hasn’t yet slammed to a halt.

The full report is careful, detailed and worth attentive reading. My much less careful take-aways:

  • US domestic flows remain robust, but are no longer rising as fast as last year.
  • Flow volumes are falling for some product categories.
  • Warehouse space remains tight, but inventory levels are improving.
  • Transportation capacity and utilization are much closer to what is needed for current flows.
  • US consumer demand has diversified from its fixation on stuff, reducing pressure on many supply chain components.

Looking beyond the April snapshot, there is increasing concern that transportation, after months of clawing back lost capacity, will be seriously challenged as prices-for-push moderate (and diesel explodes).

The LMI also gives attention to potential upstream pinchpoints related to China’s lockdowns. Here’s how the LMI analysts combobulate what we can currently hear and see in flows from China:

It is not unreasonable to expect a slowdown at US ports sometime in Q2 that is similar to what we saw in 2020, followed by further congestion as importers race to catch up. The differences between 2020 and 2022 is that during the former, US consumers were stuck at home, and last-mile delivery of goods buoyed transportation fleets around the country. It seems unlikely that major lockdowns will reemerge in the U.S. in 2022, meaning that U.S. consumers will continue to spend on services and in-person commerce…

Yesterday afternoon the Federal Open Market Committee acted, as expected, to increase interest rates and reduce the size of the current Federal Reserve balance sheet. Justifications for these actions include, “Inflation remains elevated, reflecting supply and demand imbalances related to the pandemic, higher energy prices, and broader price pressures…” and “COVID-related lockdowns in China are likely to exacerbate supply chain disruptions.”

To merely state the obvious: the world is moving through an extended inflection point. Demand and supply have experienced — and are experiencing — significant disruptions. War, plague, drought and other climate extremes, mass migrations, and more challenge our ability to effectively adapt. Making and finding a modicum of equilibrium continues to be elusive.