Month: July 2023

June Personal Consumption Expenditure

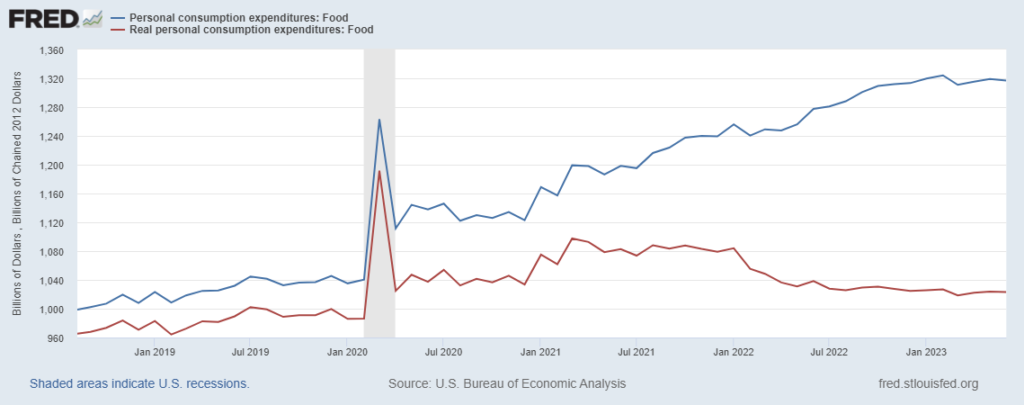
In January 2023 American consumers spent 1025.6 billion inflation adjusted dollars on Food-At-Home. In June we spent $1023.2 billion (see red line on the chart below). The take-away from May’s PCE still applies: “For most of the last year our real, inflation-adjusted expenditures for food have been flat or falling… and as a result, food supply chain dynamics have been much more predictable. Current production and distribution capacity has been well-matched with demand.”

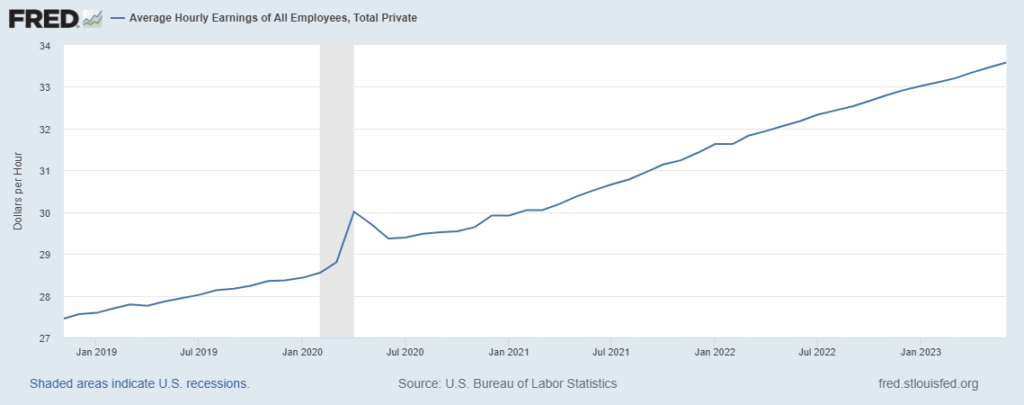
Beyond Food-At-Home expenditures, the Bureau of Economic Analysis reports, “Personal income increased $69.5 billion (0.3 percent at a monthly rate) in June… Disposable personal income (DPI), personal income less personal current taxes, increased $67.5 billion (0.3 percent) and personal consumption expenditures (PCE) increased $100.4 billion (0.5 percent). The PCE price index increased 0.2 percent. Excluding food and energy, the PCE price index also increased 0.2 percent… Real DPI increased 0.2 percent in June and real PCE increased 0.4 percent; goods increased 0.9 percent and services increased 0.1 percent.” (More)

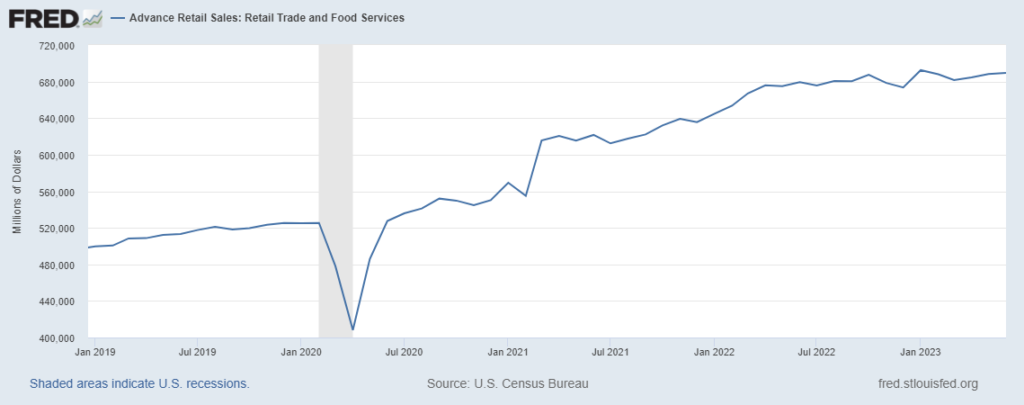
The Wall Street Journal offers this summary of recent economic data, “The U.S. economy grew solidly last quarter. Consumer spending, the primary driver of economic growth, rose in June for the sixth consecutive month and is increasing faster than inflation. The labor market has cooled this year compared with 2022 but remains on sound footing.” (More and more.) The Washington Post Editorial Board noticed, “Fed Chair Jerome H. Powell used the words “normal” or “normalization” nine times in his news conference Wednesday to characterize everything from supply chains to the job market.”

Vital proportions

[This is the second of a two-part post on proportional risks involving high volume, high velocity flows in contemporary supply chains. Please see the first part at Pfizer: proportional and functional risks.]

+++

Massimo Franceschetti — channeling Joseph Juran — makes a distinction between the “trivial many” and the “vital few” nodes in a network. I encourage similar attention to links.

Without huge effort it is usually possible to identify a small number of sources or movers (or routes) or consumer characteristics for a Pareto Proportion of demand and/or supply. Pareto noticed that there is a recurring tendency for a small portion of any distributed set to generate disproportionally high outputs for the whole set (more). Roughly eighty percent of Pareto’s peas came from barely twenty percent of his pea plants. One-fifth of all US grocery distributors are responsible for over four-fifths of grocery distribution. Only three US pharmaceutical distributors are responsible for more than three-quarters of pharmaceutical flows. Only three US maritime ports handle more container volume than all the rest combined.

An awareness of Pareto Proportions often answers important questions of who, what, and where, but in isolation these insights seldom explain the how and why of these concentrations. Some of how and why is related to characteristics of network centrality.

Origin implies movement. Destination requires movement. Nodes are usually intersections or, at least, once-upon intersections. A vertex of zero degree has no influence. An edge or arc is a boundary between, verging between, and usually both. A link is a connection, often one of many in a concatenation. Yet in network science literature an edge is typically treated as an incident of a vertex. Edges emanate from vertices. Our path emerges from one place and concludes in another place. We start here, look there, then we consider connections. We tend to focus on places more than on paths.

While this is one valid angle on reality, as a supply chain guy I am inclined to place much more emphasis on the simultaneous reality that we move. Network concentrations most often form from edges accumulated. Origin to destination is to suture steps between here and there. We close gaps between. The sometimes rough, random, ragged path that connects here to there is regularized with use. Edges can grow in magnitude and assume a general direction becoming flow channeled and vectors measurable.

Where many vectors meet, mathematicians speak of eigenvectors and eigenvector centrality (more). The German eigen is most commonly translated by the English “own”, but there is nuance in the German pointing beyond possession to being innate, essential, characteristic. Does the vertex own each vector or do converging vectors own their vertex? Jennifer Goldbeck explains:

The main principle is that links from important nodes (as measured by degree centrality) are worth more than links from unimportant nodes. All nodes start off equal, but as the computation [movement?] progresses, nodes with more edges start gaining importance. Their importance propagates out to the nodes to which they are connected. After re-computing [moving? flowing?] many times, the values stabilize, resulting in the final values for eigenvector centrality. [Bracketed questions are mine, not Dr. Goldbeck’s.]

Contemporary demand and supply networks also demonstrate outcomes consistent with Betweenness Centrality, a measure of which nodes have the shortest paths between other nodes. Betweenness can reveal the most optimal hubs in a complex network. (More, including the three graphs shown below.)

When the Pfizer Rocky Mount facility — or the Abbott plant in Sturgis or the Colonial Pipeline or the Port of Jacksonville (or most ports) or the I-95 (or I-5) corridor — has a problem, my risk assessment is almost always shaped by a sense of network centrality. What proportion of flows for my network-of-concern depends on the node/channel having problems? To serve fuel flows between Atlanta and Baltimore (and Knoxville and places in-between), the Colonial Pipeline is an irreplaceable Giant Component. Within 48 hours it was clear enough that temporary loss of the Rocky Mount node would have critical product-specific consequences but in terms of the sterile injectable market (much less the whole US pharmaceutical network), even when fully operating, the Rocky Mount node would be yellow or orange (not red or deep red) on the network mapping examples below.

One more angle of assessment: In my experience contemporary high volume, high velocity demand and supply networks are especially predisposed to Hourglass Effects. Sabrin and Davrolis explain, “Many hierarchically modular systems are structured in a way that resembles an hourglass. This “hourglass effect” means that the system generates many outputs from many inputs through a relatively small number of intermediate modules that are critical for the operation of the entire system, referred to as the waist of the hourglass.”

I originally perceived — and still perceive — that the Pfizer Rocky Mount facility is a good candidate for hourglass effects. Various materials are gathered in a shared, quality assured space, staffed by technologists, scientists, logisticians, and others with overlapping expertise, to produce a wide variety of specific — but category-similar — outputs (e.g., sterile injectables) by applying a small set of “modular systems” across sourcing, making, and moving outputs.

These modular functions at the waist (I actually prefer: neck) of the hourglass are reasonably common in contemporary demand and supply networks. Grocery distribution centers and maritime container ports and many oil refineries are confirmed sources of hourglass effects. The modularity and adaptability of these functions are fundamental to the efficiency and (in most cases) resilience of contemporary supply chains (see the last page of Sabrin and Darvolis to learn more about why). But when these modular functions receive a direct hard hit there is also a chance that the whole hourglass may shatter (more, see page 113). Below, in the second image, are some personal notions of hourglass effects.

These three risk lenses — Pareto Proportions, Network Centrality, and Hourglass Effects — are obviously not exhaustive. These are personal prescription “safety glasses” that I keep handy in case of potential catastrophe. They help me see through smoke, flame, flood, and worse. Last Saturday when my risk assessment related to Rocky Mount suddenly plummeted from a flood alert to fixing a leaky pipe, friends and colleagues were surprised. I hope this helps explain what I perceived and why I pivoted.

Pfizer: proportional and functional risks

On Wednesday, July 19 shortly after noon local-time an EF-3 tornado did extensive damage north of Rocky Mount, North Carolina. Included in this target zone is a very large Pfizer manufacturing facility (see photo below).

Several initial reports indicated that one-quarter of sterile injectables consumed by US hospitals were produced at this facility. This is not correct. Recently the facility has been the source for one-quarter of Pfizer’s US production of these products — or, perhaps, eight percent of national consumption.

US Pharmacopeia has identified 150 individual medications sourced from Rocky Mount. Pfizer has identified over sixty products sourced from Rocky Mount “with less than 3 months’ inventory in the distribution chain.” (More and more.) On Friday, July 21 the FDA Commissioner said, “Our initial analysis has identified less than 10 drugs for which Pfizer’s North Carolina plant is the sole source for the U.S. market.” Pfizer also explained:

Most of the damage was caused to the warehouse facility, which stores raw materials, packaging supplies, and finished medicines awaiting release by quality assurance. Pfizer is working diligently to move product to other nearby sites for storage and to identify sources to replace damaged raw materials and supplies. Pfizer is also exploring alternative manufacturing locations for production across our significant manufacturing presence in the U.S. and internationally and across the company’s partner network. After an initial assessment, there does not appear to be any major damage to the medicine production areas.

In the hours after the tornado strike Pfizer and several pharmaceutical wholesalers placed a wide range of medications on allocation, restricting new purchases to preexisting patterns.

For the usual purposes of Supply Chain Resilience there is a substantive distinction between Tracking Flows and Tracing Products. Flow impediments almost always threaten time-extended, wide-area, high population consequences. Product problems — in the case of most products — have much more constrained consequences. Product tracing exceptions to this principle (such as water and fuel) tend to prove the rule (exceptio probat regulam). Water, fuel, and similar products involve wide-area, time-extended flows serving high populations.

On Thursday morning last week, some credible information incorrectly signaled that several different products within a similar category (sterile injectables) originated from a single source for one-quarter of national flows. By late Friday afternoon corrected information prompted an understanding that, instead, Rocky Mount was the single source for less than one-tenth of national flows. By Saturday morning — looking at an early list of products available only or mostly from Rocky Mount — my risk-assessment plummeted from flood-level to something closer to a leaking pipe.

As a matter of strict volume, exposed risk was reduced by about two-thirds (8 percent vs. 25 percent). But as a matter of priority, my personal sense of strategic risk fell much more. Does this shift simply represent an exchange of cognitive fallacies? Or are there circumstances where the difference between a one-fourth proportion and a one-twelfth proportion totally — and rationally — transforms the strategic context?

My very fallible intuition is informed by a (potentially) rigorous empiricism regarding a network’s degree distribution. In network science terms my flow orientation is especially sensitive to the presence or absence of a hub (aka Giant Component or Giant Island or Strongly Connected Component and more). Demand and supply networks consist of nodes and links (aka vertices and edges). How connected are these nodes and links? How dependent and interdependent are these nodes and links? Are flows (of information, money, material, or more) more evenly distributed or more concentrated among these nodes and links? What portion of hospitals (demand nodes) are dependent on outputs from any single production and/or distribution node?

One of my favorite network scientists explains:

In most real networks, the degree distribution is highly asymmetric (or skewed): most of the nodes (the trivial many) have low degrees while a small but significant fraction of nodes (the vital few) have an extraordinarily high degree. A highly connected node, a node with remarkably high degree, is called hub… This asymmetric shape of the degree distribution has important consequences for the processes taking place on networks. The highly connected nodes, the hubs of the network, are generally responsible for keeping the network connected. In other words, the network falls apart if the hubs are removed from the network. On the other hand, since hubs are rare, a randomly chosen node is most likely not a hub, and hence the removal of random nodes from the network has a negligible effect on the network cohesion. Substantially, networks with long tail degree distributions are resilient to random removal of nodes (failure) but vulnerable to removal of the the hub nodes (attack).

The Pfizer facility at Rocky Mount is clearly non-trivial, but its degree distribution has been much less than initially reported. Rocky Mount is an important network intersection, but something less than a hub. Temporary loss of flow from Rocky Mount does create more — and noticeable — network disequilibrium for several medications. But crucially this network has been able to preserve its cohesion (remain substantially connected) even with failure of the Rocky Mount node.

What are proportional characteristics that distinguish a hub from a non-hub? Come back soon. I will try out a possible answer for your consideration.

Tentative UPS-Teamsters Agreement

According to both the company and the union a new wage agreement has been reached. On top of other contract adjustments mutually undertaken before the early July breakdown in negotiations, this should be enough to avoid a strike, significant economic disruption, and delayed/congested flows of essential healthcare products. According to Bloomberg:

The Teamsters won several concessions important to its members, including eliminating a class of drivers who earned less, air conditioning in new vehicles and an additional paid holiday… The unionized workers also got pay gains. Existing full- and part-time UPS union workers will get $2.75 an hour more in 2023 and $7.50 per hour over the five-year contract, according to the union. Part-time workers will get a raise to no less than $21 an hour compared with the starting part-time wage of $15.50 for 2023 in the existing contract. Delivery drivers will have an average top rate of $49 an hour…

Whew… As previously addressed here and here and here, a strike was going to be bad. Some substantial portion of parcel and other UPS flow capacity would have gone missing. There is no ability to “replace” the roughly one-quarter of national parcel flows operated by UPS. Congestion in parallel channels would have slowed and complicated surviving capacity in many — sometimes surprising — places.

UPS strike: non-delivery of healthcare products

If the Teamsters strike when the current contract with UPS expires on July 31, distribution of some pharmaceuticals and medical goods will be seriously disrupted. This disruption will result directly from reduced and delayed deliveries by UPS and from related network congestion slowing and delaying other parcel deliveries. Prior posts have given particular attention to the potential impact on home-delivery of chronic care medications (here and here).

On Friday a letter was delivered to President Biden from a coalition of US business organizations. The letter includes the following paragraph. I have added the bold highlight.

UPS is a vital lifeline for America, moving between 5% and 6% of U.S. GDP, or $3.8 billion in goods, per day. Parcels delivered by UPS include cancer screening tests, semiconductor chips, baby formula, back-to-school kits, critical parts for agricultural, construction, and telecommunications equipment, and the everyday supplies needed to keep thousands of small businesses running.  America also relies on critical medical deliveries enabled by the predictability and reliability of the UPS network, such as vaccines, medical devices, and life-saving medication.  Meanwhile, UPS’s competitors have stated publicly that, in the event of a work stoppage, they do not have the capacity to absorb the 20 million packages the UPS delivers per day. 

Each of the arguments listed are valid. I am especially glad to see the bold sentence included.

One of the signatories to the letter is the Health Industry Distributors Association (HIDA). The CEO of HIDA has added, “The supply chain relies on small parcel delivery to get supplies to patients in their homes, doctors’ offices, first responders, and clinics… We strongly urge the parties and the Biden administration to avoid a work stoppage at all costs.”

Since my July 12 post raising these concerns I have had substantive discussions with a variety interested parties. I have been interviewed by several major media. Despite my efforts, the healthcare implications of this potential supply chain disruption have not been emphasized. Instead, there has been attention to labor/management conflicts and broad economic consequences. These are certainly relevant, but I wonder why healthcare implications have almost been avoided.

The healthcare implications of the strike involve risks where proactive measures taken by patients and clinicians could mitigate consequences — at least that was the case ten days ago. Mass mitigation actions concentrated over the next nine days carry some new risks of their own. The difference between prudent self-care and self-harming (system-harming) beer-game swilling supply-chain killing explosive consumption typically involves how-much-how-quick and how-well-calibrated with authentic needs. This is seldom compatible with a panicky Fear-Of-Missing-Out.

What was possible on July 12 is less doable and constructive on July 22. If there is a strike, mitigation potential will be even worse on August 2. Especially when dealing with high volume, high velocity complex adaptive systems — such as many contemporary supply chains — sparse actions taken earlier are almost always more helpful than dramatic actions taken later.

For many reasons, I hope next week’s renewed UPS-Teamsters negotiations are successful and a strike is avoided.

PJM has Christmas in July

PJM is the Regional Transmission Organization (RTO) that coordinates electrical flows involving thirteen states and the District of Columbia. It plays a key role advancing the safety, reliability, and security of the bulk power system for its operating area and well beyond. Depending on your angle of observation, PJM could be the strongest of all the RTO’s serving the North American grid.

PJM has now released its Event Analysis and Recommendations Report for a very close-call experienced in late December last year. It is a well-written, well-organized, very readable report. To some it may sometimes sound a bit defensive, but for what its worth this insider analysis is well-calibrated with the reality I have been able to see from the outside.

Please download the whole report (same link as above) and at least carefully read the Executive Summary. To entice you to do so, here is my translation of some key findings into Supply Chain Resilience lingo:

During Christmas week last year, sufficient upstream capacity existed to fulfill electrical demand. High demand was expected. Downstream demand was even higher than expected: “PJM’s load forecasts for Dec. 23 and Dec. 24 were approximately 8% under the actual peak… rapidly falling temperatures coincided with a holiday weekend that combined to produce unprecedented demand for December.” The consequences of under-estimating demand were amplified by over-estimating how much supply could be converted from capacity to actual flow. “Complications arose on Dec. 24 resulting from the unanticipated failure of generation resources that were called into the operating capacity on that day. At one point, almost a quarter of the generation capacity – 47,000 MW – was on forced outages.” These forced outages were concentrated in the sources of capacity — natural gas generators — that were widely considered the most reliable. “When examined over the entire generation fleet, gas generators accounted for 70% of the outages on Dec. 24. Most outages were caused by equipment failure likely resulting from the extreme cold, though broader issues of gas availability also contributed to the outages.” Pull was at least eight percent higher than expected. Push was about one-quarter less than expected.

Please don’t depend on the reductionism of the paragraph above. Please read the PJM report. This blog has given ongoing attention to last year’s Christmas Eve surprise (e.g., here and here) because 1) grid capacity — especially related to imbalances of growing demand and constrained supply — will continue to trouble electric reliability for years-to-come — and 2) in my experience Supply Chain Resilience is often undermined by insufficient attention to demand dynamics and over-confidence in supply. There is still too much old-fashioned logistics thinking and not yet enough network science thinking and doing.

+++

July 25 Update: S&P Global reports on the PJM self-study and a July 24 stakeholder review session. Several issues are referenced, including, “The grid operator’s current efforts to overhaul its capacity market add another layer of complexity to addressing winter storm lesson learned because many capacity market considerations overlap with other areas of the market.”

July supply chain vitals

Every four to five weeks I update the following indicators. Here are the June and May updates. These are not comprehensive indicators. For comprehensive please see other sources, such as the Global Supply Chain Pressure Index or the Logistics Managers Index. But combined with more comprehensive measures, these five factors give me a finer sense of overall flow capacity, current discharge, and emerging conditions.

North American Agricultural Production:  On July 14 the USDA reported mostly robust conditions, “The 2023/24 U.S. feed grains supply forecast is raised to 444 million metric tons this month, up 0.9 million tons—as increased acreage for corn, sorghum, and barley raised production by 2.4million tons. Yield reductions in corn, barley, and oats tempered greater supply growth. Beginning stocks are down 1.5 million tons to 38 million. Supply is projected at 46 million tons above the last marketing year. Projected feed grain use is raised slightly to 384 million tons. Ending stocks are projected at 190 million tons, down slightly from last month but 22 million tons higher than 2022/23.” Early July rains have, for now, reduced concerns about US harvests. Recent rains in Alberta and Manitoba improved crop conditions. But drought persists in Saskatchewan, Canada’s largest grain producer. A second year of drought (more) and extreme heat is seriously impacting Mexico’s agriculture and human hydration (more). Monday’s cancelation of the agreement facilitating grain shipments from Ukraine through the Black Sea will reduce global supplies and support higher-than-otherwise prices (more and more). [July 20 Update: global wheat prices soar on warning that Russia has mined Ukrainian grain ports.]

Global Natural Gas Demand and Supply: Extreme, sustained heat in North America, Europe, and Asia (more and more) has prompted record-setting electric generation — and increased the electric utility sector’s demand for natural gas. But manufacturing sector demand, especially in Europe and China, remains comparatively low. As a result, front-month European futures prices for natural gas are well below last year’s very strong pull (see chart below). But Tsvetana Paraskova warns longer-term price behavior is beyond confident prediction, “Volatility… will continue as prices and demand ahead of and during the coming winter will depend on two factors that are out of EU control—the weather and the contribution of renewable energy sources to the mix depending on the weather.” For a mind-bending bit on possible natural gas supply dynamics, please see this July 10 post.

China Export Volumes and Value: Reuters reports, “Outbound shipments from the world’s second-largest economy slumped a worse-than-expected 12.4% year-on-year in June, data from China’s Customs Bureau showed… following a drop of 7.5% in May. Related, China’s GDP growth decelerated significantly during the second quarter ending June 30. According to the New York Times, “output was only 0.8 percent higher in the second quarter than the first quarter. When projected out for an entire year, that is a growth rate of a little over 3 percent a year, down from about 9 percent in the first quarter.” The South China Morning Post headlined, “Recovery is going from Bad to Worse” (until the headline was edited). In any case, global demand has slowed, as a result China’s — still enormous outbound flows — are not growing nearly as fast as in the past. (More and more.)

North American Grid Capacity: North American grids — and plenty of others — are undergoing a significant transition. This transition will be especially intense over the next decade (here and here). Part of this transition is to better network current grids so that each can share the strength of all. The sometimes treacherous nature of this transition is exemplified by what happened in Texas during Winter Storm Uri and other grids on Christmas Eve last year (more and more). I was expecting this summer to challenge the grid. It certainly has (here and here and here). But, so far, the North American grid has met this challenge. Capacity has been sufficient to meet several record-demand days, especially when grid operators have not been stingy with their demand projections.

US Personal Consumption Expenditures: The May PCE suggested real (inflation adjusted) expenditure growth to be flattening (more). Yesterday’s report on retail sales indicate this behavior mostly persisted in June (see second chart below). According to Bloomberg, “The value of retail purchases rose 0.2% in June after an upwardly revised 0.5% increase in May, Commerce Department data showed Tuesday. The figures aren’t adjusted for inflation… Sales increased in seven out of 13 retail categories last month, including advances at non-store retailers, electronics stores and furniture outlets. The value of purchases at building materials stores, gas stations and grocery stores declined.”

Audacious (foolish?) generalization: With notable and deeply unfortunate exceptions, global capacity for effectual demand is significant. Compared to some prior periods, the rate of demand growth has moderated. The current level of demand is mostly being fulfilled… and prices for fundamentals (e.g., food and fuel) have fallen back from much higher 2022 patterns. Because the growth-rate is modest, supply capacity is well-adapted and mostly well-matched with demand capacity and even demand velocity. Risks to this equilibrium may be emerging, but as a general rule are not the predominant feature of mid-July high volume, high velocity supply chains.

+++

July 25 Update: S&P Global has a helpful roundup of US refined product exports, “US refineries are finishing their ramp-up to full rates following a heavier-than-normal maintenance season, eclipsing restarts from around the globe. With ongoing refinery downtime in other regions like Latin America and Asia expected to continue through August, export demand for US refined products is expected to stay robust.”

Teamsters Strike: estimated losses

According to a Michigan-based economic consultancy if there is a Teamsters strike against UPS when the current contract closes on July 31:

  • A 10-day strike would likely furlough 340,000 workers, who are currently earning annual wages of approximately $90,000 per year (excluding benefits), resulting in wage losses of $1.1B.
  • Only a fraction of impacted deliveries would be filled by FedEx, USPS, other carriers, or direct delivery.
  • UPS customers could incur losses in excess of $4 billion.

Reuters and other media are reporting these potential economic consequences (here and here). Analysis by the Anderson Economic Group (same link as above) also highlights likely impacts on flows of crucial healthcare products (more). This specific risk has not — yet — received significant public attention. Over the weekend I reached out to two senior hospital supply chain professionals. Neither had begun to seriously consider potential risks or mitigation. While mid-stream operators are very aware (and worried) regarding potential strike risks, too many downstream players have not yet anticipated potential consequences… now two weeks ahead.

Last week (July 12) this blog gave particular attention to the strike’s potential impact on home delivery of chronic care medications. I asked three questions for which I still do not have answers.

UPS indicates that non-union employees are being trained to support “business continuity.” The Teamsters chief says he is waiting for UPS to call with a revised offer.

+++

JULY 18 UPDATE: The Bloomberg Supply Lines newsletter has a good round-up on UPS economic consequences (and a VERY good set of charts on recent global supply chain behavior). But — again — silence on potential slowed flows in the healthcare sector and related human consequences. Another Bloomberg report a few hours later offers, “Many logistics experts and financial analysts predict that a tentative agreement will be reached before the contract expires, though confidence has dwindled as the deadline approaches and talks are at a standstill. Many point to the lessons learned during the 15-day UPS strike in 1997: UPS ended up giving in to union demands after the company’s profit and service reputation were both hurt. As recently as May, UPS Chief Executive Officer Carol Tome said she expected to reach a deal before the contract expires.”

JUNE 19 UPDATE: UPS says it expects negotiations to resume with the Teamsters. According to Reuters, the company has a “better offer” to present. The Wall Street Journal explains:

A major sticking point is pay for part-time workers, which account for roughly half of the Teamsters workers represented by the current negotiations. The Teamsters are seeking starting pay for part-time workers north of $20 an hour. Currently, the minimum part-time hourly pay starts at $16.20, and could be higher in places where there is more competition for labor. UPS said that union-represented part-time workers make on average $20 an hour after 30 days. The union says there is high turnover among part-time workers in part because of the low pay, and that the majority of part-timers want to transition to full-time positions. The company said 38,000 part-time employees advanced to full-time positions between 2018 and 2022. 

June CPI

Since February US demand for food — especially Food-At-Home (groceries)– has moderated. The June Consumer Price Index suggests this trend is continuing (see chart below). As demand growth has flattened it has been easier to fulfill. Demand and supply — pull and push — are currently close to equilibrium. Yesterday the Bureau of Labor Statistics reported, “The food index increased 0.1 percent in June after increasing 0.2 percent the previous month. The index for food at home was unchanged over the month while the index for food away from home rose 0.4 percent in June.” Here are a few more details on Food-At-Home.

Two of the six major grocery store food group indexes increased over the month. The index for fruits and vegetables increased 0.8 percent in June, following a 1.3-percent increase in May. The cereals and bakery products index rose 0.1 percent over the month. The index for meats, poultry, fish, and eggs decreased 0.4 percent in June, as the index for eggs fell 7.3 percent over the month after falling sharply in May. The other food at home index decreased 0.2 percent in June after increasing 0.4 percent the previous month. The index for dairy and related products fell 0.3 percent over the month, and the index for nonalcoholic beverages declined 0.1 percent in June.

What I perceive is happening (though reasonable people can disagree) is that with the case of Food-At-Home, both costs and demand have increasingly stabilized. Meanwhile Food-Away-From-Home (restaurants, food service, fast food) continue to see higher costs, (especially related to wages) and increasing seasonal demand. As a result, the greater pull on constrained push generates more price pressure (aka inflation) for FAFH than for FAH. (More and more and more.)

+++

July 14 Update: According to Bloomberg, “In food, overall units sold are down 2% this year, with some of the biggest declines coming in frozen meals, fruit juice and soup.”

July 15 Update: There are many factors that influence food purchases. I am inclined to focus mostly on “demand capacity” which is closely related to both real and perceived wage growth (or the opposite). Nominal wages have been increasing at a rapid rate (see chart below), but not always as sharply as increased prices (inflation). During May and June wages have outpaced inflation (here and here and here). According to Marketplace, “In May, wages just barely outpaced inflation by 0.2%. But in June, wages grew 1.2% faster. And while two months do not a trend make, this still feels significant. It’s a sign of a healthy economy when wages grow faster than inflation.”

UPS: Just in case

In 2022 UPS averaged more than 20 million deliveries per day (source). This reflects roughly a quarter of national parcel delivery flows (see chart below).  Over 80 percent of UPS volume is NOT next day or expedited. Last year Business-to-Consumer (B2C) shipments represented roughly 60 percent of average daily volume (B2B is most of the remainder).

UPS is especially focused on maintaining and growing volumes/profits associated with serving Small and Medium-sized Businesses (SMBs, accounting for about 30 percent of total UPS volume, more). Only three-hundred eighty UPS customers are the source of about one third of total volumes. These bigger volume shippers are in an especially uncomfortable place in case of a strike.  They have also been the most proactive in arranging alternatives. But Monday one long-time shipping friend confessed, “I’ve been working contingencies since early June but can’t find any real alternatives. Many B2C will not be shipped and many that are shipped will probably go missing until long after any strike is over.”

Amazon is a big UPS customer, accounting for 11.3 percent of 2022 UPS revenue (it was even higher in the past). In recent years this key relationship has become more competitive, as each party became increasingly concerned by their dependence on the other. Amazon now has substantial self-shipping capacity (see chart below). Mutual “de-risking” is underway and more is planned. Combine this dynamic with huge shifts and swings in parcel delivery prompted by the pandemic and even more caution than usual is needed when trying to use past-history to predict future outcomes. The 1997 UPS strike might as well have happened on another planet in terms of potential economic consequences (more and more).

The healthcare category is another UPS strategic priority.  According to the CEO, “Our goal is to become the number one complex healthcare logistics provider in the world.”  According to the CFO, during the first quarter of 2023, “Logistics delivered revenue growth driven by gains in our healthcare logistics and clinical trials business and increased operating profit.”  UPS began focusing on medical and life science logistics prior to the pandemic. The UPS contribution to rolling out cold-chain solutions for covid vaccines accelerated the scale and calendar for this strategy.  The 2022 UPS purchase of Bomi, an Italian healthcare logistics firm (here and here), reflects the significant priority UPS gives this higher margin product category.  The UPS Healthcare unit earned about $9 billion last year and has been expected to earn $10 billion plus this year (sans a Teamsters strike). 

In the event there is a Teamsters strike against UPS, parcel deliveries will be disrupted and delayed (more). The other big players in parcel delivery, including Fedex and USPS, do not have current capacity to absorb total UPS flows. Credible, data-informed analysis suggests less than one-third of UPS flows could be effectively carried into other preexisting parcel delivery flows. Moreover, if these others are undisciplined in trying to fill the gap, their effort to serve real needs (and claim market-share) will create knotty congestion in their own networks. While the strike continues, everyday in August will be Christmas in terms of volume potential for other players. 

There is existing excess capacity in the Less-Than-Truckload (LTL) service sector.  LTL can help fill the gap in local, regional, and long-distance logistics, but NOT for last-mile direct-to-consumers. There are other parcel carriers and  courier-type service providers (e.g. Uber, DHL, more) who will offer services to fill the last-mile gap. Prices will be higher and delivery times will lengthen, especially in more rural and other less intensely served geographic areas. Last mile will remain a challenge despite creative adaptations (though less challenging than would have been the case pre-pandemic, now that there are many more direct-to-consumer options).

Specific to medical and other life science products, there is existing excess capacity in the refrigerated transportation service sector (reefers). This sector will — already is — stepping up to provide UPS customers (and their customers’ customers) with options. But given constrained capacity, allocation decisions are likely… and allocations almost always generate collateral damage to overall network velocity and therefore volumes.

Any loss of preexisting flow this significant is a bit like going to war: suddenly a battalion of previously unrecognized interdependencies can — almost certainly will — come over the hill screaming and shooting.

But given what is set out above, I am most concerned about potential slow-downs and last-mile impediments related to medical goods, pharmaceuticals, and related life science product categories. This would be the first strike for the relatively new UPS Healthcare unit (and very new unit leader).  These are especially time-and-quality sensitive products. Alternate sources of delivery are not abundant, especially in terms of last mile capabilities.

Home delivery (AKA “prescription delivery”) of chronic care medications is increasingly common. USPS and UPS are the most common delivery options for this product category.  UPS can handle some controlled-substances that USPS will not handle (example).  A loved one receives her blood pressure medications every 90 days (more or less).  She currently has in-home stock sufficient through mid-September. The longer a labor action lasts, the more likely lack of timely and confident delivery options will create nervous buying — and diminished at-home inventory — that will prompt both urgently true and misleadingly false demand signals… hoarding… and other congestion-causing behavior in healthcare networks.

The anticipated labor action is unlikely to have a significant impact on upstream production. Core downstream demand for parcel delivery and other UPS services is unlikely to significantly shift in the near-term (and has recently been softening). But given the high proportion of midstream flows that depend on UPS capacity — and the potential slowing or stopping of these flows — demand signaling is likely to escalate and capacity will not exist to effectively fulfill demand.

Last Saturday when I asked my loved-one about her blood pressure medications, she had not given any recent thought to her prescription delivery schedule or current supply on-hand. Given her current inventory, the possible strike should not impact her. But for those whose prescriptions will run-out in the next three to six weeks, re-filling now could avoid serious problems in the near-to-mid term… and reduce stress on networks that will be plenty stressed if the strike happens.

I have asked — but have not received answers — on the following questions:

1.  Can HHS or FDA or others identify which high-volume chronic care medications are NOT handled by US Postal Service?   I bet these medications are sourced from a sparse handful of places/players. Does HHS etc. know who and where?  In extremis could USPS handle these products?  In any case, which high volume chronic care products will be most constrained by a strike?  Are there other essential medical goods, pharmaceuticals, or life sciences products for which UPS is an especially high-proportion carrier?
2.  Does HHS or ASPR or others know — or can they find out — if all UPS Healthcare flows also depend on Big UPS nodes, links, and labor… or are there some legacy (or otherwise) non-union carve-outs?  Does UPS Healthcare have capabilities to procure third-party logistics support during a strike?  Does it plan to do so?  Is the plan actionable?  Will the Teamsters actively resist or focus elsewhere? 

There are obviously plenty of other questions… and potential problems… and possible mitigation measures. We now have just over two weeks to do our best to be ready, while the Teamsters and UPS consider their options. Just In Case, while still hoping for Just In Time.

https://www.pitneybowes.com/content/dam/pitneybowes/us/en/shipping-index/pb-2023-parcelshippingIndexInfographic-v5.pdf