PJM is a regional transmission organization (RTO) that coordinates grid operations for Ohio, Pennsylvania, New Jersey, Delaware, Maryland, West Virginia, District of Columbia, and significant parts of Virginia, Illinois, Michigan, Kentucky and North Carolina.
About 4AM eastern on December 24 I sent several clients personalized messages that included something like:
This morning’s PJM Stage 2 emergency (more) is the result of an unprecedented (and unpredicted?) spike in demand, prompted by this bomb cyclone’s geographic scope, speed, and extraordinary rates of temperature change. In my judgment, PJM is probably the most operationally capable of the North American reliability operators. It also serves some of the densest demand. Dense demand tends to be more volatile — and this bomb cyclone is causing a rate of change in power demand that will challenge system capabilities.
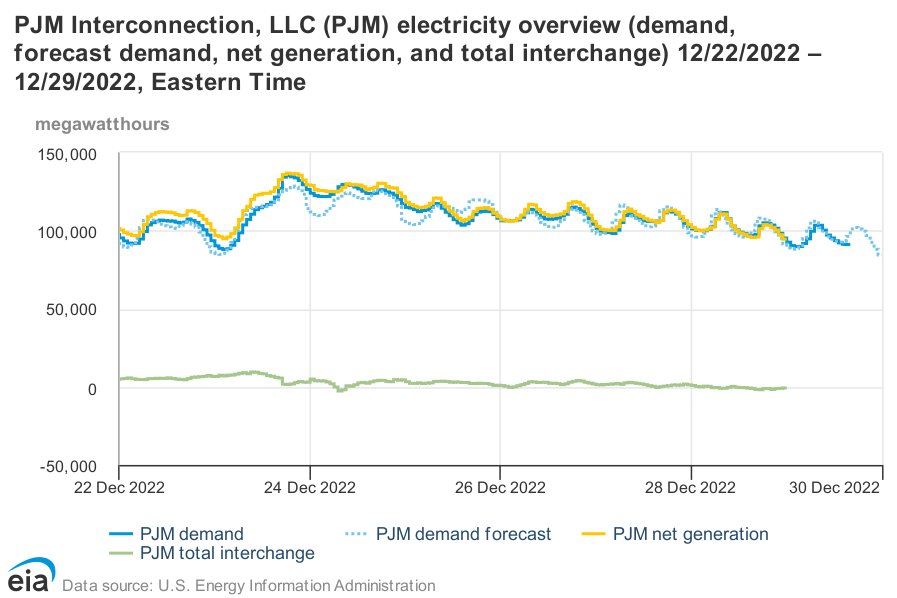
Below is a screen capture of the near-real-time chart that I spent two days watching at least as carefully as any magi watched any star.
The Friday night before and early Saturday morning of Christmas Eve is not the most promising moment for an outsider to figure out what is happening (and not happening) with grid operations anywhere. But what my sparse contacts and sources were telling me was also what Bloomberg reported, “Demand soared more than 9 gigawatts above forecasts Friday evening — much faster and higher than anticipated. That’s the equivalent of about 9 million homes just popping up on the grid on a typical day.”
Yesterday PJM reported out its own After-Action (please see 32 screen PowerPoint). In the PJM report, I perceive the demand component — and especially the rate of change aspect — is confirmed. PJM also provides very helpful background on the push to fulfill pull… and several problems that constrained push.
As reported by S&P Global,
PJM said it called over 155,750 MW into the operating capacity for Dec. 23. Based on generator availability data, “we believed we had almost 29 GW of reserve capacity available to absorb load and generation contingencies and to support our neighboring systems,” the grid operator said. Since Capacity Performance was implemented, PJM has typically seen a forced outage rate of about 5% with that going up to about 10% in extreme weather but the forced outage rates observed during this event “grossly exceeded” those averages, Bryson said. Capacity Performance requires that generators must meet their commitments to deliver electricity whenever PJM determines they are needed to meet power system emergencies and generators that exceed performance commitments will be entitled to funds collected from generators that underperform. “Generation outages were unacceptably high, and they occurred at the worst possible time for system operations,” he said. On the evening of Dec. 23, generation outages reached 34.5 GW and on the morning of Dec. 24 they reached 46 GW, or 23.2% of PJM’s total capacity, the grid operator said.
A full assessment is expected by mid-April. The final report will clearly — appropriately — go beyond the demand or supply question, both demand and supply issues are involved. But for broader purposes of Supply Chain Resilience, I suggest attention to demand’s rate of change is especially important because this risk accelerant is too often discounted or neglected.
Even robust high volume, high velocity supply systems will usually lag sudden and sustained demand spikes that exceed one-fifth of credible capacity. Sudden and sustained demand spikes are almost always associated with unusual, specifically unpredictable, factors that will complicate supply capacity. (Please also see toilet paper, canned chicken soup, N95 masks, semi-conductors, gasoline, and more.) But what cannot be specifically predicted can be strategically anticipated.