Month: July 2023

Natural Gas: too much, too fast? (!?#%!)

Starting in June last year I worked with many more qualified folks who were worrying — make that actively engaging — make that actively mitigating — make that pulling and pushing as much as possible — to deliver natural gas into Europe in anticipation of war-time winter. We did not have high hopes. It was much more a commitment to do the best possible.

Thanks to a mild winter, significant and sustained demand motivation, and myriad urgent, smart efforts across the planet by both public and private sectors, energy flows to Europe — and especially natural gas flows and inventories — exceeded our expectations.

So, it was with considerable and conflicting emotions that I read John Kemp’s July 6 column from Reuters. It is headlined, Europe’s Gas Storage is Filling too Fast. Here is a meaningful chunk (but you really should read the whole argument):

storage sites were already almost 79% full on July 4, compared with a prior 10-year average fill of just 60%…. the technical capacity of the storage system is only 1,130 TWh so space is on track to run out well before the start of winter 2023/24 on October 1… futures prices are under persistent pressure, pushing calendar spreads into a steep contango to boost consumption this summer while conserving it in the middle of winter 2023/24.

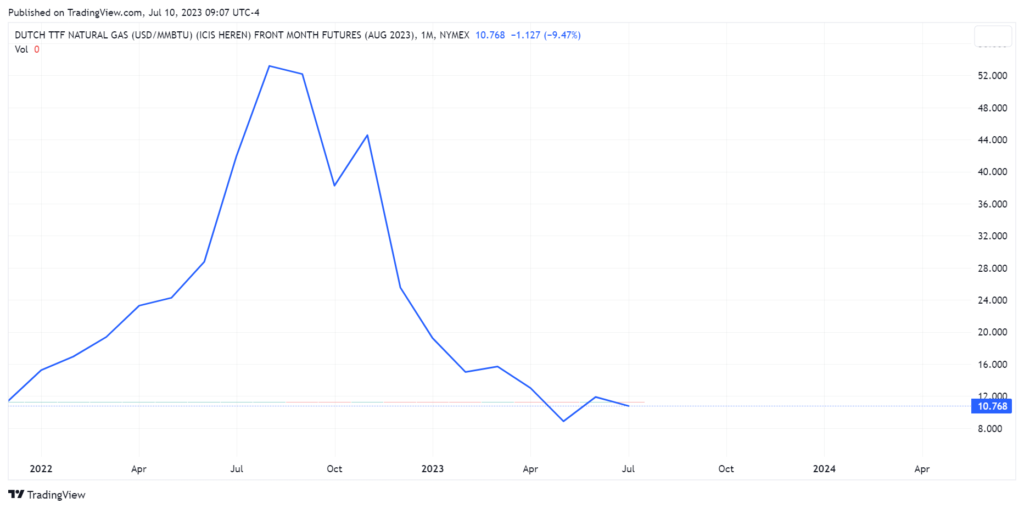
My head is spinning. If I am accurately tracking — and I welcome corrections — Europeans seem likely to fill their natural gas storage facilities much sooner than usual with comparatively low-priced current flows of natural gas. With fat — and fixed — inventories and anemic current demand, near-term futures prices have fallen precipitously since late last year (see chart below). For producer purposes, demand is too low now and looks likely to fall farther before the winter heating season begins.

Natural gas producers/shippers are wanting/trying/needing to motivate much more current consumption. One result is current low prices. Longer-term futures pricing suggests that without more consumption (and higher prices) now and into the autumn, there is likely to be less supply (and much higher prices) this winter... when fixed inventories and constrained flow capacity can be seriously challenged by any loss of supply (here) or sharp shift in demand.

Such as a stubborn polar vortex. According to Bloomberg, “Early winter cold is the scariest thing,” Samantha Dart, an analyst at Goldman Sachs Group Inc., said in an interview… Prices above €100 are still “very realistic.” S&P Global reports, “Potential risks for global gas requirements this winter are likely being underestimated, with a “strong tug of war” for LNG supplies likely between the developed Asian markets and Europe if demand surges because of the cold weather.”

So… despite current abundance, there is still reason for worry, engagement, mitigation, and much more.

Below: DUTCH TTF (benchmark) FRONT MONTH FUTURES FOR AUGUST

+++

July 18 Update: When I first saw this heading, “Gas, power markets face stress test as S Europe heatwave intensifies” — I wondered if this increased current demand might help mitigate the too much, too fast problem. According to S&P Global, “With scorching temperatures likely to persist across southern Europe, the region’s gas and power markets are set to come under strain, with demand on a steep upward trend.” But while this demand is well-above seasonal norms, it is not enough to slow the draw of natural gas into storage or even increase prices in sustained, substantial way. “Analysts at S&P Global Commodity Insights expect some price volatility if the heatwave persists. But they noted that the level of cooling demand was slightly lower than at the same time last year due to ongoing price sensitivity and because of cooling limits in public buildings in some cities.”

Fuel is flowing

US domestic inventories of gasoline and diesel ended the first half inside their multi-year averages. See two charts below. The US Department of Energy also (finally) confirmed that US refinery capacity has increased:

U.S. refining capacity (excluding U.S. territories) increased this year for the first time since the COVID-19 pandemic… U.S. operable atmospheric crude oil distillation capacity, the primary measure of refinery capacity, totaled 18.1 million barrels per calendar day (b/cd) at the start of 2023, up by 117,000 b/cd (0.6%) from 17.9 million b/cd at the start of 2022… The number of operable refineries in the United States—including both idle and operating refineries—decreased to 129 refineries at the beginning of 2023, down from 130 refineries at the beginning of 2022. The single refinery closure reflects the loss of a small facility in Santa Maria, California, with 9,500 b/cd of crude oil distillation capacity. Despite the loss of the Santa Maria plant, overall capacity increased because PBF Energy reactivated a previously retired crude oil distillation unit at its Paulsboro, New Jersey, refinery. The unit’s crude oil capacity increased from 100,000 b/cd in 2022 to 160,000 b/cd in 2023.

Constrained global energy demand — due to reduced economic activity — and significant US energy production have allowed US energy prices to remain much lower than last year when war-related supply disruptions prompted significant price spikes.

Upstream food capacity preserved

Rain last weekend has mitigated drought threatening the heart of US corn and soybean country. Please see maps below. Long term prospects remain treacherous, but crops — and yield potentials — have survived another week. The next USDA crop progress report should show an improvement from late June’s eroding chasm of poor crop conditions. On July 5 observers at the University of Illinois and Ohio State University wrote, “Much-needed rains recently came through the Midwest, increasing yield prospects and decreasing the chance of a significant drought like that in 2012.”

https://droughtmonitor.unl.edu/ConditionsOutlooks/CurrentConditions.aspx

+++

July 15 Update: Yesterday, July 14, Agweek reported, “The recent rains have helped to improve the corn and soybean crops, but rain continues to be hit or miss… The July 6 Drought Monitor map is starting to show improvement. The report is now showing 67% of the nation’s corn crop is in some stage of drought, 3% less than last week. Soybeans now have 60% of their crop in some stage of drought, also 3% less than last week.” Faint praise? See the July 10 Weekly Crop Progress report here (the “next” report, referenced above, was meant to point to July 17).

Bloomberg is reporting, “Water levels on the Mississippi and Ohio rivers are falling for a second straight year, raising the prospect of shipping problems along the all-important US freight routes… Widespread drought across the Midwest and lower than normal rains in parts of the eastern US are behind the falling river levels, which last year also plummeted to concerningly low depths. The Mississippi and Ohio rivers and their tributaries are major US freight arteries for moving coal, oil, natural gas, chemicals and commodities… Currently about 64% of the Midwest is in drought, the most in more than a decade.”

Demand pulls… and pulls and pulls

Since January the US economy has been navigating a spending plateau. It is a high plateau. In May Real Personal Consumption Expenditures were measured at $14,386 billion. In May 2019 real PCE was $13,037 billion (see chart below). The most recent PCE strikes me as consistent with the entirely constructive pre-pandemic trendline — disregarding all our turmoil in-between.

This morning’s US Bureau of Labor StatisticsEmployment Situation Summary for June reports historically low unemployment, continued (if moderating) growth in new jobs, and a slight increase in the labor participation rate among workers age 25-54 (the participation rate is flat as a ratio of total population). A friend told me, “job growth was going too fast for conditions, we are now back to a sustainable safe speed for where we want to go.” According to Bloomberg, “The increase in average hourly earnings followed similar gains in the prior two months, and was up 4.4% from a year earlier. The average workweek edged up.” Recent rates of wage growth exceed the inflation rate.

In addition to a mostly favorable employment context, many US households still enjoy “excess savings” (more and more). This savings buffer is gone for some and much reduced for most. But depending on who’s counting what, the amount of reserve cash still available is between $500 to $900 billion. No wonder the current Personal Savings Rate remains less than the pre-pandemic average. The overall money supply is well-off its late 2021 peak but well above pre-pandemic expectations. In other words, while economic growth is soft, demand capacity is strong… and US consumers are spending.

There are admittedly mixed signals regarding fulfillment capacity. Stubborn — and occasional surprise — points of friction can be found. More than normal? More than pre-pandemic? Atypical given level of demand and labor patterns?

At cruising altitude, the Global Supply Chain Pressure Index suggests helpfully fluid conditions. The Cass Freight Index for May shipments was a comparatively healthy 1.166. Since recovery from the Great Recession, a “healthy” total business inventory to sales ratio has typically ranged between 1.35-to-1.45. Significant supply chain stress was signaled when the 2021 ratio fell below 1.3. So far in 2023, the total business inventory to sales ratio has been flirting with 1.4 to one. According to one Federal Reserve analysis supply constraints are much less likely to be disproportional contributors to PCE inflation than between 2020 and the first half of 2022.

Then consider the second chart below. In May 2019 roughly one-third of new domestic manufacturers orders could not be fulfilled during the survey period. Between May 2019 and May 2023 nominal (not-inflation-adjusted) demand grew by nearly one-fifth, yet the proportion of unfulfilled orders edged up barely two percent.

US consumers are pulling and have the capacity to continue at close to current velocity. Domestic push capacity is about as well-matched to current pull velocity as it was pre-pandemic.