Supply chains perceive demand. Supply chains are pulled by demand. Contemporary supply chains organize, size, and time push toward demand. One way to estimate pull in US supply chains is real (inflation-adjusted) Personal Consumption Expenditures (here and here). The chart below provides an overview of pull patterns since 2007 (figured with constant 2017 dollars).
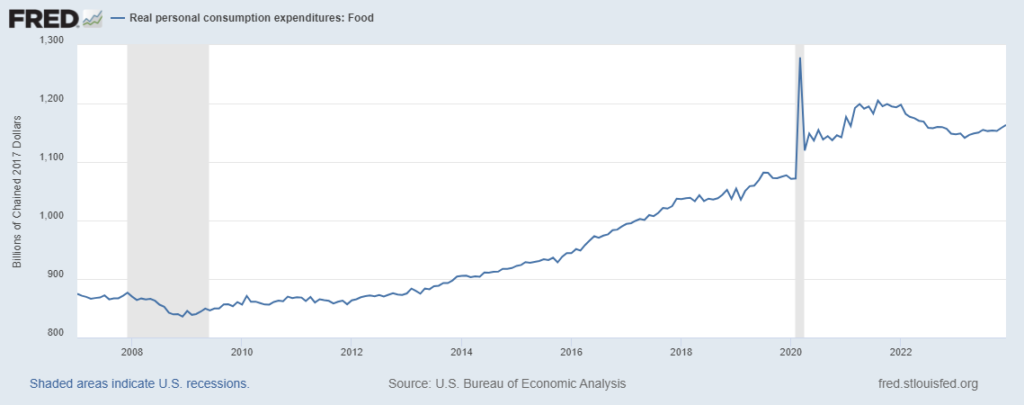
The dramatic variations in pull tracked from March 2020 until, let’s say, May 2022 help explain why push did not always fulfill demand back then. The boring consistency of expenditure on goods (real, physical stuff) since March 2021 suggests when (and why) the US supply chain “crisis” ended. That trembly but nearly straight red line also suggests why so many freight carriers are feeling trapped in a snowy, cold, redux of Groundhog Day (here and here) — without the laughs or romantic fizz of Bill Murray and Andie MacDowell. (But some see early signs of spring.) The second chart below reflects one important component of non-durable goods. In my judgment the slow but steady increase in demand for Food-At-Home is a healthy signal for Supply Chain equilibrium and potential resilience.
With average US wages increasing (here and here) and US consumption expenditures increasing even more (here and here and here) the current rough equilibrium between pull and push is likely to persist. As one freight market researcher recently commented, “Truckload spot rates are 12% above the seasonal pattern in January following the cold snap. While weather effects should revert in the coming months, freight is an outdoor sport, so the cycle will likely find a higher trajectory as the reversion happens amid tightening capacity and recovering demand.” [Or as Bill Murray said, Winter slumbering in the open air, wears on his smiling face a dream of Spring (and here)!]

